
Ron Harbour President Harbour Consulting Evolution of the

Ron Harbour President Harbour Consulting
Evolution of the Manufacturer / Supplier Continuum The Definition of an OEM Presented by Ron Harbour May 17, 2007

The Harbour Report™
Recent Clients
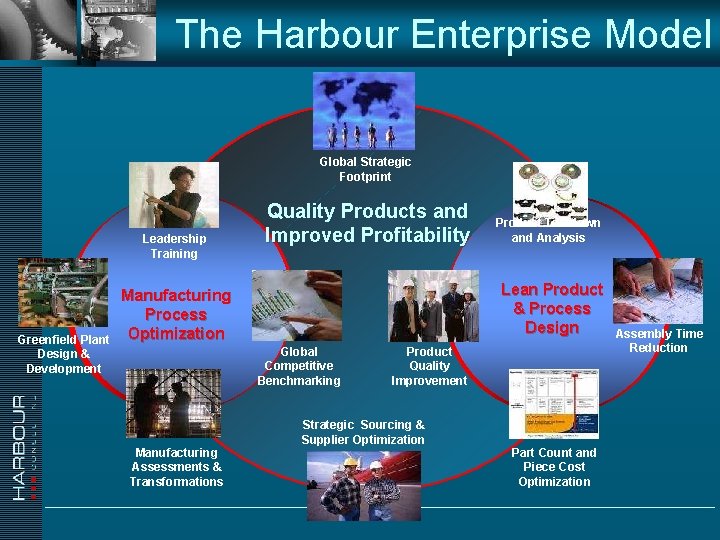
The Harbour Enterprise Model Global Strategic Footprint Leadership Training Greenfield Plant Design & Development Quality Products and Improved Profitability Lean Product & Process Design Manufacturing Process Optimization Global Competitive Benchmarking Manufacturing Assessments & Transformations Product Teardown and Analysis Product Quality Improvement Strategic Sourcing & Supplier Optimization Part Count and Piece Cost Optimization Assembly Time Reduction
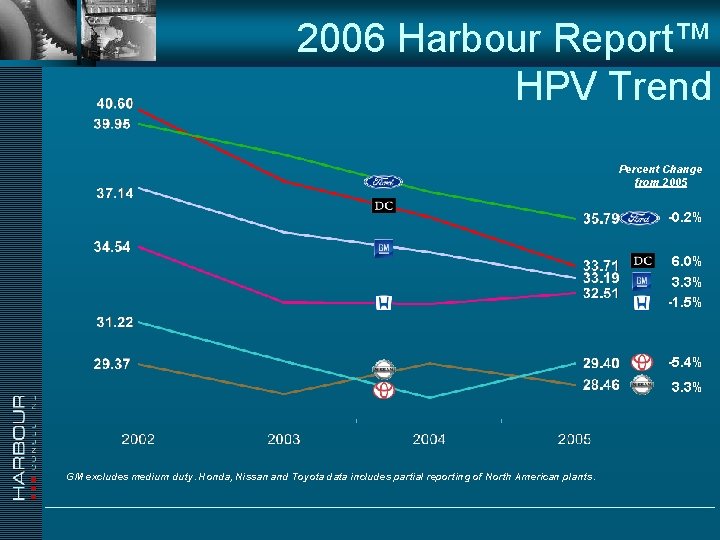
2006 Harbour Report™ HPV Trend Percent Change from 2005 -0. 2% 6. 0% 3. 3% -1. 5% -5. 4% 3. 3% GM excludes medium duty. Honda, Nissan and Toyota data includes partial reporting of North American plants.
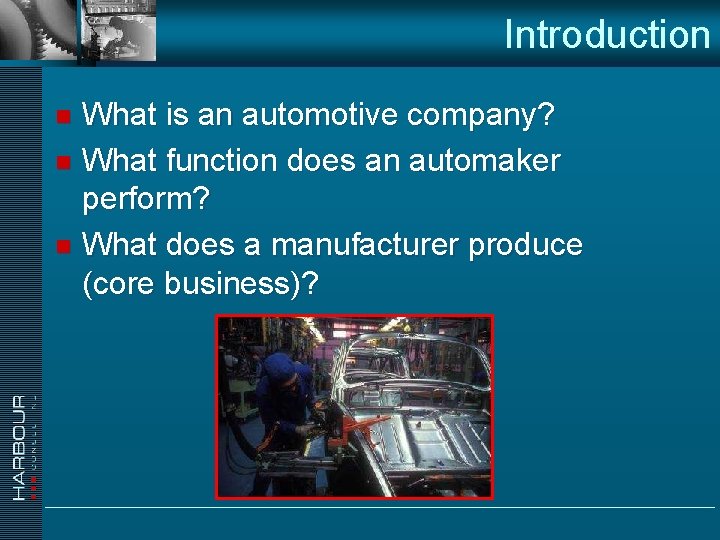
Introduction What is an automotive company? n What function does an automaker perform? n What does a manufacturer produce (core business)? n
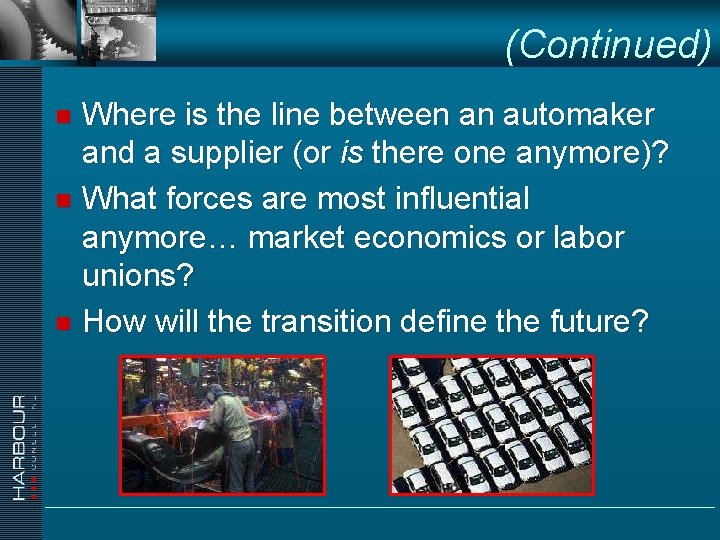
(Continued) Where is the line between an automaker and a supplier (or is there one anymore)? n What forces are most influential anymore… market economics or labor unions? n How will the transition define the future? n
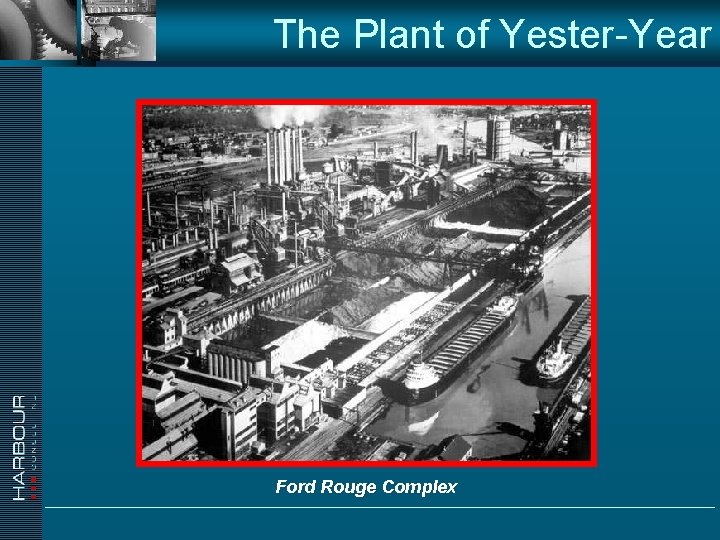
The Plant of Yester-Year Ford Rouge Complex
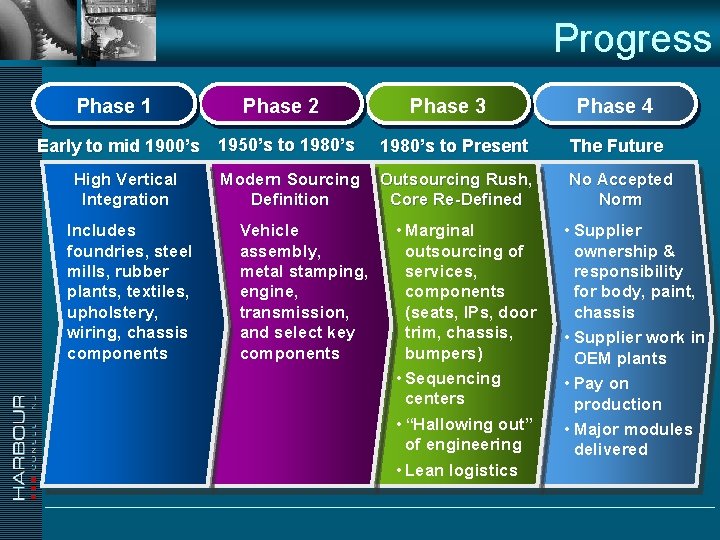
Progress Phase 1 Phase 2 Early to mid 1900’s 1950’s to 1980’s High Vertical Integration Includes foundries, steel mills, rubber plants, textiles, upholstery, wiring, chassis components Modern Sourcing Definition Vehicle assembly, metal stamping, engine, transmission, and select key components Phase 3 Phase 4 1980’s to Present The Future Outsourcing Rush, Core Re-Defined No Accepted Norm • Marginal outsourcing of services, components (seats, IPs, door trim, chassis, bumpers) • Sequencing centers • “Hallowing out” of engineering • Lean logistics • Supplier ownership & responsibility for body, paint, chassis • Supplier work in OEM plants • Pay on production • Major modules delivered
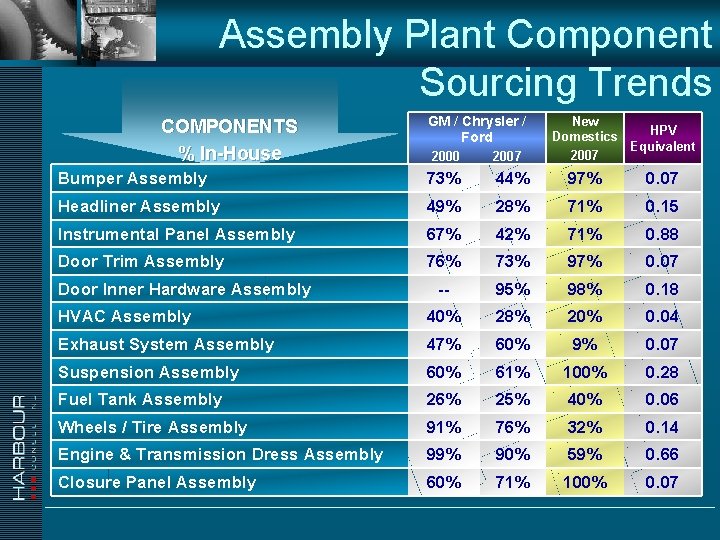
Assembly Plant Component Sourcing Trends COMPONENTS % In-House GM / Chrysler / Ford 2000 2007 New HPV Domestics Equivalent 2007 Bumper Assembly 73% 44% 97% 0. 07 Headliner Assembly 49% 28% 71% 0. 15 Instrumental Panel Assembly 67% 42% 71% 0. 88 Door Trim Assembly 76% 73% 97% 0. 07 -- 95% 98% 0. 18 HVAC Assembly 40% 28% 20% 0. 04 Exhaust System Assembly 47% 60% 9% 0. 07 Suspension Assembly 60% 61% 100% 0. 28 Fuel Tank Assembly 26% 25% 40% 0. 06 Wheels / Tire Assembly 91% 76% 32% 0. 14 Engine & Transmission Dress Assembly 99% 90% 59% 0. 66 Closure Panel Assembly 60% 71% 100% 0. 07 Door Inner Hardware Assembly
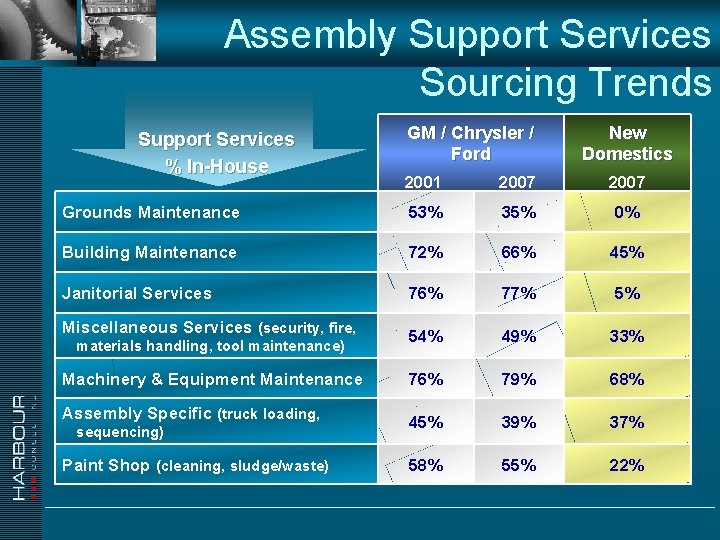
Assembly Support Services Sourcing Trends Support Services % In-House GM / Chrysler / Ford New Domestics 2001 2007 Grounds Maintenance 53% 35% 0% Building Maintenance 72% 66% 45% Janitorial Services 76% 77% 5% 54% 49% 33% 76% 79% 68% 45% 39% 37% 58% 55% 22% Miscellaneous Services (security, fire, materials handling, tool maintenance) Machinery & Equipment Maintenance Assembly Specific (truck loading, sequencing) Paint Shop (cleaning, sludge/waste)
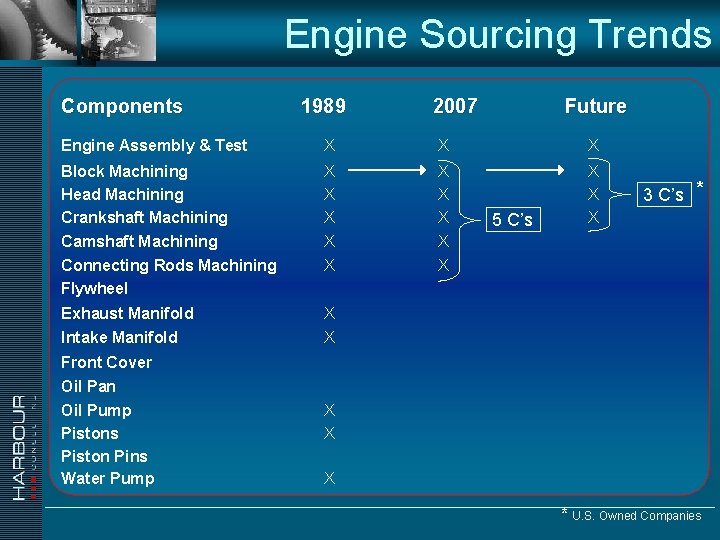
Engine Sourcing Trends Components 1989 2007 Future Engine Assembly & Test X X X Block Machining Head Machining Crankshaft Machining X X X X X Camshaft Machining X X Connecting Rods Machining Flywheel X X Exhaust Manifold X Intake Manifold X 5 C’s 3 C’s * Front Cover Oil Pan Oil Pump Pistons Piston Pins Water Pump X X X * U. S. Owned Companies
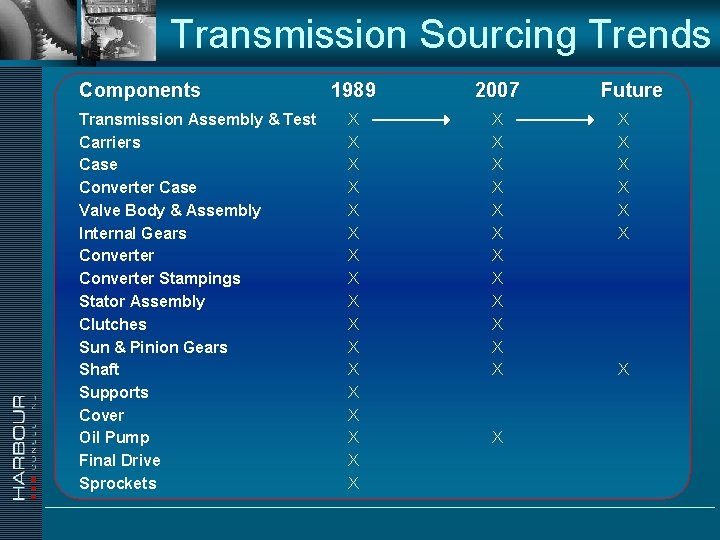
Transmission Sourcing Trends Components Transmission Assembly & Test Carriers Case Converter Case Valve Body & Assembly Internal Gears Converter Stampings Stator Assembly Clutches Sun & Pinion Gears Shaft Supports Cover Oil Pump Final Drive Sprockets 1989 2007 X X X X X X X X Future X X X X
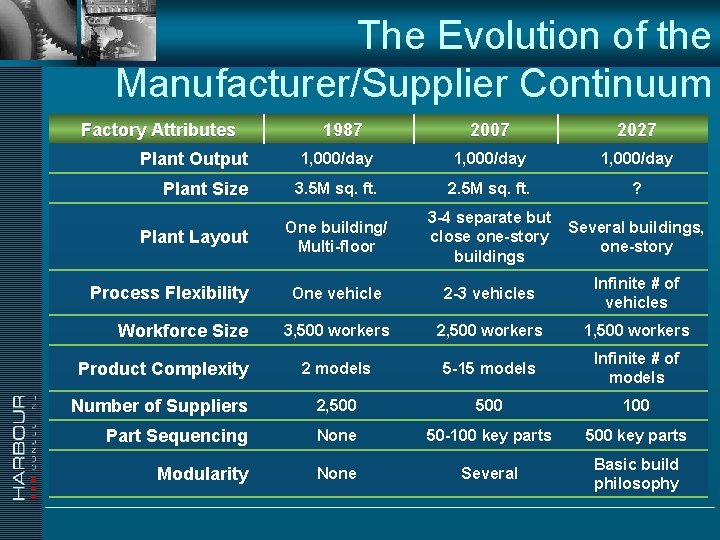
The Evolution of the Manufacturer/Supplier Continuum Factory Attributes 2007 2027 1, 000/day 3. 5 M sq. ft. 2. 5 M sq. ft. ? One building/ Multi-floor 3 -4 separate but close one-story buildings Several buildings, one-story One vehicle 2 -3 vehicles Infinite # of vehicles 3, 500 workers 2, 500 workers 1, 500 workers Product Complexity 2 models 5 -15 models Infinite # of models Number of Suppliers 2, 500 100 Part Sequencing None 50 -100 key parts 500 key parts Modularity None Several Basic build philosophy Plant Output Plant Size Plant Layout Process Flexibility Workforce Size 1987
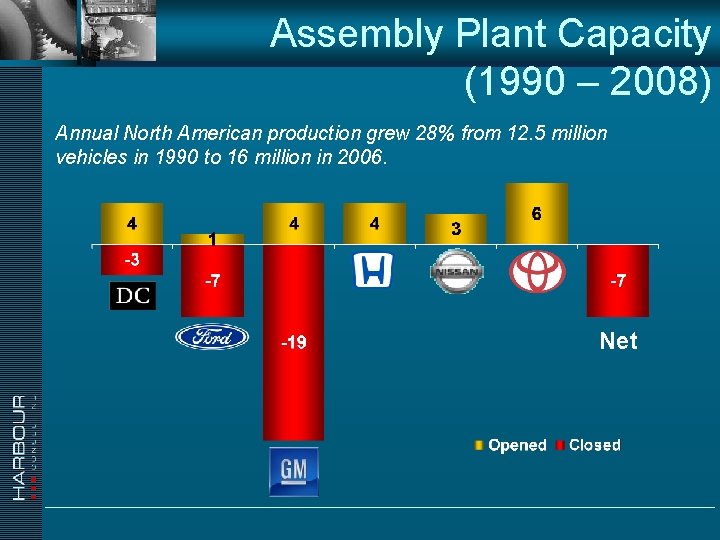
Assembly Plant Capacity (1990 – 2008) Annual North American production grew 28% from 12. 5 million vehicles in 1990 to 16 million in 2006. Net
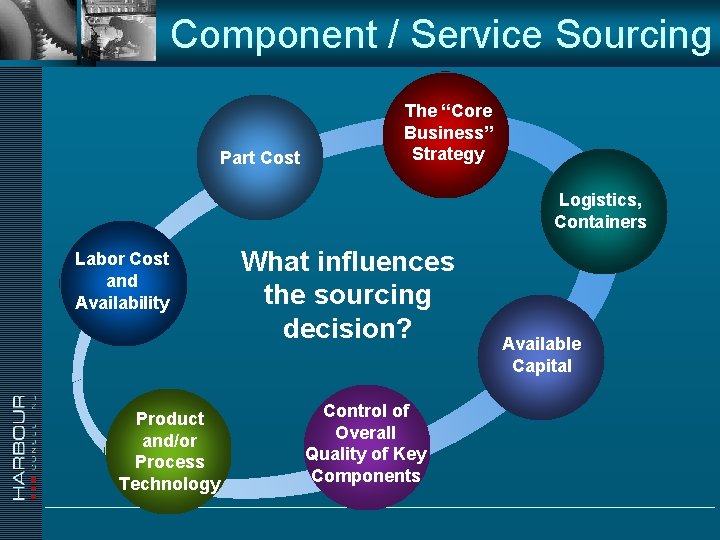
Component / Service Sourcing Part Cost The “Core Business” Strategy Logistics, Containers Labor Cost and Availability Product and/or Process Technology What influences the sourcing decision? Control of Overall Quality of Key Components Available Capital
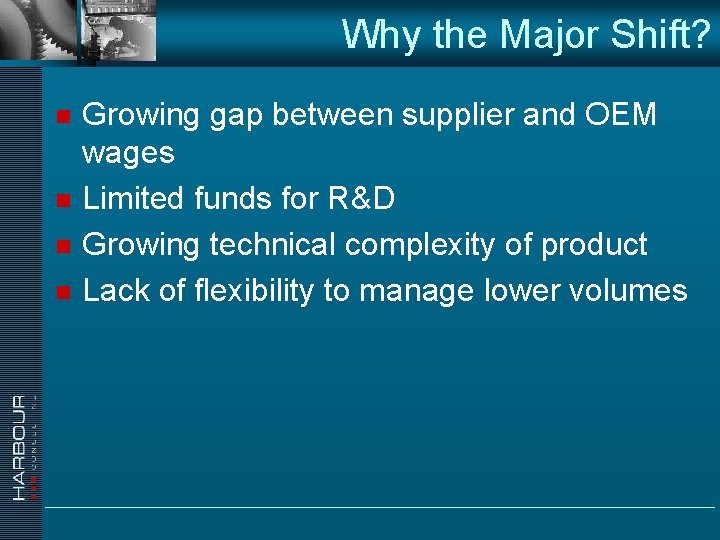
Why the Major Shift? n n Growing gap between supplier and OEM wages Limited funds for R&D Growing technical complexity of product Lack of flexibility to manage lower volumes
What Does the Future Hold? n n n Demand for more flexibility Less manufacturing process / performance differentiation Spread of capital required for new product development
- Slides: 19