Rollback and decapitation of a southfacing subduction beneath

Rollback and decapitation of a southfacing subduction beneath the Tadjik Basin and the Hindu Kush Reuben Creighton 1 Gordon Lister 1 Wim Spakman 2, 3 (1) Research School of Earth Sciences, Australian National University, Canberra 2601 Australia (2) Department of Earth Sciences, Utrecht University, Budapestlaan 4, Utrecht 3584 CD, The Netherlands (3) Center for Earth Evolution and Dynamics (CEED), University of Oslo, Sem Saelands vei 24, NO-0316 Oslo, Norway

2

3

4

5

7

8

9

10

11

What and Why? Data Sources 3 D Slab Surface Model • Seismic Tomography Model (UU-P 07) • EHB Hypocentre Catalogue • Global CMT Project 12

Interpretations A A′ Tomography Model: UU-P 07 • ‘Deep India meets deep Asia’ • (S. -K. Kufner et al. 2016) • Two converging subduction zones • (Chatelain et al. 1980; Burtman and Molnar 1993; Fan et al. 1994; Liao et al. 2017) • A single contorted slab • (Billington et al. 1977; Vinnik et al. 1977; Searle, Hacker and Bilham 2001) 13

Interpretations South Dipping Model NW North Dipping Model SE SE NW 14

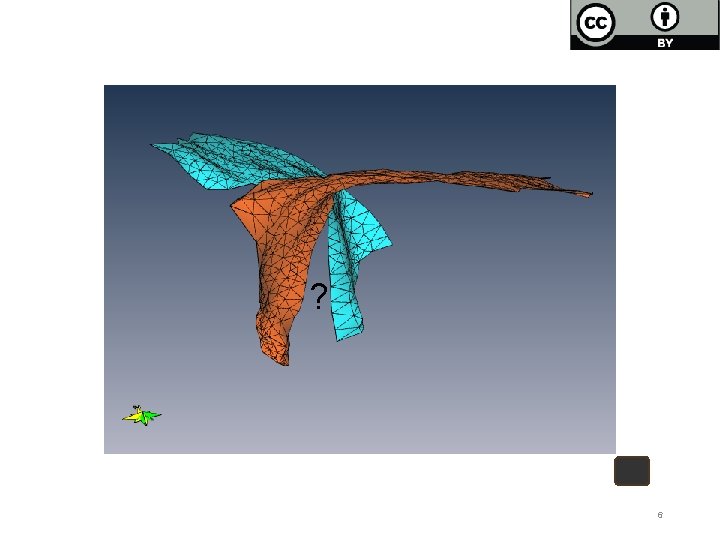
Slab Floating 15

Floated Slabs at Surface: 16

Hindu Kush Seismicity B CMT Hypocentres B B′ B′ 17

CMT Solutions in an arbitrary 3 D Box. • View is NW to SE (B’ to B in previous figure) • Units are kilometres for a uniform scale • Note the difference in clustering and orientation between groups. 9

N 19

N 20

N 21

N 22

N 23

N 24

N 25

N 26

N 27

N 28

Blue = Fault Plane Red = Slip Line Note highly coordinated clustering towards focal points. 29

N 30

N 31

N 32

N 33

N 34

N 35

N 36

N 37

N 38

N 39

N 40

N 41

42

Decapitation Model: • Green dots represent CMT hypocentre locations • Perspective is ~West to East into the slide. Upper group predominantly shallow dipping 200 km 100 km 300 km Lower group predominantly steeply dipping Highly clustered orientations 400 km 43

NW SE 44
- Slides: 44