Roles of UpperLevel Processes in Tropical Cyclogenesis D

 preconditioning of a")


 Time-height cross section of δT=T(z, t) –T 0(z, t 0) (shaded), area-averaged wind")
 and temperature changes with respect to the initial conditions,")
 Time-height cross section of δT=T(z, t) –T 0(z, t 0) (shaded), area-averaged wind")
, (b): The 200 -h. Pa temperature (shaded, °C), co-moving streamlines and MSLP (contoured")
 and (c): The 275 -175 h.")
, potential temperature (black), cloud ice mixing ratio")
-(c) The 600 -h. Pa co-moving streamlines (black) and 275")

 DT (0 hour) Gert -6. 27 UMW")
")

- Slides: 16
Roles of Upper-Level Processes in Tropical Cyclogenesis D. -L. Zhang, J. Shin and S. Cecelski Department of Atmospheric & Oceanic Science, University of Maryland
Introduction • Tropical cyclogenesis is treated as a two-stage problem: 1) preconditioning of a meso-α environment; and 2) organization of a meso-β scale. TC vortex (Karyampudi and Pierce 2002). • During Stage I, the low-level disturbance exhibits little intensity changes, but in Stage 2, significant intensification (SI, e. g. , greater than a 0. 5 h. Pa hr-1 drop) occurs. • The physical processes leading to SI are often of our major concern.
Mesoscale processes leading to tropical cyclogenesis: • Vorticity bottom-up (Zhang and Bao 1996; Hendricks et al. 2004; Montgomery et al. 2006); • Vorticity top-down (Ritchie and Holland 1997; Bister and Emanuel 1997); • Wave’s pouch combining the low-level vorticity growth and moistening at the critical latitude (Dunkerton et al. 2009; Montgomery et al. 2010; Wang et al. 2010) ; • Vortical hot tower is a building block of TCs (Hendricks et al. 2004; Montgomery et al. 2006); • Convective bursts play a role in tropical cyclogenesis.
Our recent studies emphasize the roles of upper-level processes in TC intensity changes • Zhang, D. -L. , and H. Chen, 2012: Importance of the upper-level warm core in the rapid intensification of a tropical cyclone. Geophysical Research Letters, 39, L 02806, DOI: 10. 1029/2011 GL 050578. • Zhang, D. -L. , and L. Zhu, 2012: Roles of upper-level processes in tropical cyclogenesis. Geophysical Research Letters, 39, L 17804, DOI: 10. 1029/2012 GL 053140. • Chen, H. , and D. -L. Zhang, 2013: On the rapid intensification of Hurricane Wilma (2005). Part II: Convective bursts and the upper-level warm core. Journal of the Atmospheric Sciences, 70, 146 -162.
a) Time-height cross section of δT=T(z, t) –T 0(z, t 0) (shaded), area-averaged wind barbs and vertical wind shear (10 -3 s-1) from the 96 -h simulation of Typhoon Nari (2001); b) Time series of PMIN (solid), and PMIN estimated by assuming δT = 0 in the layers below 300 h. Pa (dashed). P(h. Pa) 2 1 2 3 1 1 a ( ) 1 1 2 (a) 2 3 MSLP(h. Pa) 1010 1000 UW 990 CTL 980 970 (b) b ( )
MSLP drops (h. Pa, contoured) and temperature changes with respect to the initial conditions, superimposed with 200 -h. Pa co-moving streamlines 6 h prior to SI 6 h after SI
a) Time-height cross section of δT=T(z, t) –T 0(z, t 0) (shaded), area-averaged wind barbs and relative vorticity from the 66 -h simulation of Hurricane Julia (2010) within an AEW; b) Time series of PMIN from the WRF simulation (CTL) and two hydrostatic integrations (NUW and WUW).
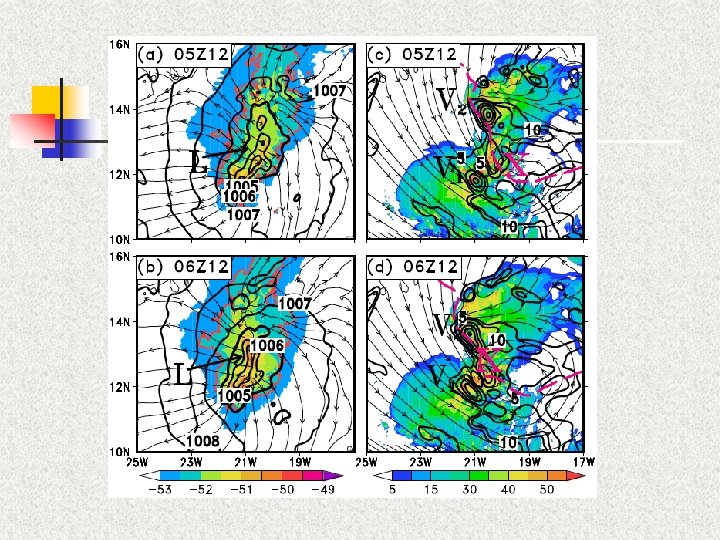
(a), (b): The 200 -h. Pa temperature (shaded, °C), co-moving streamlines and MSLP (contoured at 1 h. Pa) from the 51 -52 h integrations. The -52. 5°C isotherm (bold red) and the 1006 -h. Pa isobar show the expansion of the heating/mesolow. (c), (d): The composite radar reflectivity (shaded), 925 -h. Pa vorticity (contoured), co-moving streamlines. V 1 and V 2 represent the two main mesovortices that become the LLV.
Onset of SI 6 h into SI (a) and (c): The 275 -175 h. Pa layer-averaged vertical velocity (shaded, m s-1) and co-moving wind vectors (m s-1) with MSLP (contoured at intervals of 1 h. Pa) overlaid for 0000 and 0600 UTC 12 September. (b) and (d): The 275 -175 h. Pa layer-averaged cloud ice mixing ratio (shaded, g kg-1) and temperature (contoured at intervals of 0. 5 C) with 925 h. Pa co-moving streamlines overlaid for the same times as in (a) and (c).
Vertical cross sections of vertical velocity (shaded), potential temperature (black), cloud ice mixing ratio (contoured at intervals of 1, 2, 4, 8, 10, 20, 30, 40, 50, 60 and 70 x 10 -2 g kg-1) and freezing level (thick black line) for 0000 (a, A-A* and b, C-C*) and 0600 (c, B-B* and d, D-D*) UTC 12 September.
LR = N H/η (a)-(c) The 600 -h. Pa co-moving streamlines (black) and 275 -175 h. Pa layer-averaged co-moving streamlines (red) with the Rossby radius of deformation (black circle). (d) Time-series of the Rossby radius of deformation (LR) calculated using the area-averaged data between 1000 and 400 h. Pa.
Does the upper-level warming occur in all TCs during genesis? n Examine 55 genesis cases studied by Dunkerton et al (2009). The 55 cases are named storms in the North Atlantic and Northeastern Pacific basin during August - September 1998 – 2001.
Deepening rate Warming type DT (12 hour) DT (0 hour) Gert -6. 27 UMW 185. 302 185. 66 Issac -7. 09 UW 177. 529 177. 586 Isis -3. 62 MW 178. 311 178. 428 John -1. 19 Weak W 184. 349 184. 318
From the 72 -h simulation of Hurricane Wilma (Chen and Zhang 2013)
Future work • Examine the relationship between the vertical warming, vertical motion and vorticity structures of the 55 cases. • Study the environmental conditions, e. g. , inertial stability, larger-scale co-moving flow, in relation to the genesis of the 55 cases. • Perform modeling studies of two HS 3 storms (one mature and one genesis case) with more focus on the upper-level processes in relation to intensity changes.