
Role of cell cycle on the cellular uptake

- Slides: 20
Role of cell cycle on the cellular uptake and dilution of nanoparticles in a cell population Jong Ah Kim, Christoffer Åberg, Anna Salvati, Kenneth A. Dawson Supplementary Discussion This presentation contains a simple scheme of the cell cycle and shows nanoparticle uptake in a single cell, as it progresses through its cell cycle and undergoes cell division. The generation of the ranking (Fig. 1 c) of the intracellular nanoparticle concentration for cells in the different cell cycle phases is also illustrated.
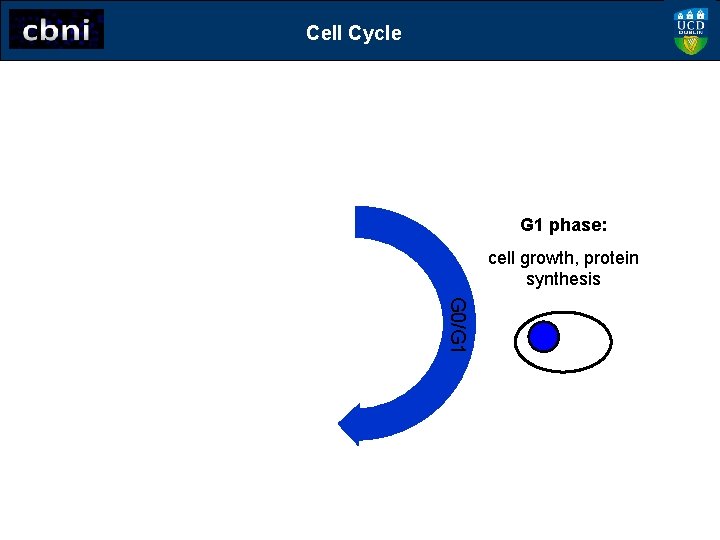
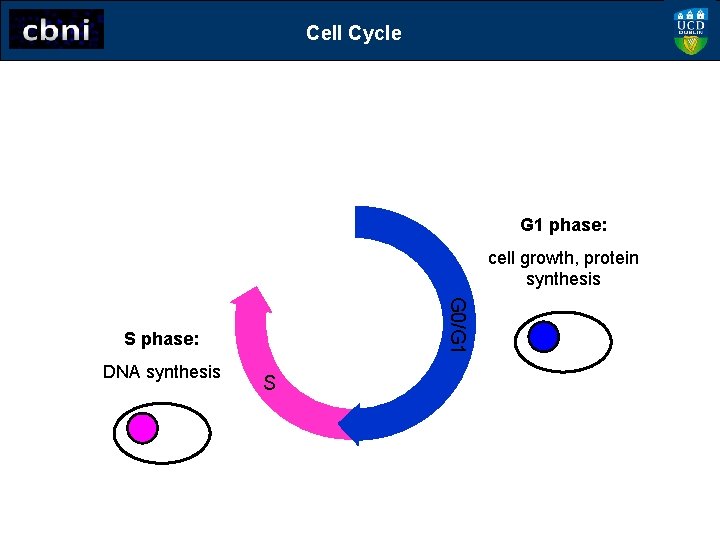
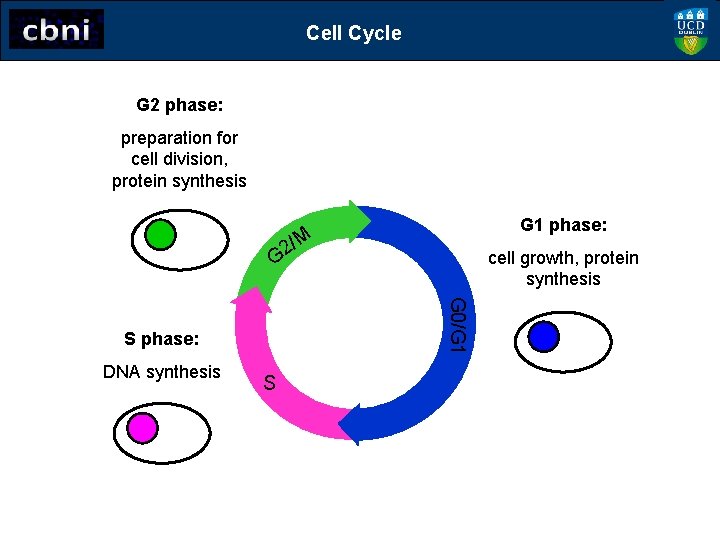
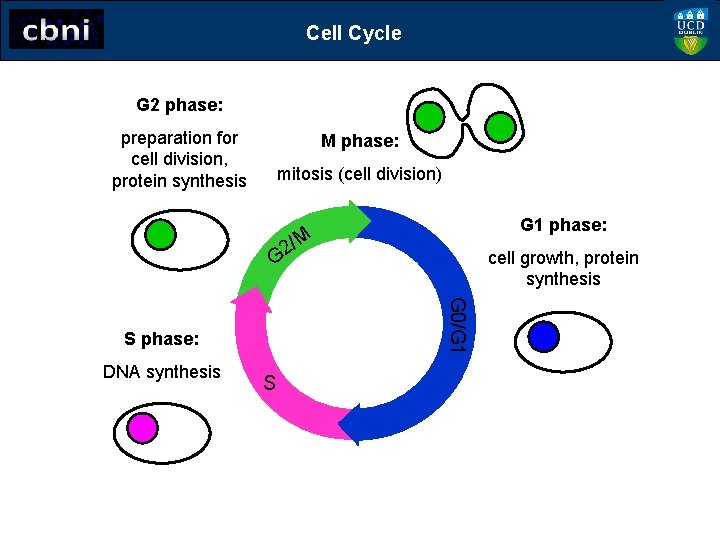
Cell Cycle The cell cycle is a series of events that lead to cell division and replication, consisting of four phases: G 1, S, G 2 and M. The activation of each phase depends on the proper completion of the previous one. The cell cycle commences with the G 1 phase, during which the cell increases its size. During the S phase the cell synthesizes DNA, and in the G 2 phase it synthesizes proteins to prepare for cell division. Finally during the M phase the cell divides and the two daughter cells enter the G 1 phase. Cells that have temporarily stopped dividing can enter a resting phase called G 0.
Cell Cycle G 1 phase: cell growth, protein synthesis G 0/G 1
Cell Cycle G 1 phase: cell growth, protein synthesis G 0/G 1 S phase: DNA synthesis S
Cell Cycle G 2 phase: preparation for cell division, protein synthesis G 1 phase: /M 2 G G 0/G 1 S phase: DNA synthesis cell growth, protein synthesis S
Cell Cycle G 2 phase: preparation for cell division, protein synthesis M phase: mitosis (cell division) G 1 phase: /M 2 G G 0/G 1 S phase: DNA synthesis cell growth, protein synthesis S
Cell Cycle G 2 phase: preparation for cell division, protein synthesis M phase: mitosis (cell division) /M 2 G G 0/G 1 S phase: DNA synthesis S Two new daughter cells in G 1 phase
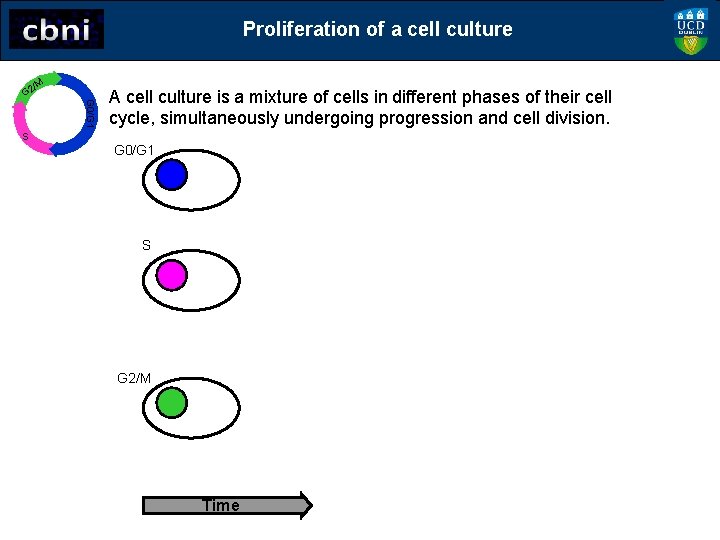
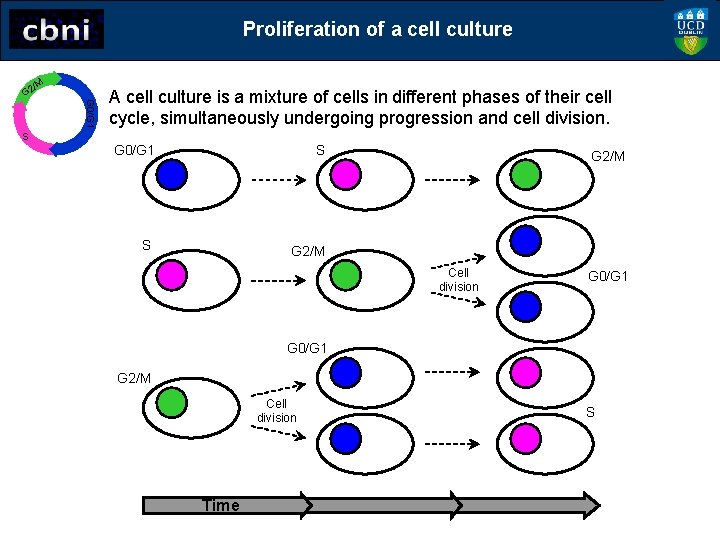
Proliferation of a cell culture G 0/G 1 /M G 2 A cell culture is a mixture of cells in different phases of their cell cycle, simultaneously undergoing progression and cell division. S G 0/G 1 S G 2/M Time
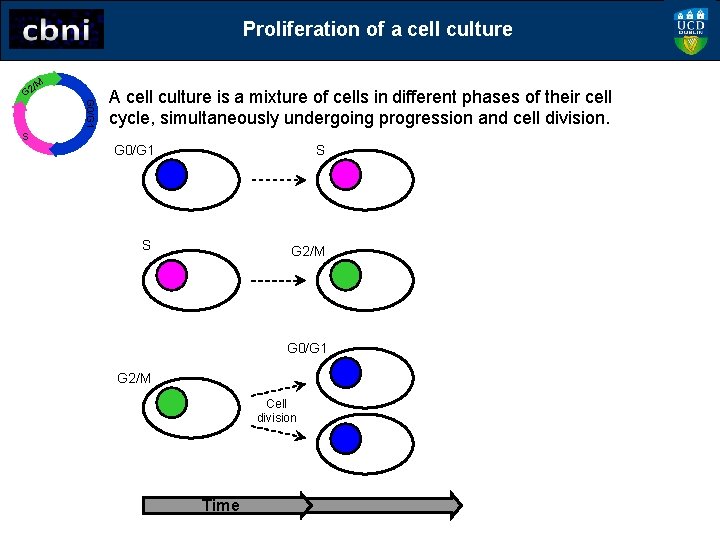
Proliferation of a cell culture G 0/G 1 /M G 2 A cell culture is a mixture of cells in different phases of their cell cycle, simultaneously undergoing progression and cell division. S G 0/G 1 S S G 2/M G 0/G 1 G 2/M Cell division Time
Proliferation of a cell culture G 0/G 1 /M G 2 A cell culture is a mixture of cells in different phases of their cell cycle, simultaneously undergoing progression and cell division. S G 0/G 1 S S G 2/M Cell division G 0/G 1 G 2/M Cell division Time S
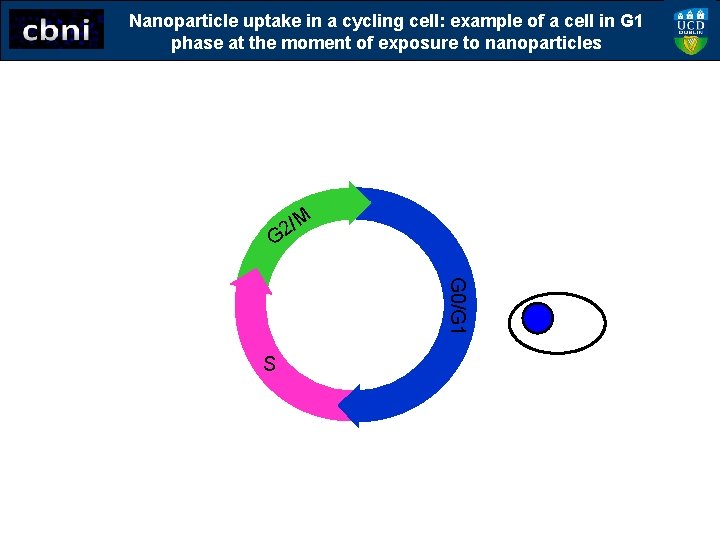
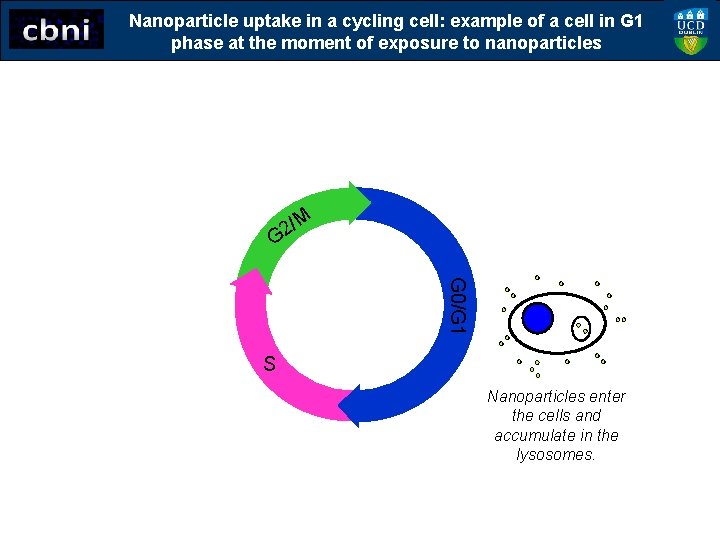
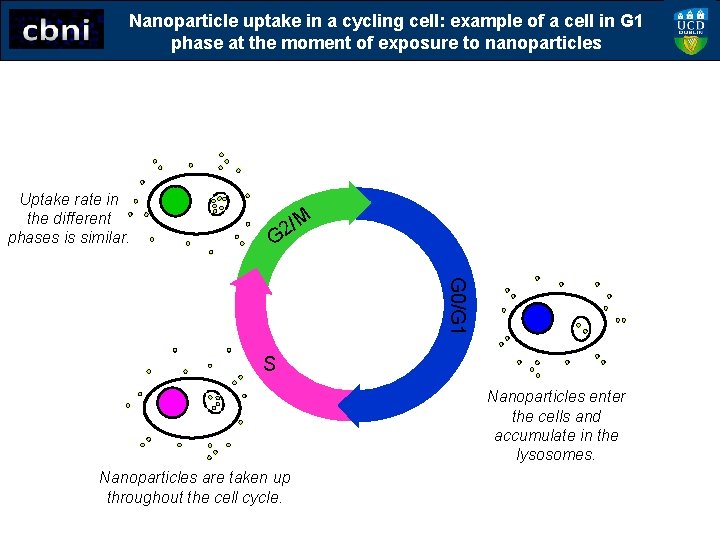
Nanoparticle uptake in a cycling cell: example of a cell in G 1 phase at the moment of exposure to nanoparticles /M 2 G G 0/G 1 S
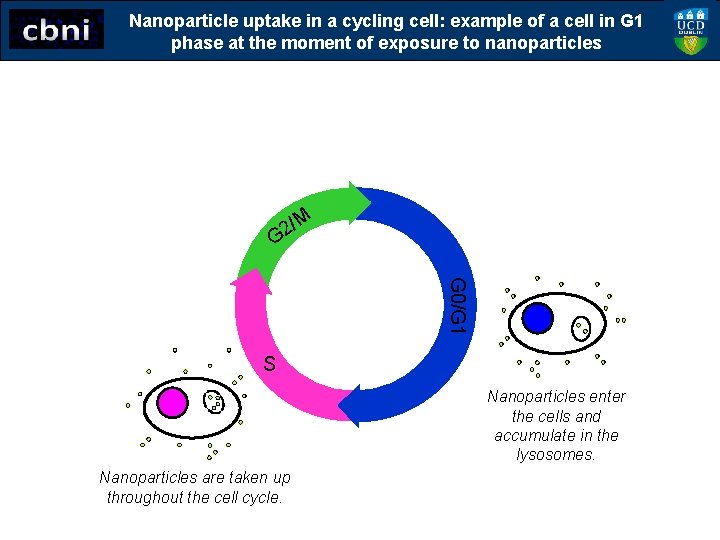
Nanoparticle uptake in a cycling cell: example of a cell in G 1 phase at the moment of exposure to nanoparticles /M 2 G G 0/G 1 S Nanoparticles enter the cells and accumulate in the lysosomes.
Nanoparticle uptake in a cycling cell: example of a cell in G 1 phase at the moment of exposure to nanoparticles /M 2 G G 0/G 1 S Nanoparticles enter the cells and accumulate in the lysosomes. Nanoparticles are taken up throughout the cell cycle.
Nanoparticle uptake in a cycling cell: example of a cell in G 1 phase at the moment of exposure to nanoparticles Uptake rate in the different phases is similar. /M 2 G G 0/G 1 S Nanoparticles enter the cells and accumulate in the lysosomes. Nanoparticles are taken up throughout the cell cycle.
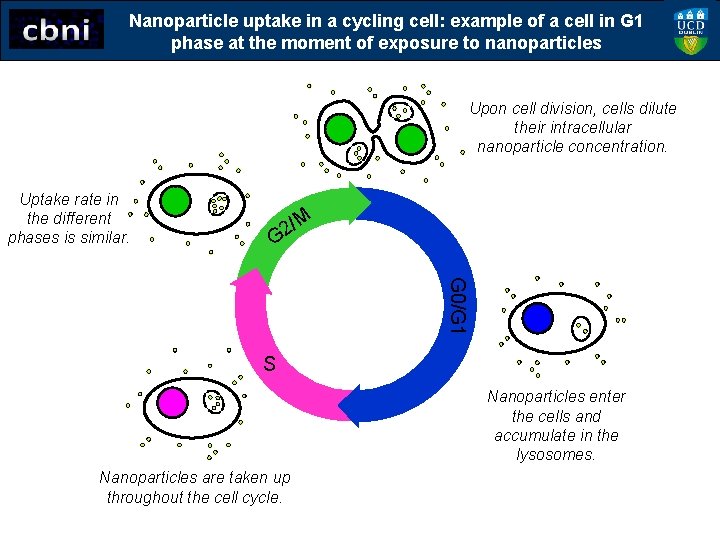
Nanoparticle uptake in a cycling cell: example of a cell in G 1 phase at the moment of exposure to nanoparticles Upon cell division, cells dilute their intracellular nanoparticle concentration. Uptake rate in the different phases is similar. /M 2 G G 0/G 1 S Nanoparticles enter the cells and accumulate in the lysosomes. Nanoparticles are taken up throughout the cell cycle.
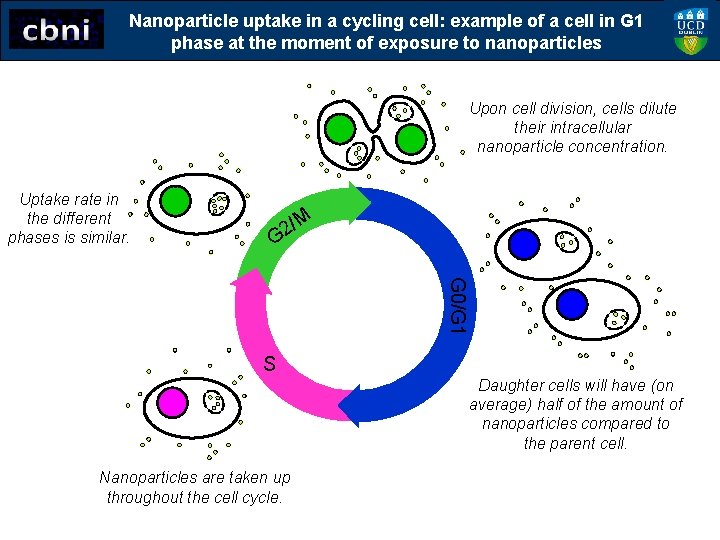
Nanoparticle uptake in a cycling cell: example of a cell in G 1 phase at the moment of exposure to nanoparticles Upon cell division, cells dilute their intracellular nanoparticle concentration. Uptake rate in the different phases is similar. /M 2 G G 0/G 1 S Daughter cells will have (on average) half of the amount of nanoparticles compared to the parent cell. Nanoparticles are taken up throughout the cell cycle.
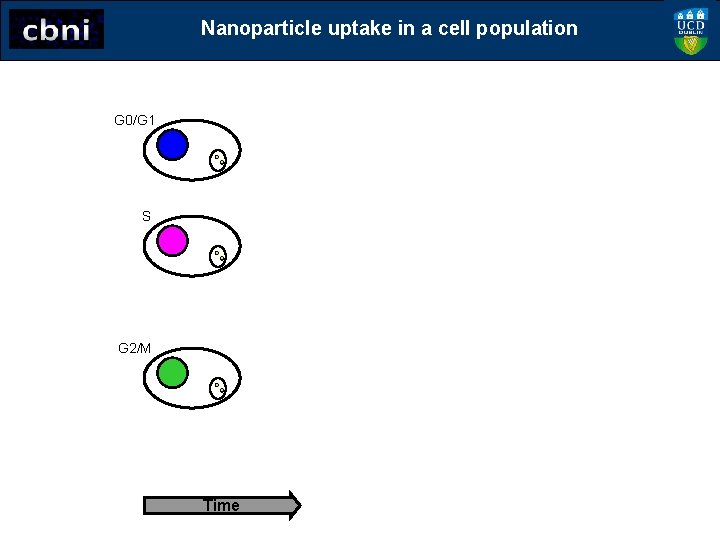
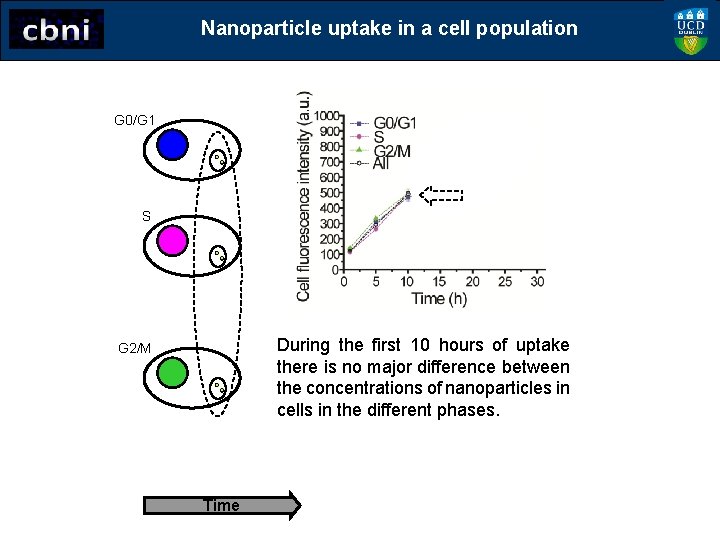
Nanoparticle uptake in a cell population G 0/G 1 S G 2/M Time
Nanoparticle uptake in a cell population G 0/G 1 S During the first 10 hours of uptake there is no major difference between the concentrations of nanoparticles in cells in the different phases. G 2/M Time
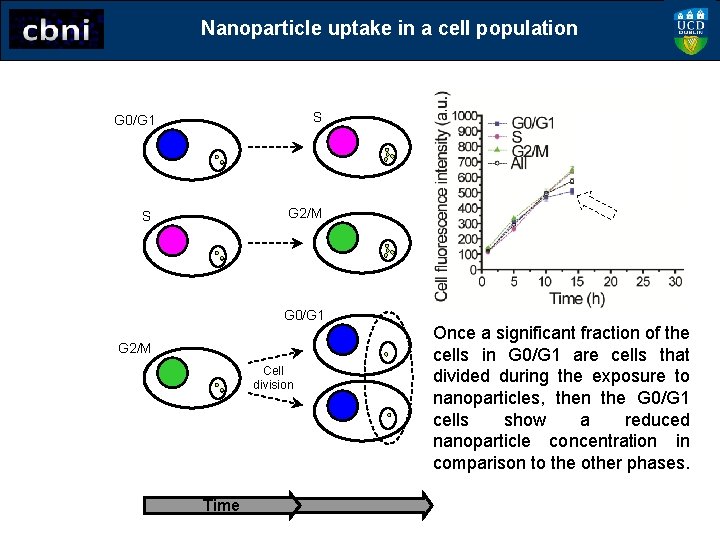
Nanoparticle uptake in a cell population G 0/G 1 S S G 2/M G 0/G 1 G 2/M Cell division Time Once a significant fraction of the cells in G 0/G 1 are cells that divided during the exposure to nanoparticles, then the G 0/G 1 cells show a reduced nanoparticle concentration in comparison to the other phases.
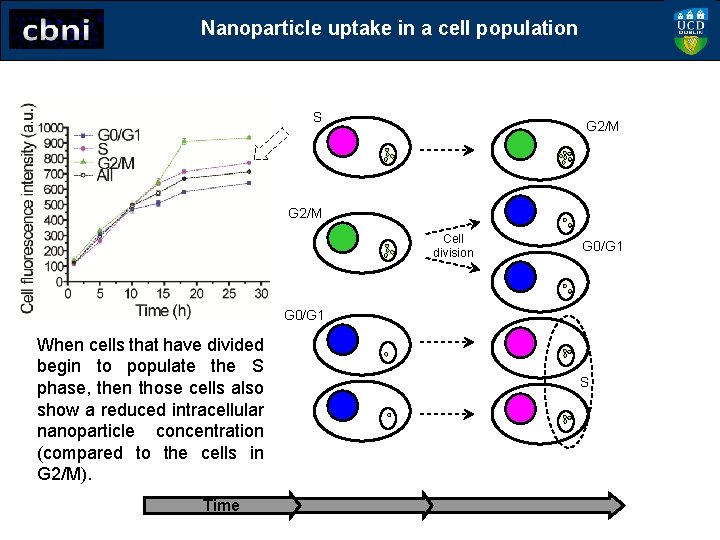
Nanoparticle uptake in a cell population S G 2/M Cell division G 0/G 1 When cells that have divided begin to populate the S phase, then those cells also show a reduced intracellular nanoparticle concentration (compared to the cells in G 2/M). Time S