Roc curves By Vittoria Cozza matr 87680 ROC

Roc curves By Vittoria Cozza, matr. 87680

ROC: Receiver Operating Characteristic curve ROC analysis is part of a field called "Signal Dectection Theory" developed during World War II for the analysis of radar images. Radar operators had to decide whether a blip on the screen represented an enemy target, a friendly ship, or just noise. Signal detection theory measures the ability of radar receiver operators to make these important distinctions. Their ability to do so was called the Receiver Operating Characteristics. It was not until the 1970's that signal detection theory was recognized as useful for interpreting medical test results. ROC graphs in recent years have been increasingly adopted in the machine learning and data mining research communities

Two classes classification problem Each instance I is mapped to one element of the set {p, n} of positive and negative class labels. A classication model (or classier ) is a mapping from instances to predicted classes. Given a classier and an instance, there are four possible outcomes, showed in the confusion matrix: Several common performance metrics that can be calculated from it

Two classes classification problem The True Positive rate (also called hit rate and recall ) of a classier is estimated as: The False Positive rate (also called false alarm rate) of the classier is: Additional terms associated with ROC curves are:

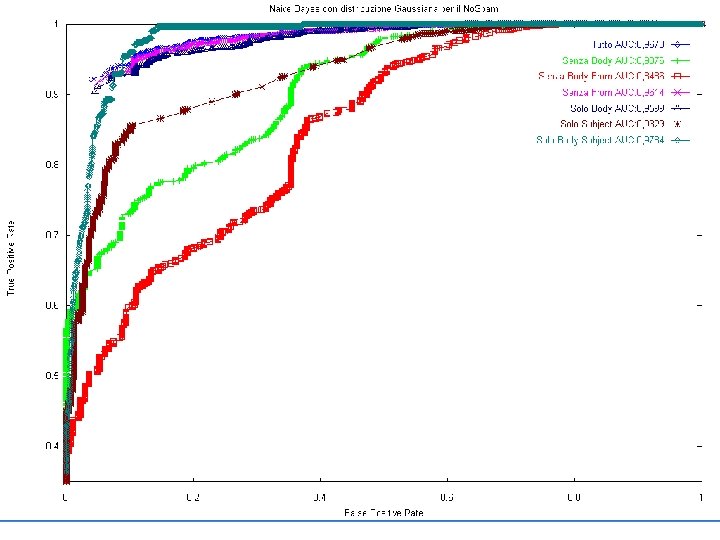
Roc curves in classifier evaluation, a closer look at Roc space ROC graphs are two-dimensional graphs in which TP rate is plotted on the Y axis and FP rate is plotted on the X axis. An ROC graph depicts relative trade-os between benefits (true positives) and costs (false positives).

Roc graphs and discrete classifiers Discrete classiers, such as decision trees or rule sets, are designed to produce only a class decision, i. e. , a Y or N on each instance, When such a discrete classier is applied to a test set, it yields a single confusion matrix, then only a single point in Roc space

Roc graphs and probabilistic classifiers Some classiers, such as a Naive Bayes classier or a neural network, naturally yield an instance probability or score, a numeric value that represents the degree to which an instance is a member of a class. Such a ranking or scoring classier can be used with a threshold to produce a discrete (binary) classier: if the classier output is above threshold, the classier produces a Y, else a N. Each threshold value produces a different point in ROC space. Conceptually, we may imagine varying a threshold from to and tracing a curve through ROC space

Roc graphs and probabilistic classifiers

Algorithm for calculating an Roc curve, v 1

Algorithm for calculating an Roc curve, v 2

What if the scores are not properly calibrated… The ROC curve shows the ability of the classier to rank the positive instances relative to the negative instances, and it is indeed perfect in this ability.

Class skew ROC curves have an attractive property: they are insensitive to changes in class distribution.

The Area Under the Curve The AUC of a classier is equivalent to the probability that the classier will rank a randomly chosen positive instance higher than a randomly chosen negative instance.
 is the likehood")
How to compute a Roc curve with Uniform distribution underlying Li(x) is the likehood for a class, it’s the probability of the forecast x, given that the observation is from the ith class The hit rate and the false alarm rate can be computed from the likelihoods: Where t is the decision threshold

How to compute a Roc curve with Uniform distribution underlying Look at http: //www. anaesthetist. c om/mnm/stats/roc/#skip

The ROC Convex Hull One advantage of ROC graphs is that they enable visualizing and organizing classier performance without regard to class distributions or error costs. A researcher can graph the performance of a set of classiers, and that graph will remain invariant with respect to the operating conditions (class skew and error costs) This equation denotes the slope of an iso-performance line. All classiers corresponding to points on a line of slope m have the same expected cost.

Determine ROC Operating Point ROC operating point is sensitive to class distribution, misclassification costs. Represent slope of ROC curve using adjacent points to form the isoperformance line.

The ROC Convex Hull Adding isoperformance • Classifiers on the convex hull achieve the best accuracy for some class distributions • Classifiers below the convex hull are always sub-optimal lines:

Selecting Classifiers Using ROC Method The isoperformance line, which is tangent to the ROCCH at the point of minimum expected cost, indicates which classifier to use for a specified combination of class distribution and misclassification costs Furthermore, the ROCCH method indicates the range of slopes over which a particular classifier is optimal with respect to class and costs The ROCCH methodology for selecting binary classifiers explicitly includes class distribution and misclassification costs in its formulation. It is a robust alternative to whole-curve metrics like AUC, which reports global classifier performance but which may not indicate the best classifier (in the least-cost sense) for the range of operating conditions under which the classifier will assign class memberships.

Multi-class ROC graphs One method for handling n classes is to produce n different ROC graphs, one for each class. This is called the class reference formulation. Specically, if C is the set of all classes, ROC graph i plots the classication performance using class ci as the positive class and all other classes as the negative class, i. e. , One approach to calculating multi-class AUCs was taken by Provost and Domingos (2001) in their work on probability estimation trees. They calculated AUCs for multi-class problems by generating each class reference ROC curve in turn, measuring the area under the curve, then summing the AUCs weighted by the reference class's prevalence in the data. More precisely, they define:
- Slides: 21