
ROC analysis Background Differentially expressed genes can be
ROC analysis
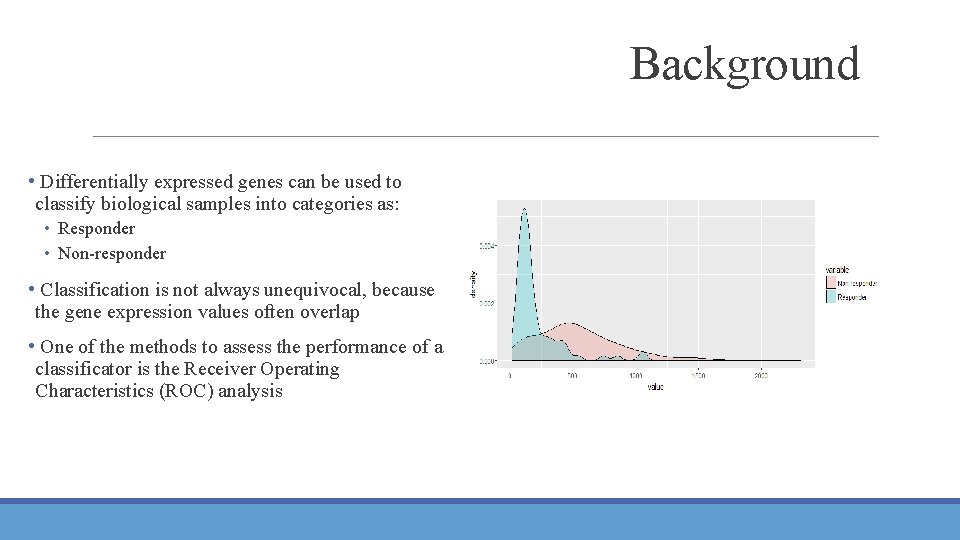
Background • Differentially expressed genes can be used to classify biological samples into categories as: • Responder • Non-responder • Classification is not always unequivocal, because the gene expression values often overlap • One of the methods to assess the performance of a classificator is the Receiver Operating Characteristics (ROC) analysis
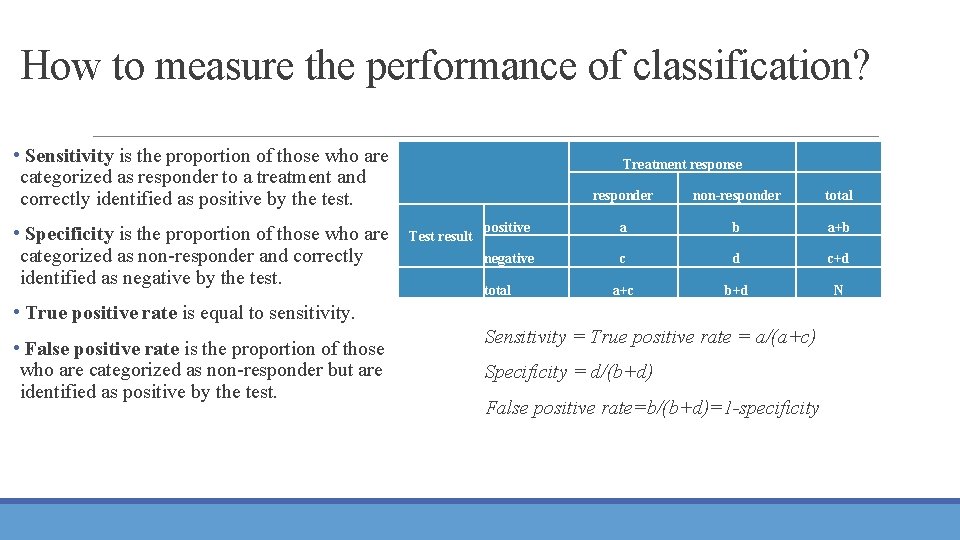
How to measure the performance of classification? • Sensitivity is the proportion of those who are categorized as responder to a treatment and correctly identified as positive by the test. • Specificity is the proportion of those who are categorized as non-responder and correctly identified as negative by the test. Treatment response Test result responder non-responder total positive a b a+b negative c d c+d a+c b+d N total • True positive rate is equal to sensitivity. • False positive rate is the proportion of those who are categorized as non-responder but are identified as positive by the test. Sensitivity = True positive rate = a/(a+c) Specificity = d/(b+d) False positive rate=b/(b+d)=1 -specificity
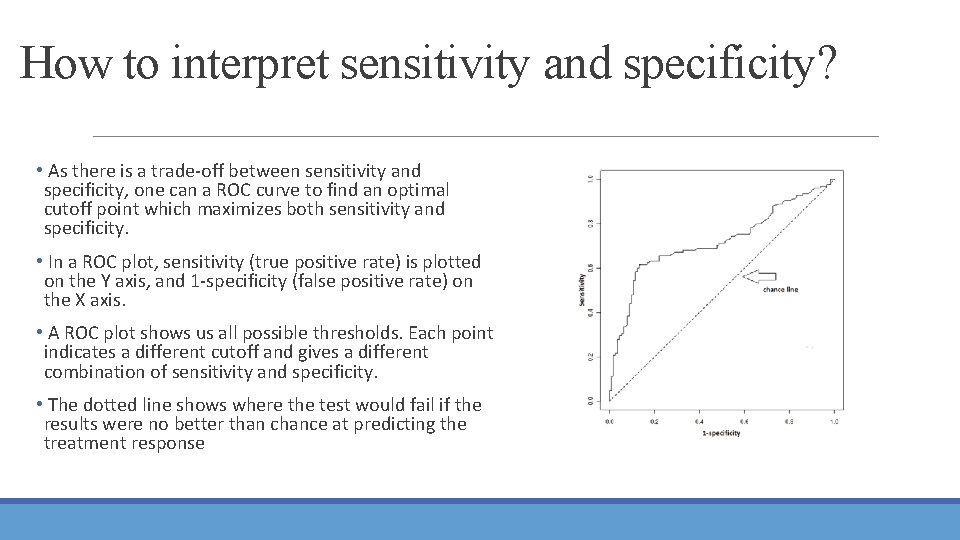
How to interpret sensitivity and specificity? • As there is a trade-off between sensitivity and specificity, one can a ROC curve to find an optimal cutoff point which maximizes both sensitivity and specificity. • In a ROC plot, sensitivity (true positive rate) is plotted on the Y axis, and 1 -specificity (false positive rate) on the X axis. • A ROC plot shows us all possible thresholds. Each point indicates a different cutoff and gives a different combination of sensitivity and specificity. • The dotted line shows where the test would fail if the results were no better than chance at predicting the treatment response
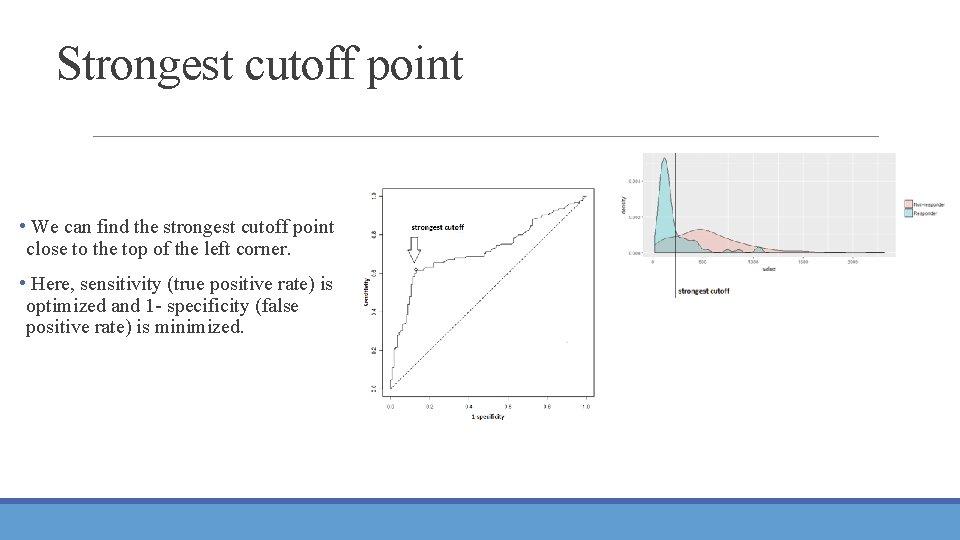
Strongest cutoff point • We can find the strongest cutoff point close to the top of the left corner. • Here, sensitivity (true positive rate) is optimized and 1 - specificity (false positive rate) is minimized.
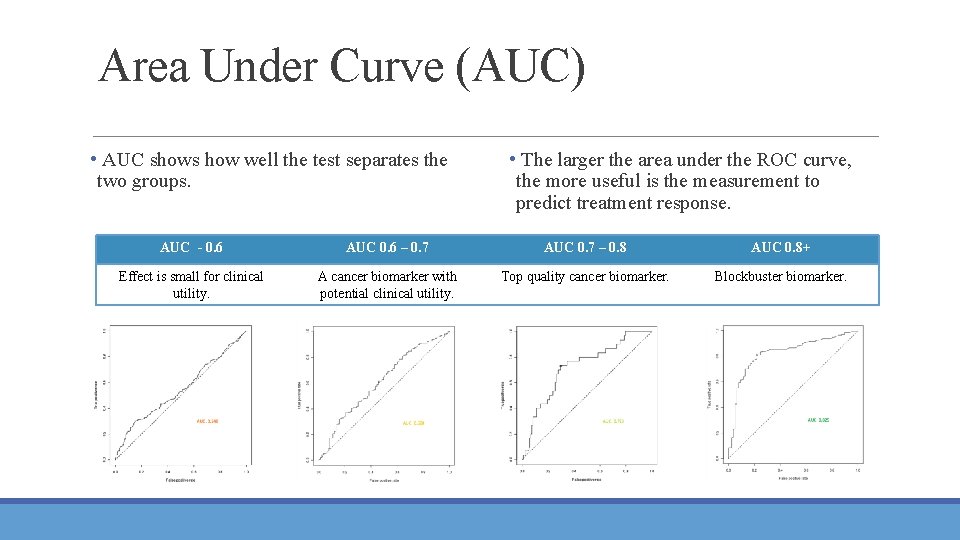
Area Under Curve (AUC) • AUC shows how well the test separates the two groups. • The larger the area under the ROC curve, the more useful is the measurement to predict treatment response. AUC - 0. 6 AUC 0. 6 – 0. 7 AUC 0. 7 – 0. 8 AUC 0. 8+ Effect is small for clinical utility. A cancer biomarker with potential clinical utility. Top quality cancer biomarker. Blockbuster biomarker.
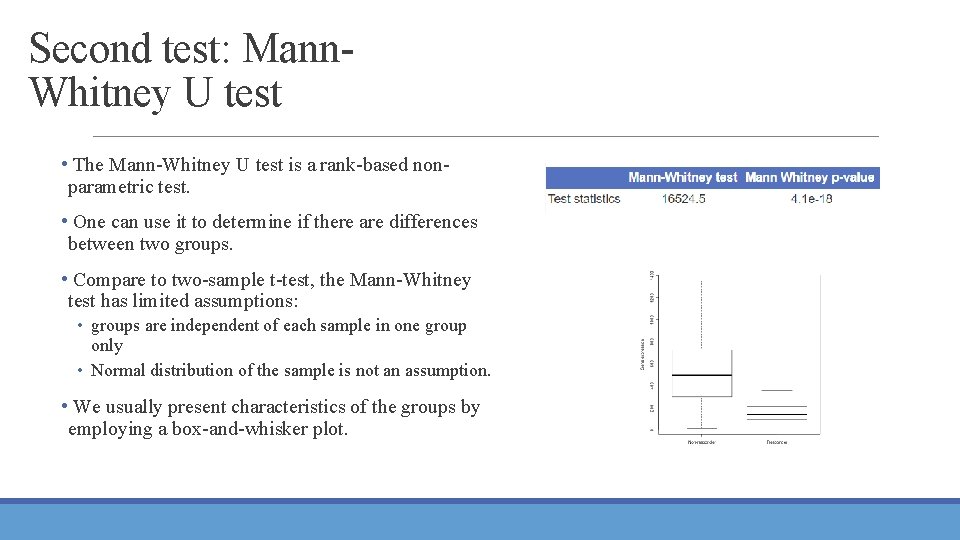
Second test: Mann. Whitney U test • The Mann-Whitney U test is a rank-based nonparametric test. • One can use it to determine if there are differences between two groups. • Compare to two-sample t-test, the Mann-Whitney test has limited assumptions: • groups are independent of each sample in one group only • Normal distribution of the sample is not an assumption. • We usually present characteristics of the groups by employing a box-and-whisker plot.
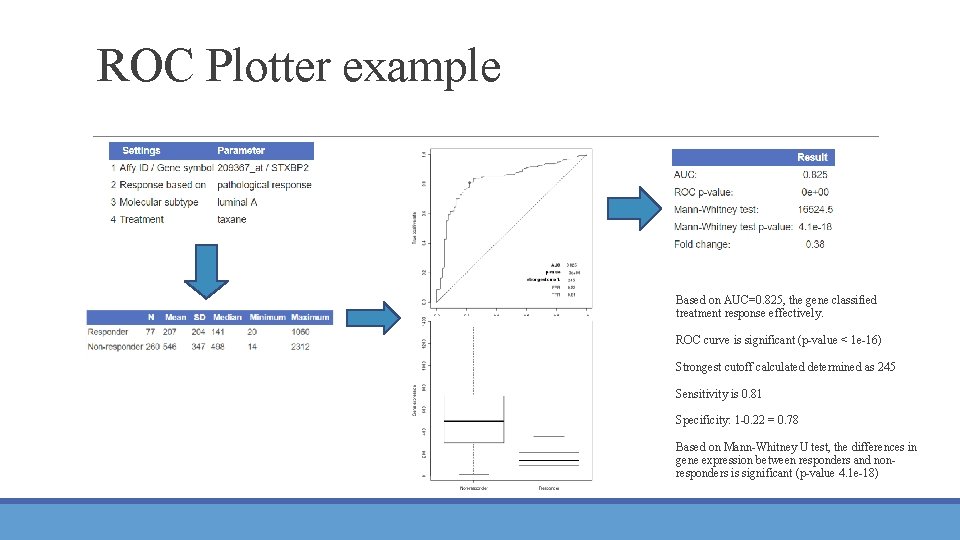
ROC Plotter example Based on AUC=0. 825, the gene classified treatment response effectively. ROC curve is significant (p-value < 1 e-16) Strongest cutoff calculated determined as 245 Sensitivity is 0. 81 Specificity: 1 -0. 22 = 0. 78 Based on Mann-Whitney U test, the differences in gene expression between responders and nonresponders is significant (p-value 4. 1 e-18)
- Slides: 8