Road Pavements are Supported Bridges Most Road Pavements

Road Pavements are “Supported” Bridges

Most Road Pavements failures are contribute to when the “Support” has been jeopardized n Enemies of Roads: n n Water penetration Traffic Loading n n n – Freeze / thaw/ expansions / voids High Traffic Use (verses low traffic counts) Truck Loads – one loaded truck may cause the same amount of damage of 5, 000 cars Weathering / Seasonal Climate / Age n Breakdown of aggregate and asphalt oils n n May allow water penetration Need Aggregate surface for traction

n Enemies of Roads: n Artificial Damage n n n n continued Stud Tires Utility Cuts Traffic Accidents – liquids spilled Farm equipment dragging Stopping areas = pavement thrusting Bus Stops Others items that shorten the life of roads n n Poor drainage Poor or non-maintained shoulders Tree roots Inadequate Road Base, Design, Road Materials, Construction practices/ Workmanship, Lack of Good Maintenance, or Neglect

Typical Distresses n n n Alligator cracking Block cracking Longitudinal & transverse cracking Delamination Rutting Potholes

Cracking Alligator

Cracking
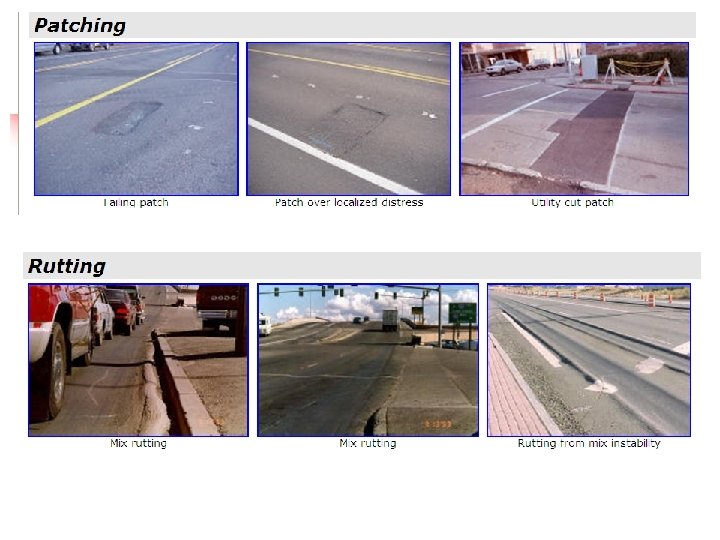

Localized Failures

Surface Treatments & Costs n n n n Crack Seal: $4 k/mile (3 -6 years) {costs greatly vary} Slurry Seal: $8 k/mile (4 -6 years) {urban street treatments} Chip with Fog Seal with prep: $34 k/mile (7 -12 years) 2” Maintenance AC Overlay: $120 k/mile (10 -20 years) Grind & 2” AC Inlay: $150 k/mile (12 -20 years) 4” Structural AC Overlay: $190/mile (14 -20 years) Reconstruction: $500 k/mile (20 -24 years)

Pavement Management Systems n Inventory of road pavements - Section Descriptions Provides Maintenance & Rehab (M&R) history Produce a list of upcoming M&R work Demonstrates current health & performance of roads Predicts roads’ projected performance and costs Estimate a required project and system wide budget Planning/ Maintenance/ Design Construction n Aids in defining what work should be done when n n n

How n n n PMS Software/ System Works Segment roads into management units Visual survey of pavements every 1 -4 years Sample ~10% of roadway surface in each segment Enter data on various distresses Using Pavement Condition Index (PCI) of 100 is new/ perfect road to 0 = Failed road, calculate the PCI values n Output = recommended treatments within assigned budgets and many other reports

PCI 100 90 80 70 60 50 40 30 20 Pavement Condition Rating with Typical Repairs Repair Cost/Yard Excellent Seal Cracks Very Good Single Chip Seal $1. 50 Overlay $8 $. 80 Good Fair Poor Very Poor Thick Overlay $13 $30 plus 10 0 Reconstruct Failed 5 yrs 10 yrs 15 yrs 20 yrs

Pavement Condition Index PCI n n n Corps of Engrs Develop for Airfields ASTM now has standards for both highways and airfields Analyze Distresses n n Type Severity Density Adopted by most agencies 100 Excellent Very Good Fair Poor Very Poor Failed 85 70 55 40 25 10 0

100 0 Pavement Condition Index Pavement Condition PCI = 88 Time / Traffic Loading 10 years 20 years

100 0 Pavement Condition Index Pavement Condition Critical PCI = 65 - 70 Time / Traffic Loading 10 years 20 years

Critical PCI 0 Pavement Condition Index 100 Preventive Maintenance Critical PCI Corrective Maint, Rehabilitation, or Reconstruction Time / Traffic Loading 10 years 20 years

100 0 Pavement Condition Index Ideal PCI Ideal Management Range of PCI of 80 to 85 is accepted by agencies’ pavement managers as the range or “Industry Standard” to be the most cost-effective of maintaining a road network. This should be the network PCI performance target Time / Traffic Loading 10 years 20 years 85 80

Pavement Condition $ Costs Preventive Maintenance $ Time / Traffic Loading 10 years 20 years

Pavement Condition $ Costs Corrective Repairs more $ Corrective Maintenance/ Repair Time / Traffic Loading 10 years 20 years

Pavement Condition Rehabilitation even more $ Time / Traffic Loading 10 years 20 years

Pavement Condition $ Costs Reconstruction most costly $ Time / Traffic Loading 10 years 20 years

Pavement Condition Index 100 Pavement Condition Index PCI 90 80 with Typical Repairs Excellent Very Good 70 60 50 Fair nt Paveme ation Deterior ve Cur Poor Seal Cracks $. 80 Single Chip Seal $1. 50 Thin Overlay $8 Thick Overlay $13 40 30 Cost per Yard Very Poor 20 10 Reconstruct Failed 0 New 7 years 14 years 21 years 28 years $30 plus

Well Maintained Barn Road Condition: Excellent Treatments: Minimal to None Service Cost: Minimal to None Inventory Trend: Severe Decrease

Minor Repairs Road Condition: Very Good Treatments: Seals & Patching Service Cost: $1. 50/ sq yd Inventory Trend: Slight Decrease

Major Repairs Road Condition: Good to Fair Treatments: Overlays Service Cost: $8/ sq yd Inventory Trend: Severe Increase

Time to Rebuild! Road Condition: Poor to Failed Treatments: Generally Reconstructions Service Cost: $30 plus /sq yd Inventory Trend: Increase

An Analogy –Process is continuous and inevitable Seal = $1. 50 / sq yd Overlay = $8 / sq yd Reconstruct = $30 / sq yd –The rate of water flow increases as condition decreases –The effort to pump water increases with decreasing condition –Need a bigger ($) pump!

Maintained vs Non-Maintained County Road Cost per Mile for 2 Lane Road Over 55 years Pavement Condition Index (PCI) Maintained Non-Maintained 100 Excellent 80 Very Good 60 Fair Seal $9 K 40 Seal $9 K Overlay $91 K Seal $9 K = Initial Building Cost $300 K 20 Failed Rebuild $300 K 0 0 5 10 15 20 25 Years The poorer the road, the greater the liability. Rebuild $300 K 30 35 40 45 50 = 55 Maintained Total = $236 K Life Avg. PCI = 90 Non. Maintained Total = $600 K Life Avg. PCI = 76

Maintained vs Non-Maintained County Road Average PCI Experienced Over 55 years Pavement Condition Index (PCI) Maintained Non-Maintained 100 Overlay Maintained Life Avg. PCI = 90 90 80 Rebuild 70 Non. Maintained Life Avg. PCI = 76 Rebuild 60 50 0 5 10 15 20 25 Years 30 35 40 45 50 55
 Average PCI Experienced per Dollar")
Maintained vs Non-Maintained County Road Buying Power Ratio* (BPR) Average PCI Experienced per Dollar Spent Over 55 years Maintained Non-Maintained 35 30 Overlay 25 Overlay 20 Maintained Life Avg. BPR = 17. 0 15 10 Non. Maintained Life Avg. BPR = 8. 4 Rebuild 5 Comparison Ratio = 2. 02 Initial investment ($300 K) is included in calculations 0 0 5 10 * Buying Power Ratio = Avg. PCI Mile / $100, 000 Invested 15 20 25 Years 30 35 40 45 50 55
 Average PCI Experienced per Dollar")
Maintained vs Non-Maintained County Road Buying Power Ratio* (BPR) Average PCI Experienced per Dollar Spent Over 55 years (Inflated at 3% Annually) Maintained Non-Maintained 35 30 25 20 Overlay 15 Maintained Life Avg. BPR = 10. 3 10 Non. Maintained Life Avg. BPR = 3. 4 Rebuild 5 Rebuild Initial investment ($300 K) is included in calculations 0 0 5 10 * Buying Power Ratio = Avg. PCI Mile / $100, 000 Invested 15 20 25 Years 30 35 40 45 50 55 Comparison Ratio = 3. 03

PCI Points Lost per Year Model for Pavement Life of 30 years Pavement Condition Index (PCI) 100 Excellent Loss of 2 -4 PCI Points per Year 80 Very Good 60 Loss of 8 -12 PCI Points per Year Fair Poor 40 Loss of 1 -6 PCI Points per Year Very Poor 20 Failed 0 0 5 10 15 Years 20 25 30

PCI Points Lost per Year Model for Pavement Life of 30 years Pavement Condition Index (PCI) Financial liabilities increase rapidly as the pavement deteriorates down the waterfall. 100 Excellent 85 Loss of 2 -4 PCI Points per Year Very Good te Wa 70 Good ll rfa 50 Fair 40 Loss of 8 -12 PCI Points per Year Poor 25 Loss of 1 -6 PCI Points per Year Very Poor 10 0 0 Failed 5 10 15 Years 20 25 30

repeat slide Seal = $1. 50 / sq yd Overlay = $8 / sq yd Reconstruct = $30 / sq yd An Analogy –Process is continuous and inevitable –The rate of water flow increases as condition decreases –The effort to pump water increases with decreasing condition –Need a bigger ($) pump!
( Percentage % ) Management, Workmanship = PCI, Remove Risks/ Hazards Page")
(Budget - )( Percentage % ) Management, Workmanship = PCI, Remove Risks/ Hazards Page 7 of 7
- Slides: 36