
RNAseq Manpreet S Katari DNA RNA protein phenotype


- Slides: 56
RNA-seq Manpreet S. Katari
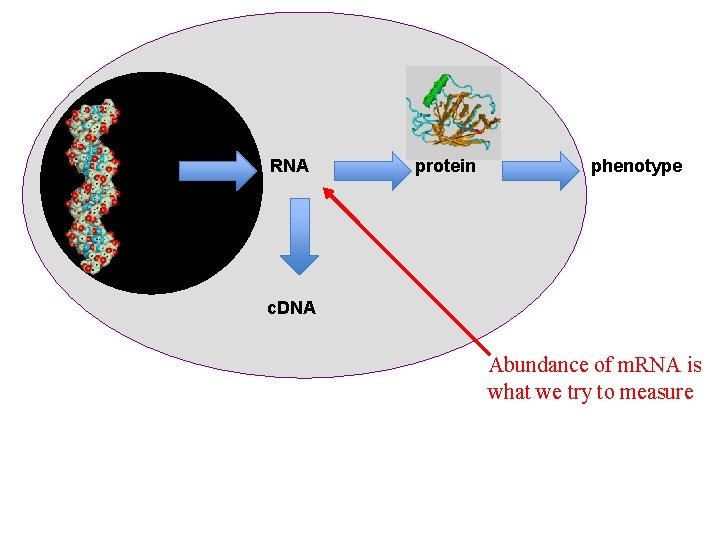
DNA RNA protein phenotype c. DNA Abundance of m. RNA is what we try to measure
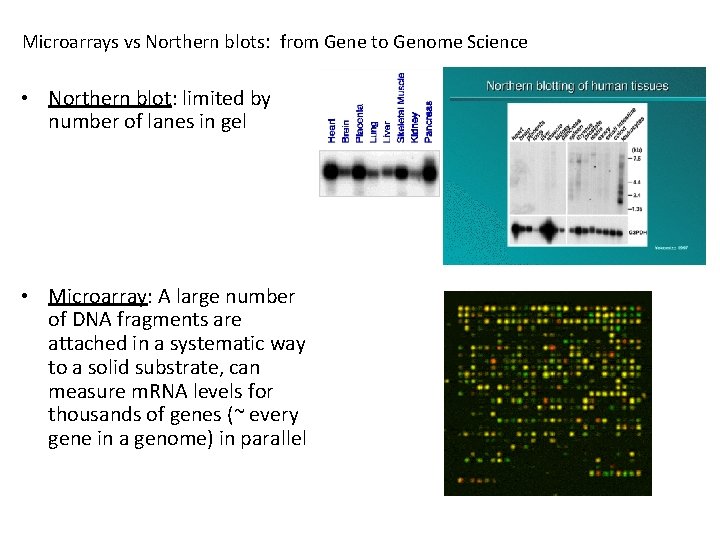
Microarrays vs Northern blots: from Gene to Genome Science • Northern blot: limited by number of lanes in gel • Microarray: A large number of DNA fragments are attached in a systematic way to a solid substrate, can measure m. RNA levels for thousands of genes (~ every gene in a genome) in parallel
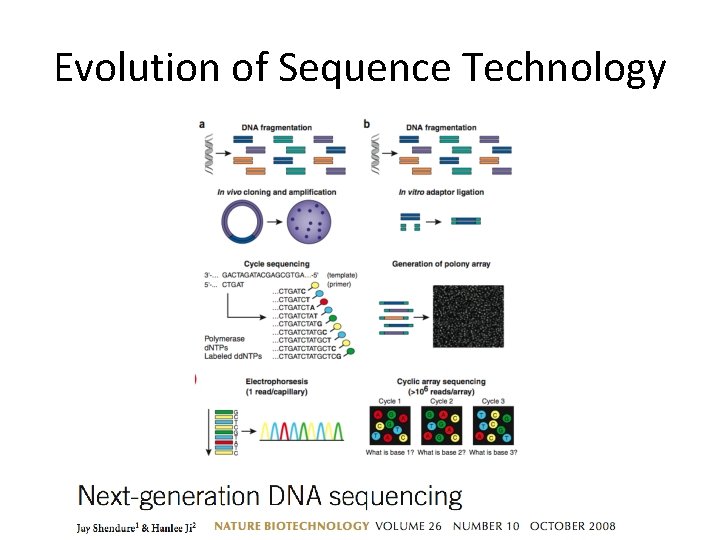
Evolution of Sequence Technology
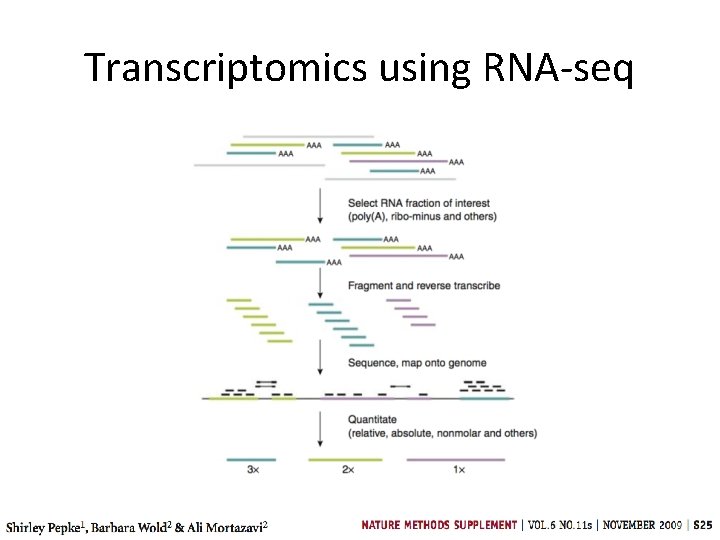
Transcriptomics using RNA-seq
Genome-wide expression analysis • Goal: to measure RNA levels of all genes in a genome under various experimental conditions • RNA levels vary with: – – Cell type Developmental stage External stimuli Disease state • Time and location of expression provide information on genes’ function and interactions, and can be useful for many purposes, including disease diagnostics and medical applications.
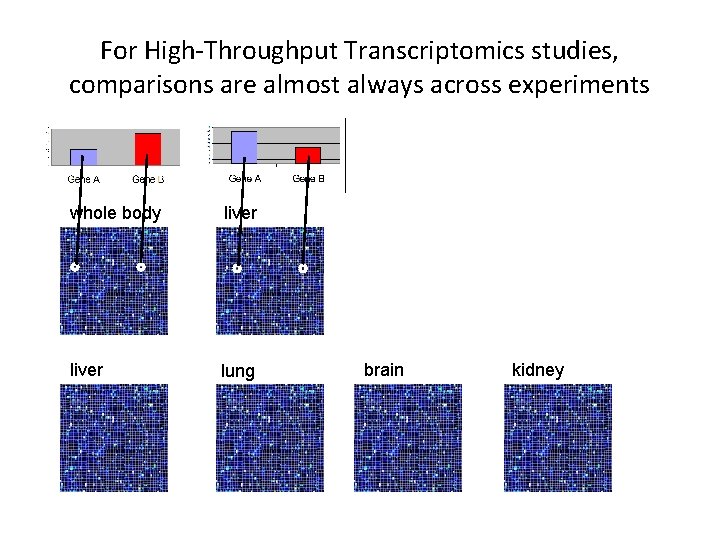
For High-Throughput Transcriptomics studies, comparisons are almost always across experiments whole body liver lung brain kidney
Questions that can be addressed with genome-wide expression analysis: • What genes have similar function? • What regulatory pathways exist? • Can we subdivide experiments or genes into meaningful classes? • Can we correctly classify an unknown experiment or gene into a known class? • Can we make better treatment decisions for a cancer patient based on his or her gene expression profile?
First two basic tasks to generating meaningful data for transcriptomics analysis • Normalize or scale all samples and replicated to each other • Make a (statistical) statement about what changes are evident in the comparison
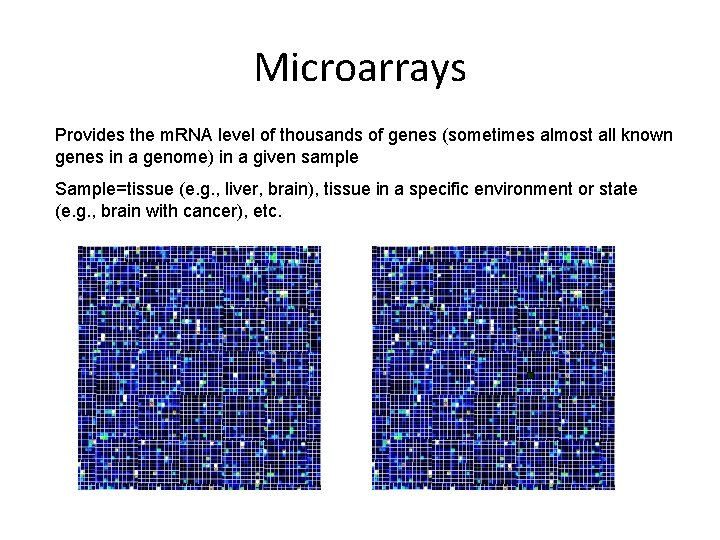
Microarrays Provides the m. RNA level of thousands of genes (sometimes almost all known genes in a genome) in a given sample Sample=tissue (e. g. , liver, brain), tissue in a specific environment or state (e. g. , brain with cancer), etc.
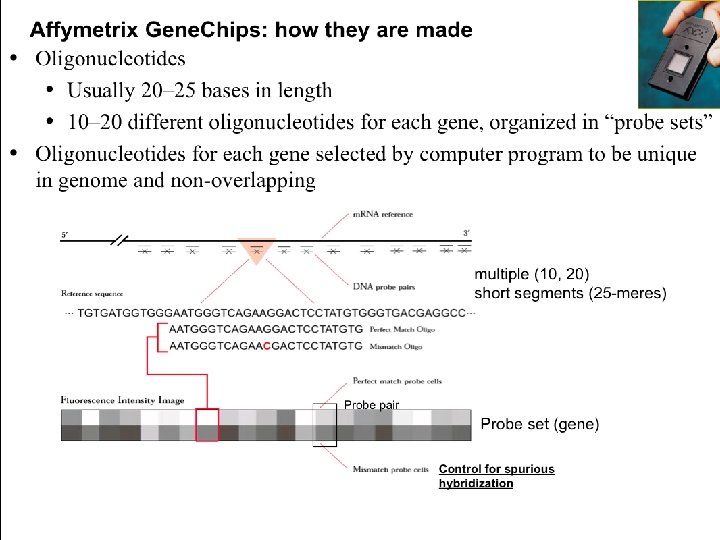
Three types of arrays • Spotted microarrays – Long ds. DNA (typically genomic PCR products) • On-chip oligonucleotide synthesis – Photolithography • Affymetrix (~25 -mers) – Ink-jet printing • Agilent (~60 -mers)
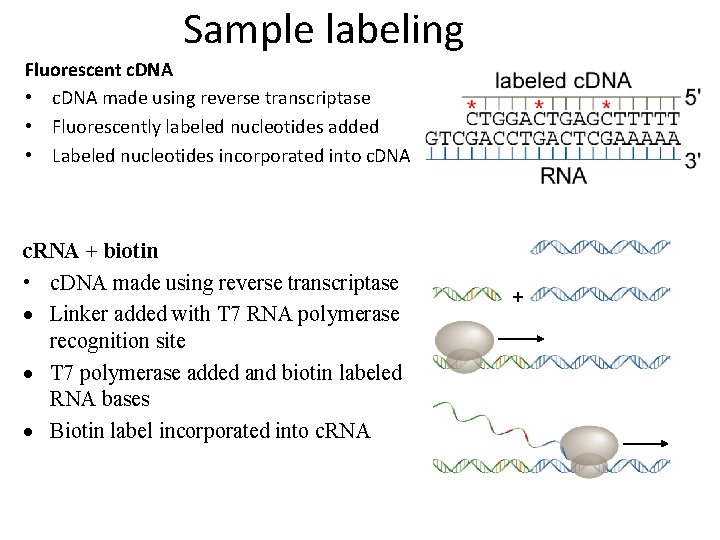
Sample labeling Fluorescent c. DNA • c. DNA made using reverse transcriptase • Fluorescently labeled nucleotides added • Labeled nucleotides incorporated into c. DNA c. RNA + biotin • c. DNA made using reverse transcriptase · Linker added with T 7 RNA polymerase recognition site · T 7 polymerase added and biotin labeled RNA bases · Biotin label incorporated into c. RNA +
Microarray hybridization Spotted microarrays – Competitive hybridization: two labeled c. DNA samples (experimental and control) hybridized to same slide – Cy 3 and Cy 5 dye labeling, fluoresce at different wavelengths Affymetrix Gene. Chips – One labeled RNA population per chip – Biotin labeling, binds to fluorescently labeled avidin (Comparison made between hybridization intensities of same oligonucleotides on different chips). samples m. RNA c. DNA microarray
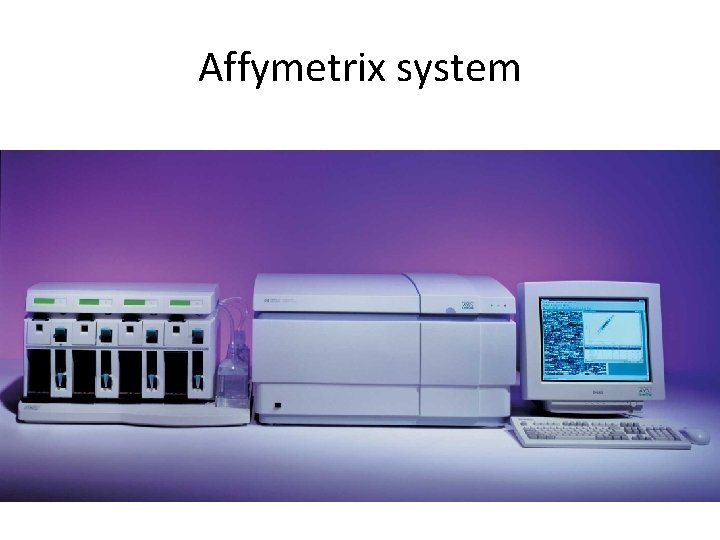
Affymetrix system
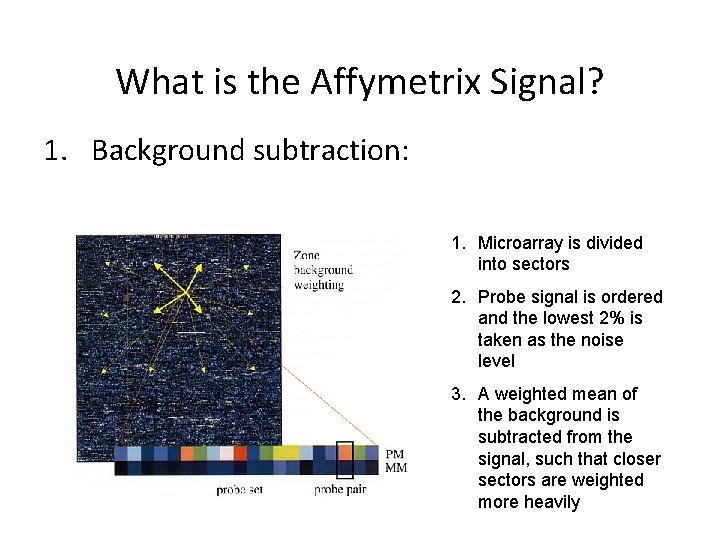
What is the Affymetrix Signal? 1. Background subtraction: 1. Microarray is divided into sectors 2. Probe signal is ordered and the lowest 2% is taken as the noise level 3. A weighted mean of the background is subtracted from the signal, such that closer sectors are weighted more heavily
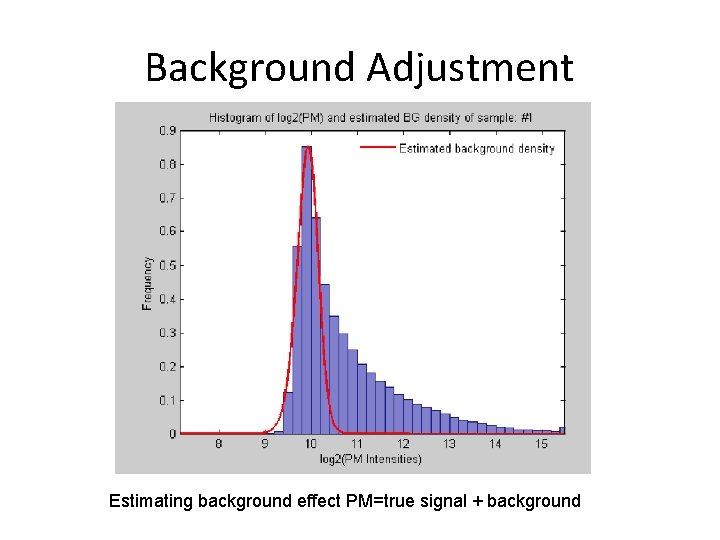
Background Adjustment Estimating background effect PM=true signal + background
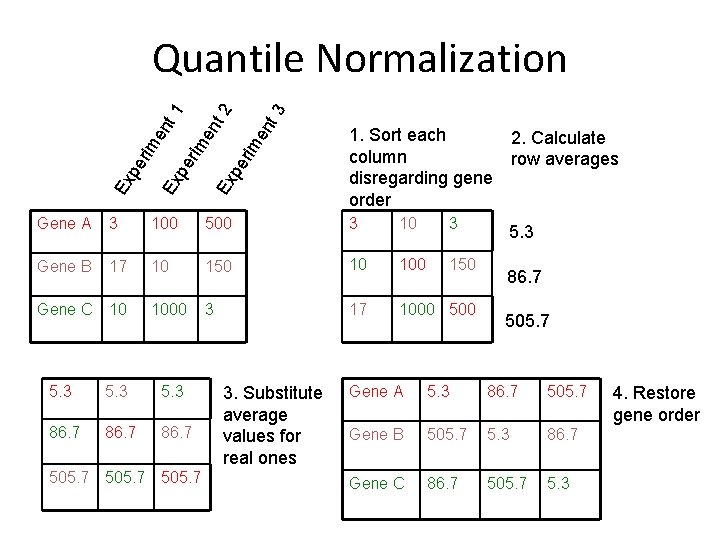
t 3 t 2 en en rim Ex pe pe Ex Ex pe rim en t 1 Quantile Normalization 1. Sort each 2. Calculate column row averages disregarding gene order Gene A 3 100 500 3 10 3 Gene B 17 10 150 10 100 150 Gene C 10 1000 3 17 1000 5. 3 86. 7 505. 7 3. Substitute average values for real ones 5. 3 86. 7 505. 7 Gene A 5. 3 86. 7 505. 7 Gene B 505. 7 5. 3 86. 7 Gene C 86. 7 505. 7 5. 3 4. Restore gene order
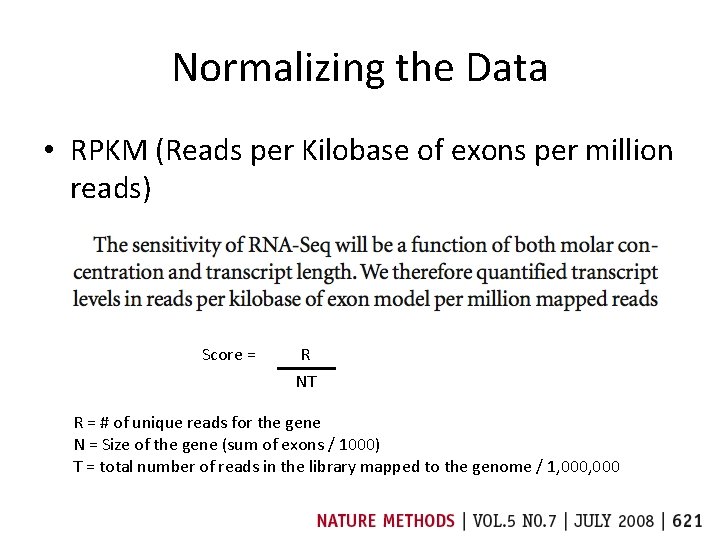
Normalizing the Data • RPKM (Reads per Kilobase of exons per million reads) Score = R NT R = # of unique reads for the gene N = Size of the gene (sum of exons / 1000) T = total number of reads in the library mapped to the genome / 1, 000
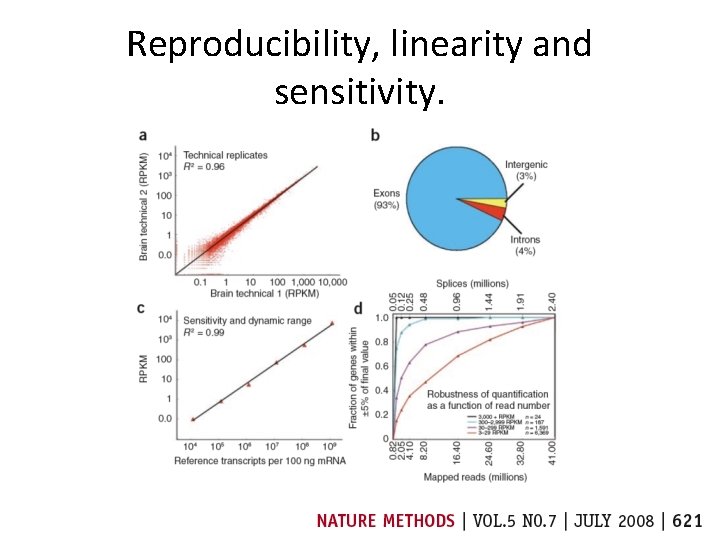
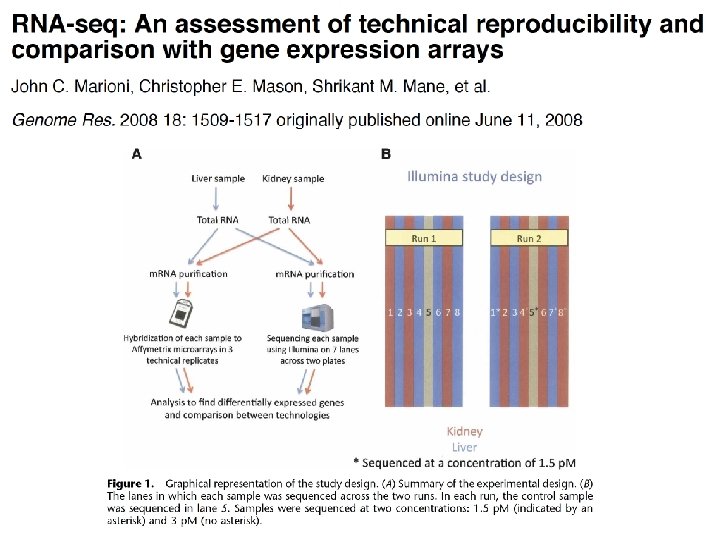
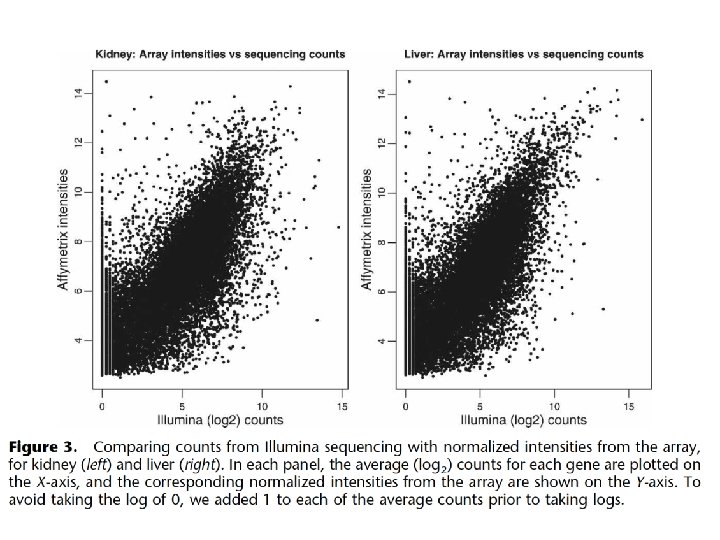
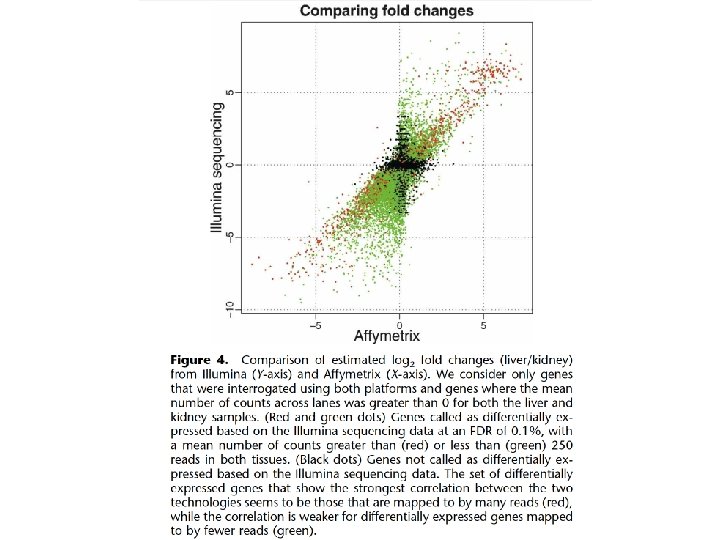
Reproducibility, linearity and sensitivity.
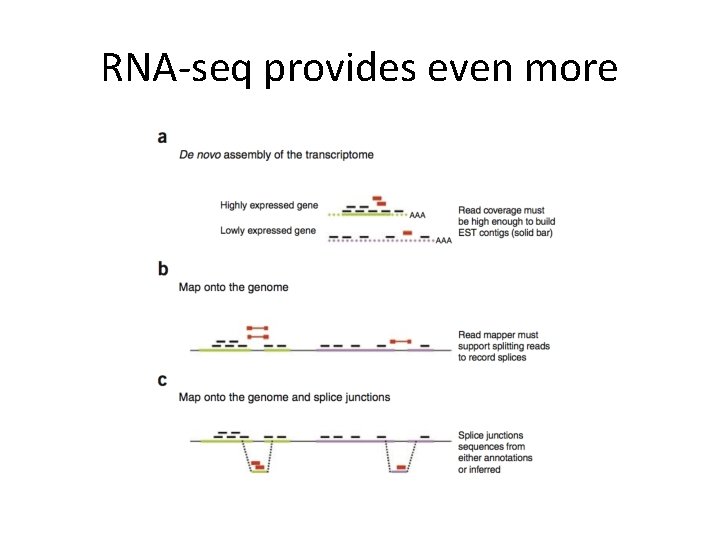
RNA-seq provides even more
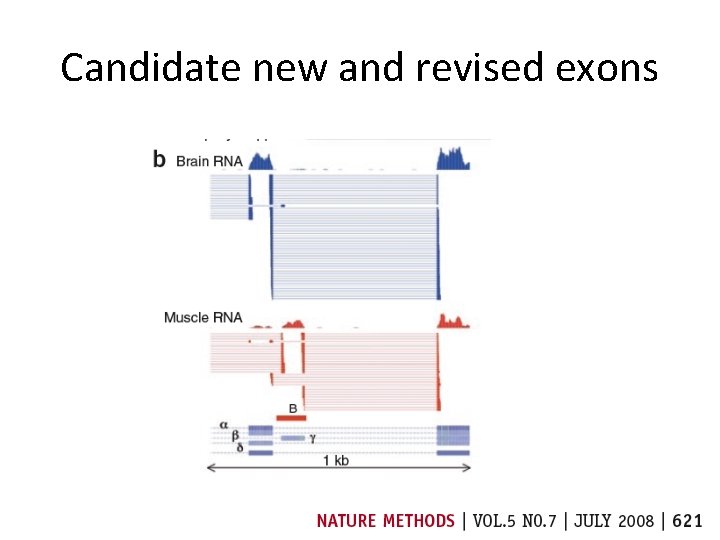
Candidate new and revised exons
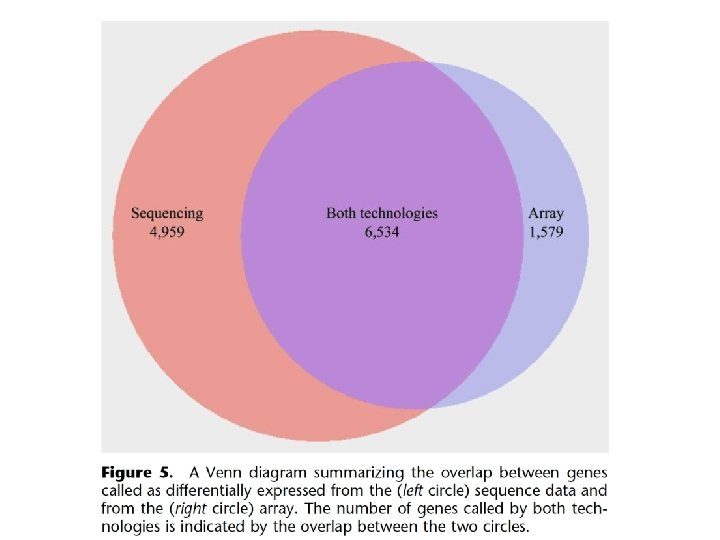
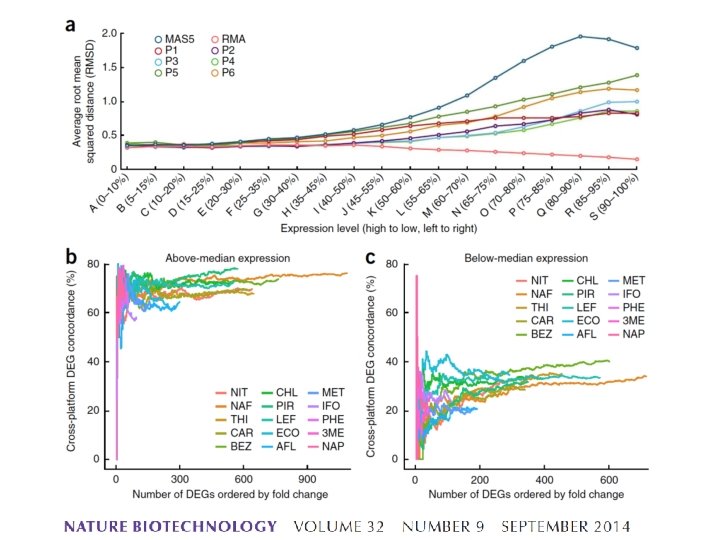
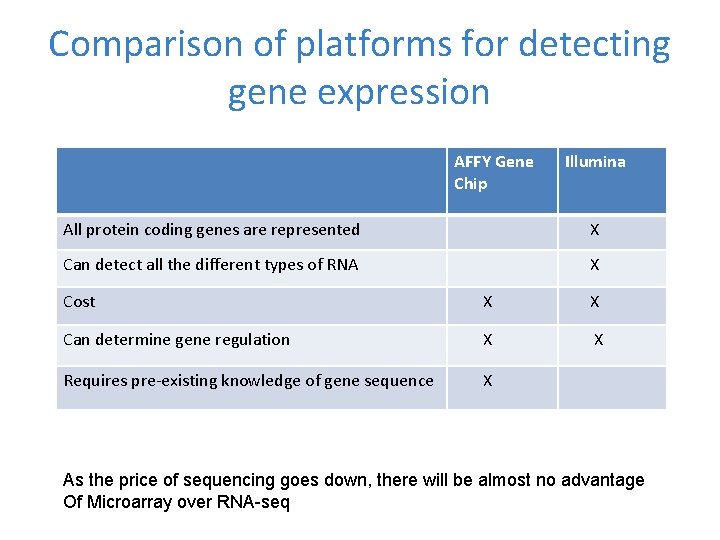
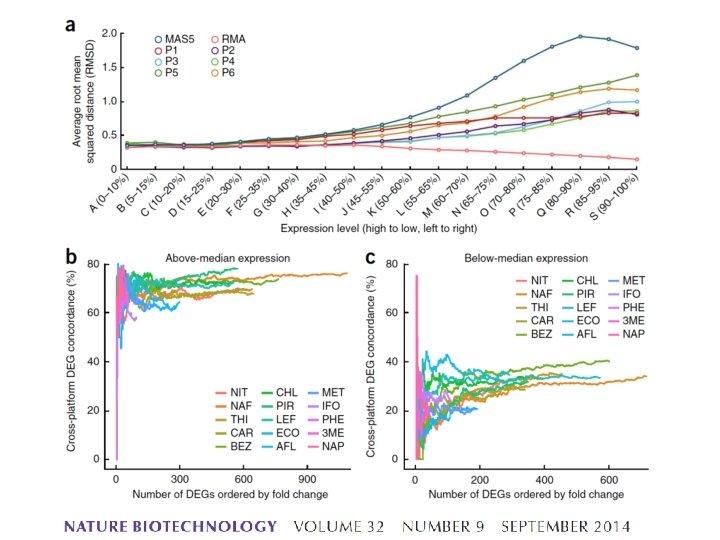
Comparison of platforms for detecting gene expression AFFY Gene Chip Illumina All protein coding genes are represented X Can detect all the different types of RNA X Cost X X Can determine gene regulation X X Requires pre-existing knowledge of gene sequence X As the price of sequencing goes down, there will be almost no advantage Of Microarray over RNA-seq
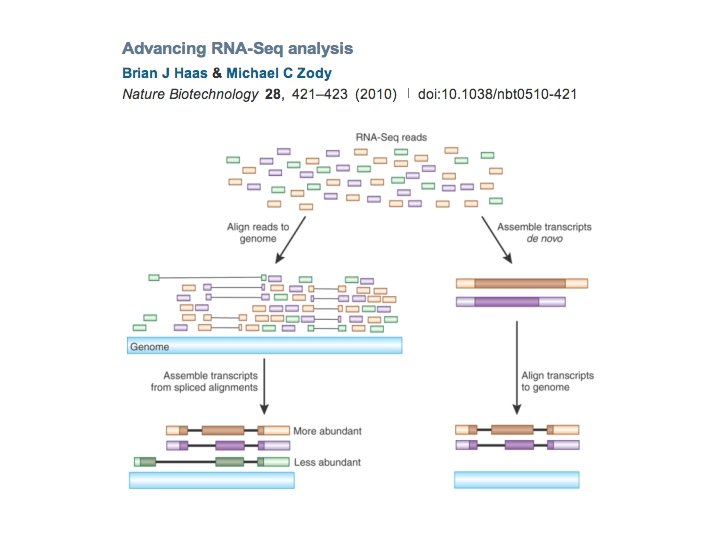
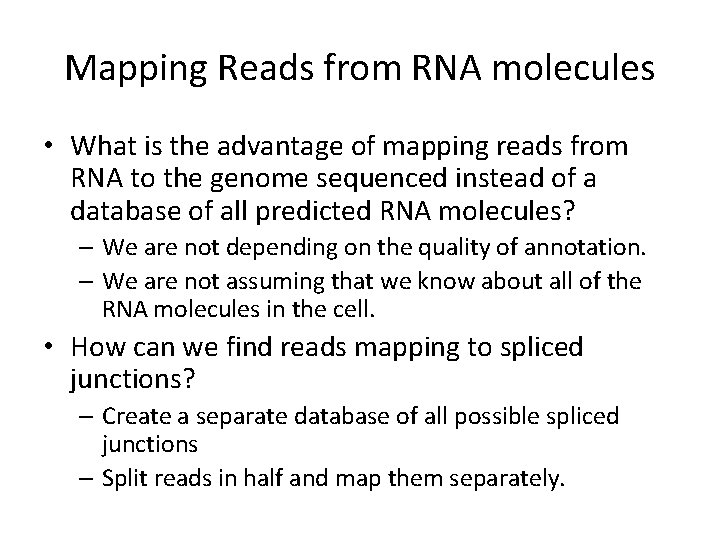
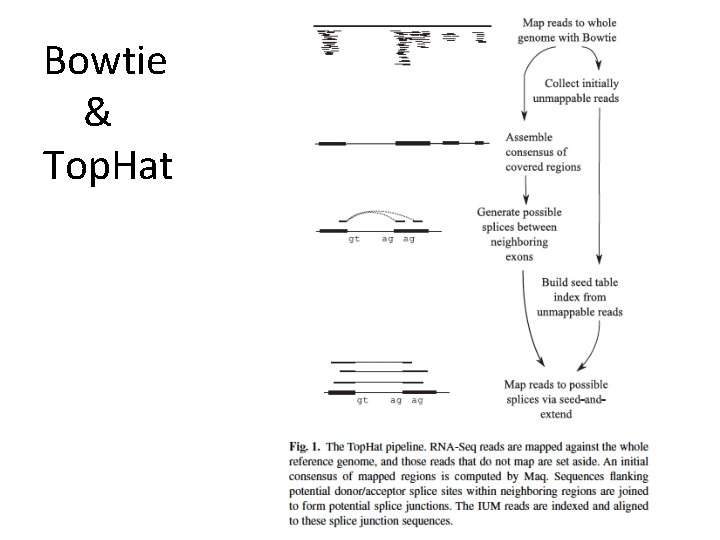
Mapping Reads from RNA molecules • What is the advantage of mapping reads from RNA to the genome sequenced instead of a database of all predicted RNA molecules? – We are not depending on the quality of annotation. – We are not assuming that we know about all of the RNA molecules in the cell. • How can we find reads mapping to spliced junctions? – Create a separate database of all possible spliced junctions – Split reads in half and map them separately.
Bowtie & Top. Hat
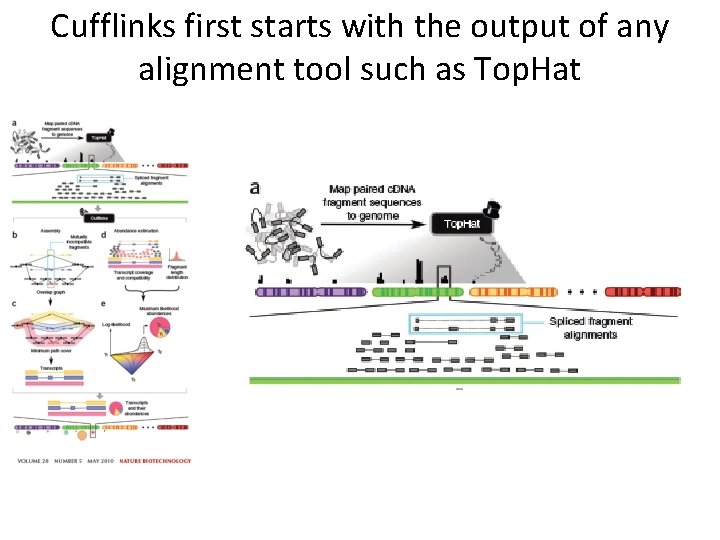
Cufflinks first starts with the output of any alignment tool such as Top. Hat
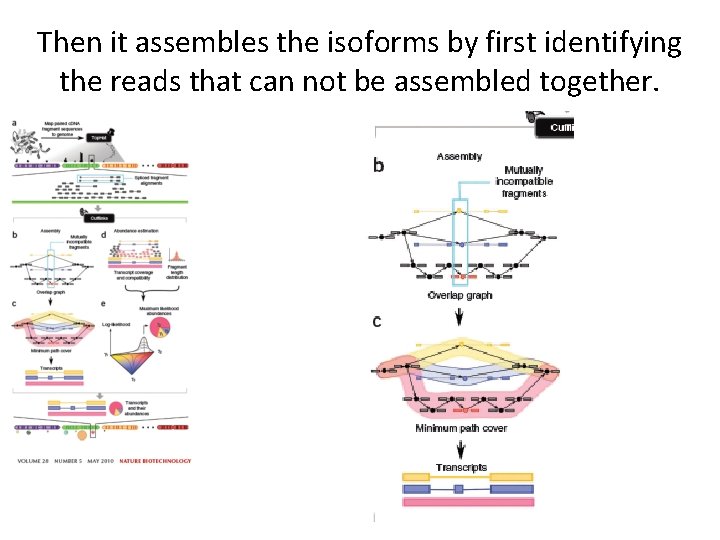
Then it assembles the isoforms by first identifying the reads that can not be assembled together.
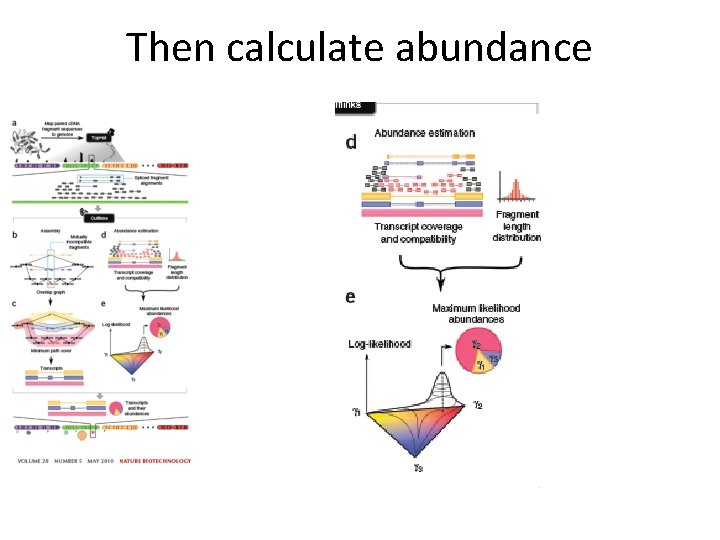
Then calculate abundance
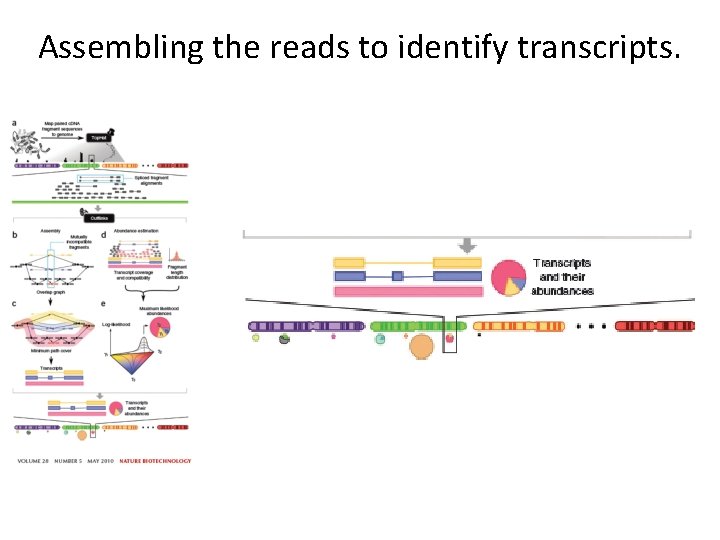
Assembling the reads to identify transcripts.
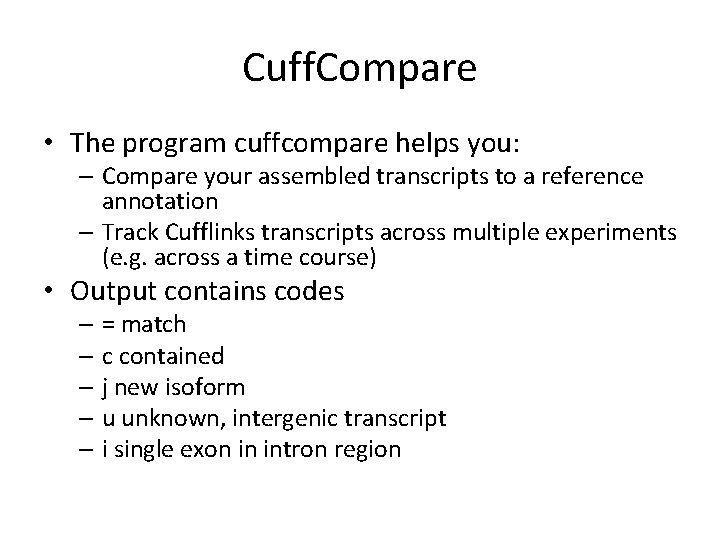
Cuff. Compare • The program cuffcompare helps you: – Compare your assembled transcripts to a reference annotation – Track Cufflinks transcripts across multiple experiments (e. g. across a time course) • Output contains codes – = match – c contained – j new isoform – u unknown, intergenic transcript – i single exon in intron region
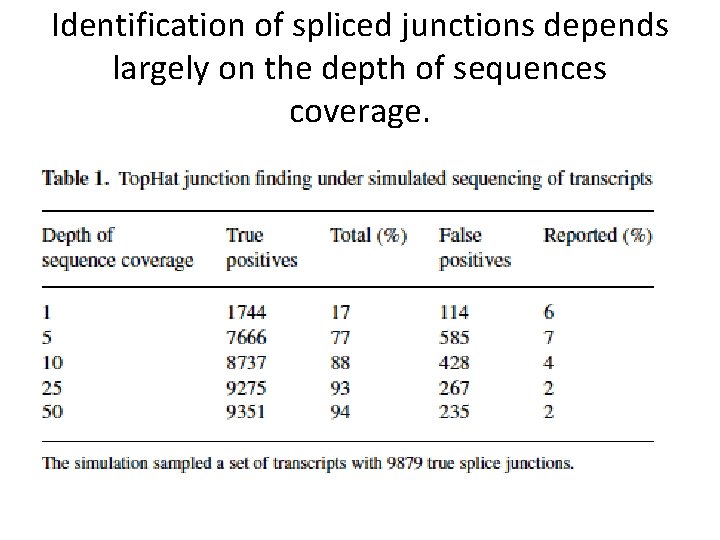
Identification of spliced junctions depends largely on the depth of sequences coverage.
Cuffdiff • Can be use to find significant changes in transcript expression, splicing, and promoter use. – Inputs are: • Annotation to compare (can be output from cufflinks) • Tophat output from different samples • Options are similar to cufflinks, can also specify a different FDR cutoff.
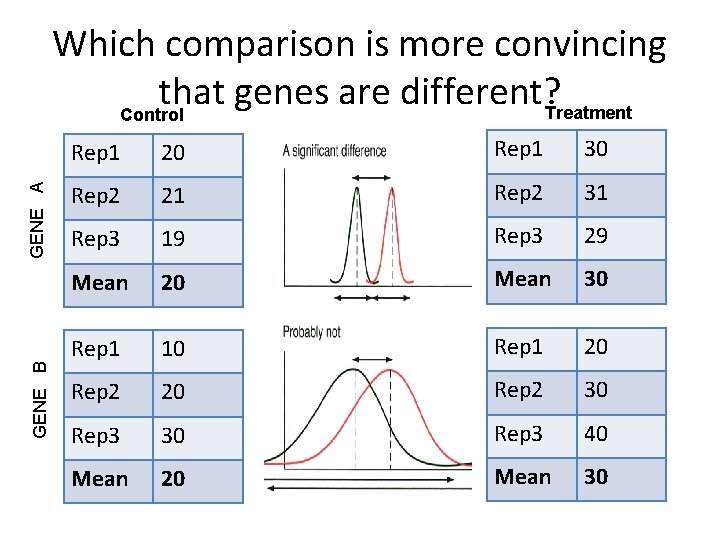
GENE B GENE A Which comparison is more convincing that genes are different? Treatment Control Rep 1 20 Rep 1 30 Rep 2 21 Rep 2 31 Rep 3 19 Rep 3 29 Mean 20 Mean 30 Rep 1 10 Rep 1 20 Rep 2 30 Rep 3 40 Mean 20 Mean 30 COMPARISON A COMPARISON B
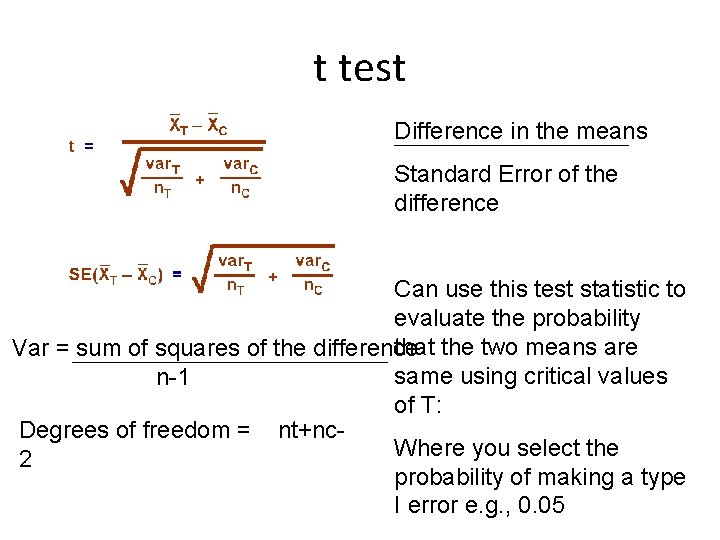
t test Difference in the means Standard Error of the difference Can use this test statistic to evaluate the probability that the two means are Var = sum of squares of the difference same using critical values n-1 of T: Degrees of freedom = nt+nc. Where you select the 2 probability of making a type I error e. g. , 0. 05
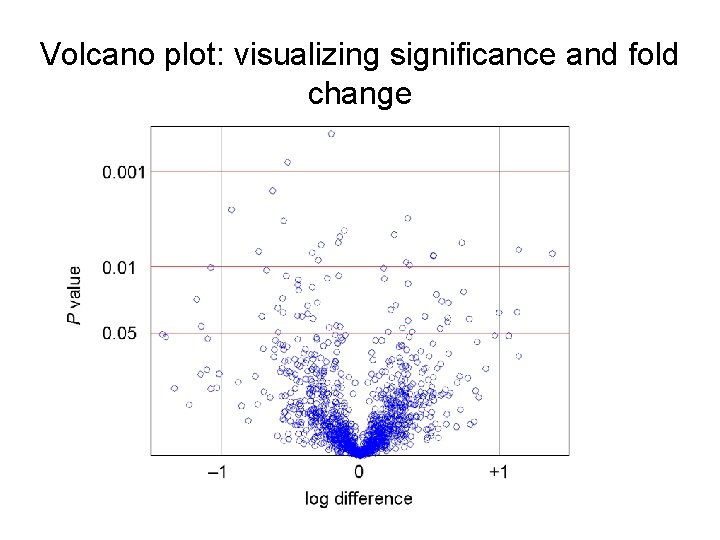
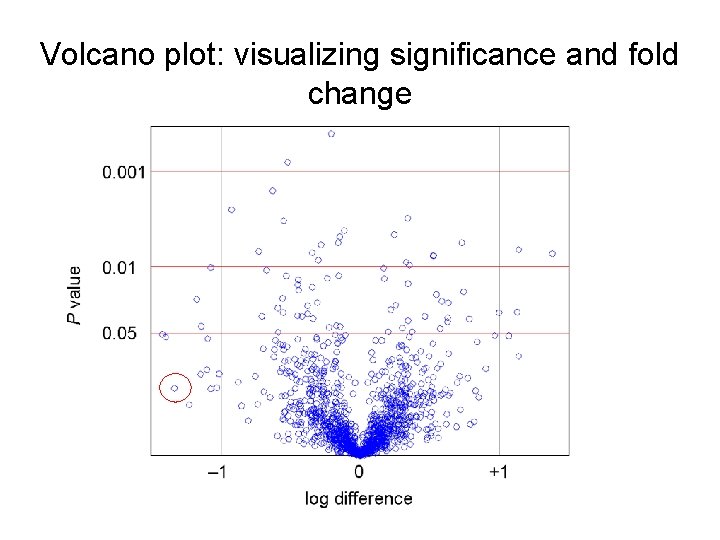
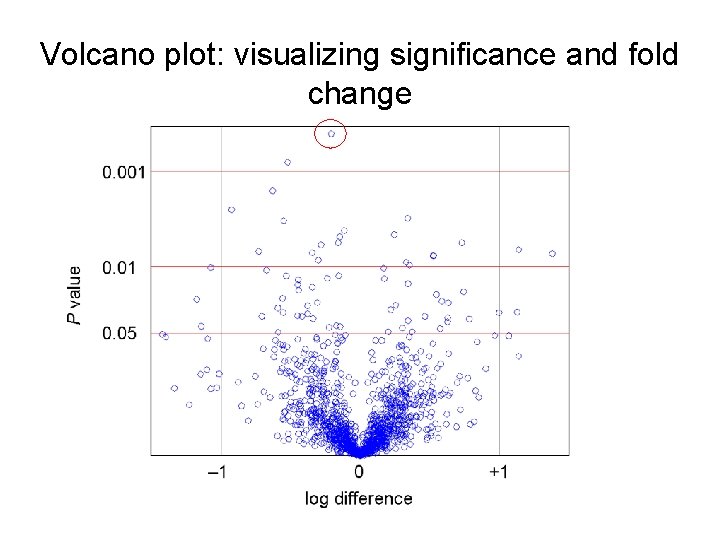
Volcano plot: visualizing significance and fold change
Volcano plot: visualizing significance and fold change
Volcano plot: visualizing significance and fold change
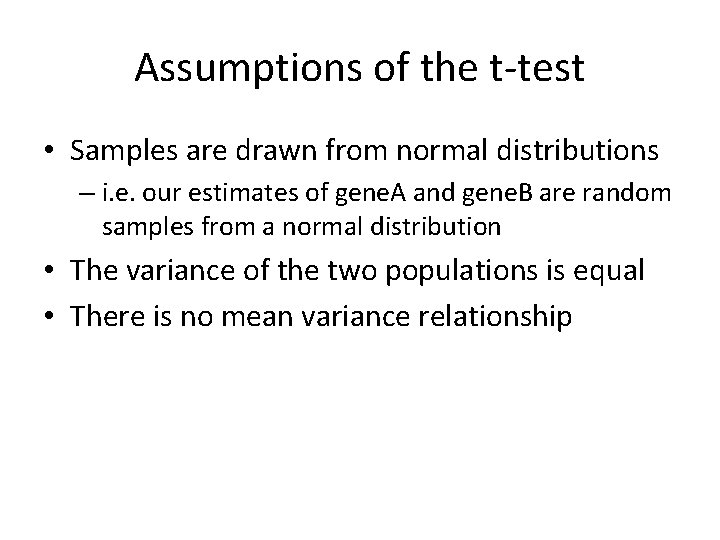
Assumptions of the t-test • Samples are drawn from normal distributions – i. e. our estimates of gene. A and gene. B are random samples from a normal distribution • The variance of the two populations is equal • There is no mean variance relationship
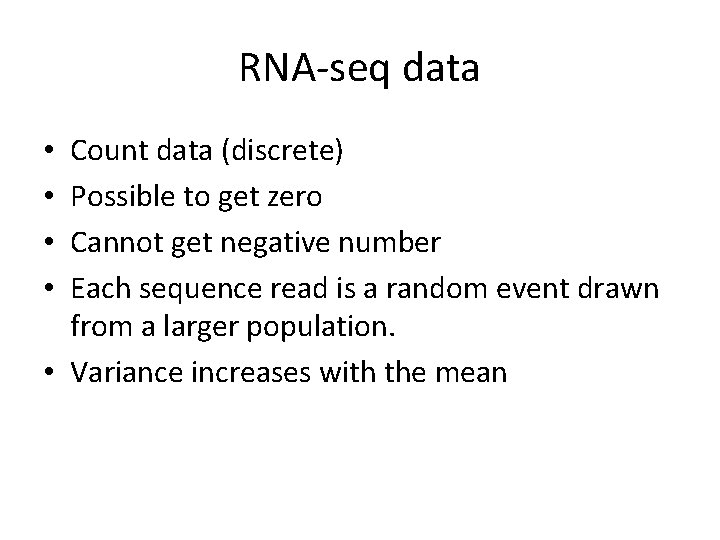
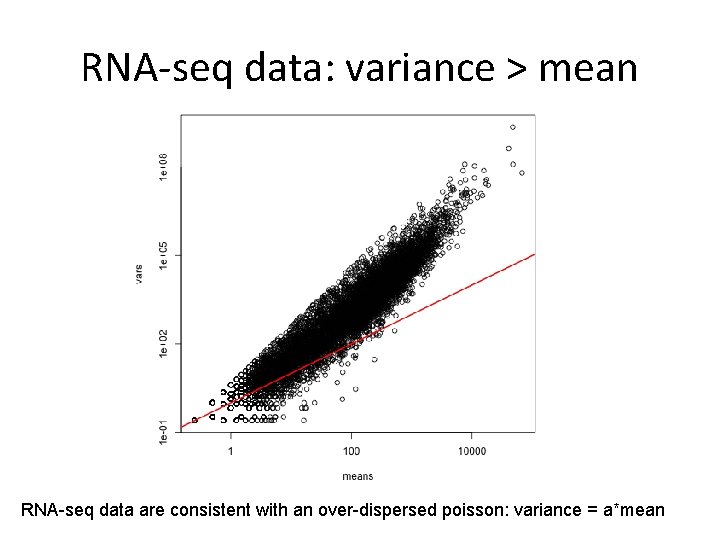
RNA-seq data Count data (discrete) Possible to get zero Cannot get negative number Each sequence read is a random event drawn from a larger population. • Variance increases with the mean • •
RNA-seq data: variance > mean RNA-seq data are consistent with an over-dispersed poisson: variance = a*mean
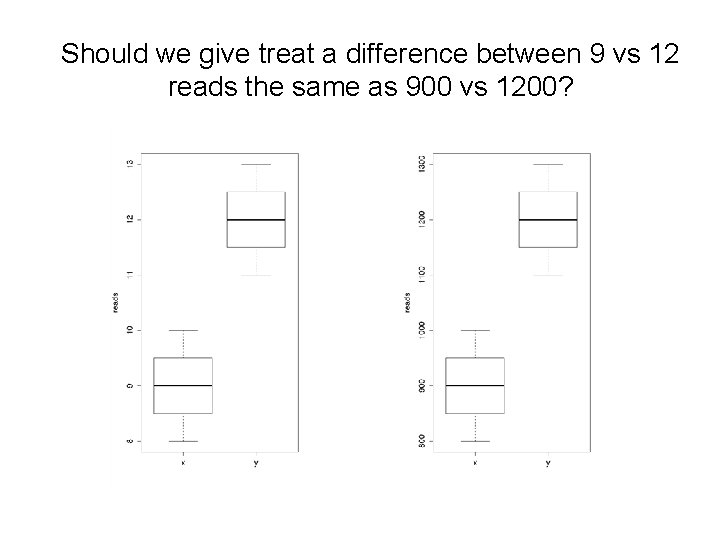
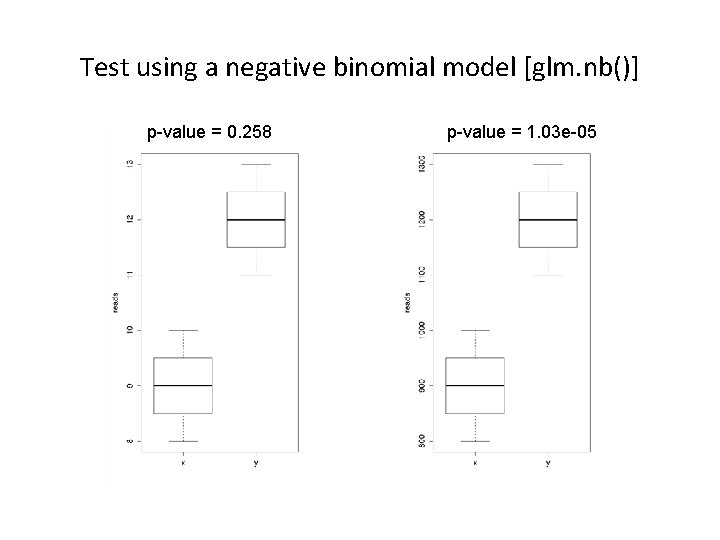
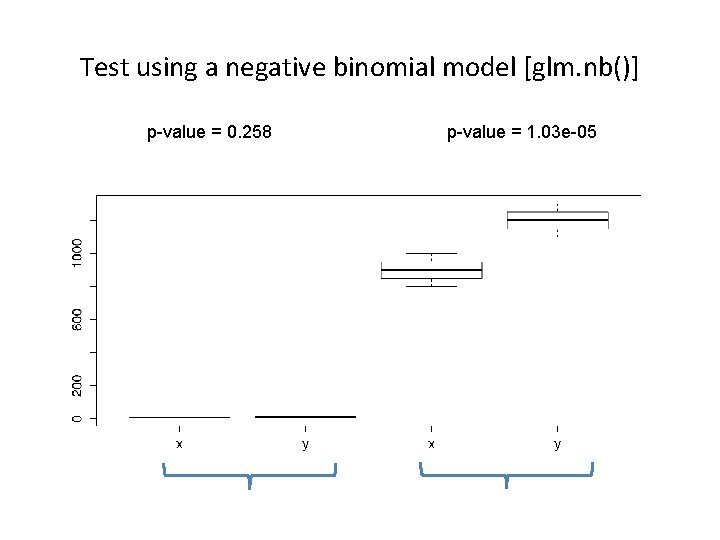
Should we give treat a difference between 9 vs 12 reads the same as 900 vs 1200?
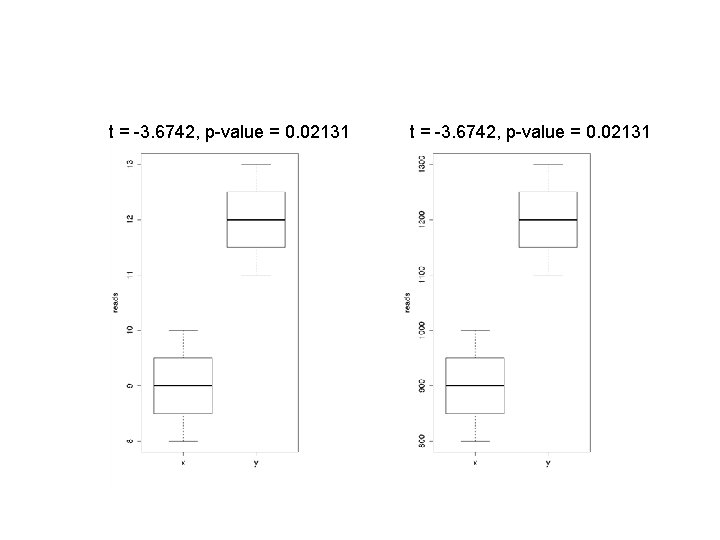
t = -3. 6742, p-value = 0. 02131
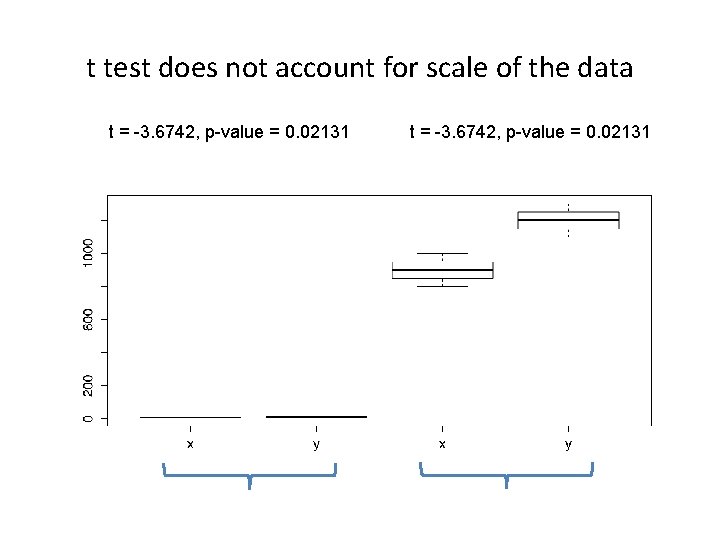
t test does not account for scale of the data t = -3. 6742, p-value = 0. 02131
Test using a negative binomial model [glm. nb()] p-value = 0. 258 p-value = 1. 03 e-05
Test using a negative binomial model [glm. nb()] p-value = 0. 258 p-value = 1. 03 e-05
RNA-seq pipeline Manpreet S. Katari
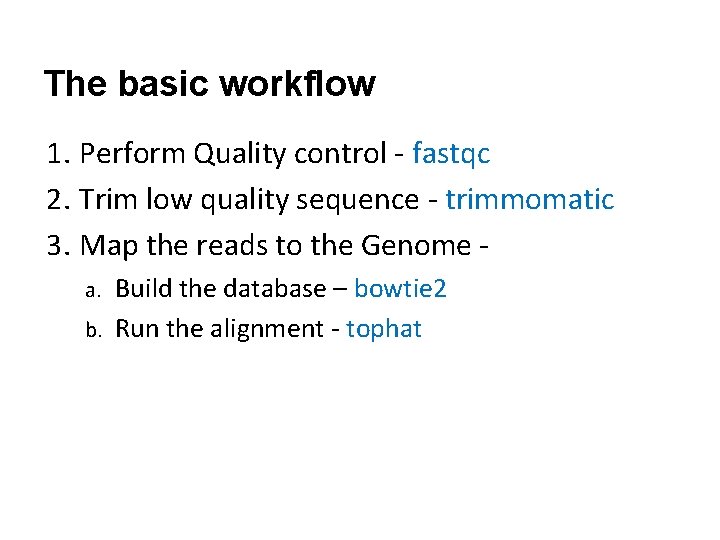
The basic workflow 1. Perform Quality control - fastqc 2. Trim low quality sequence - trimmomatic 3. Map the reads to the Genome Build the database – bowtie 2 b. Run the alignment - tophat a.