Rivers and Streams The Hydrologic Cycle Rivers and


 or")


 F Suspended load: silt and clay carried in suspension")


/R Y = # of years")


- Slides: 72
Rivers and Streams The Hydrologic Cycle
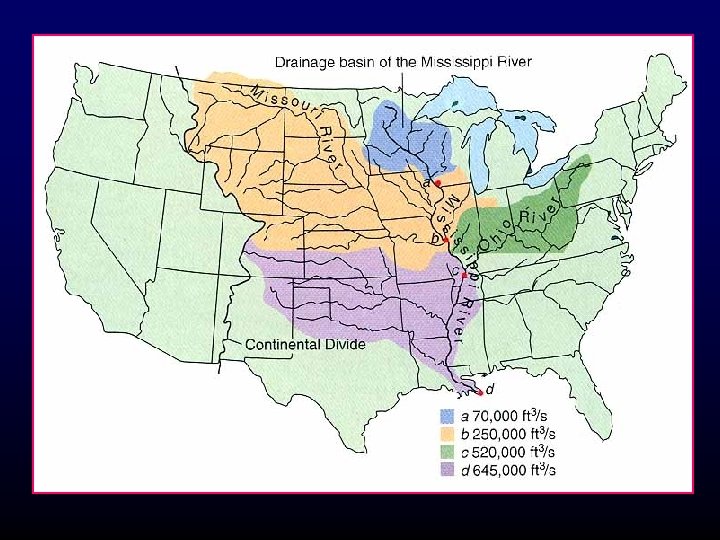
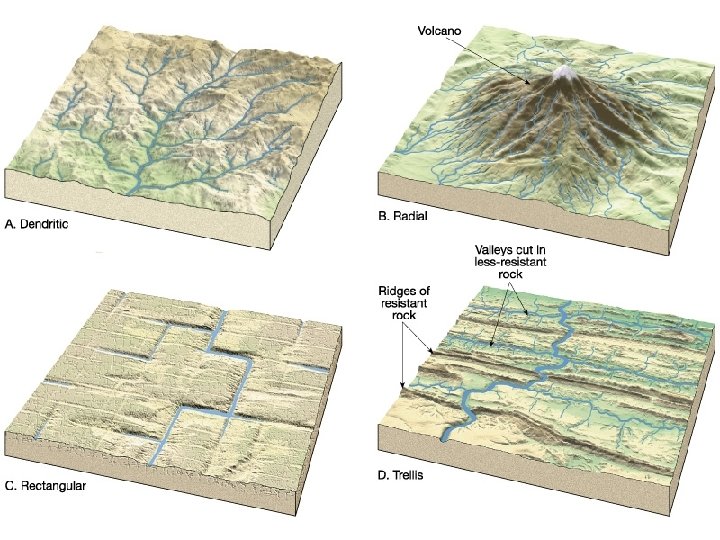
Rivers and Streams Drainage basin or watershed
A River Mill Creek Drainage Basin
Walla. Basin Walla River Drainage Basin Mill Creek Drainage
Flow
Flow
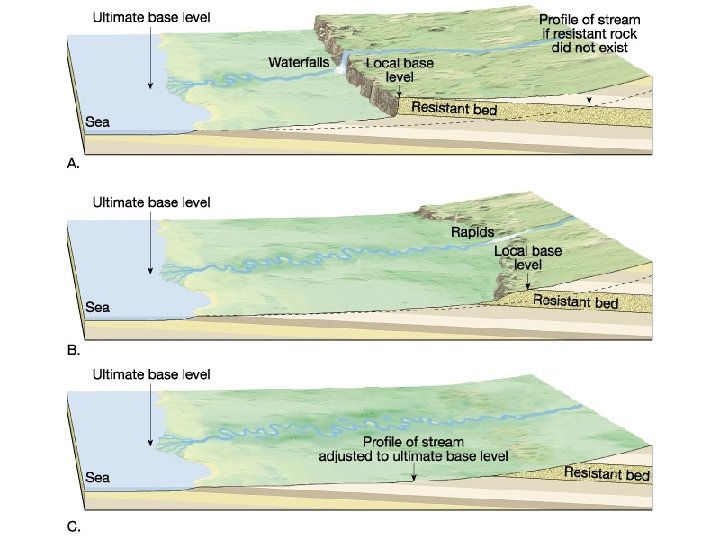
Equilibrium and the longitudinal profile Gradient Velocity Discharge Q=Vx. A ft 3/sec (cfs) or m 3/sec (cms) V = velocity A = Cross-sectional area = Width x mean depth Base level (ultimate and local)Gradient Load
Velocity Variation
Variations with Discharge
Load
Load: Bed load (rolling, saltation) F Suspended load: silt and clay carried in suspension F Dissolved load: ions in solution HCO 3 - SO 42 - Ca 2+ Na+ Mg 2+ typically 90% of dissolved Competence: the amount of load that a particular stream can carry F
Load: Suspended Load
Load: Bed-load
2000 Hydrograph for Mill Creek at Walla Averages for 1942 -1990 1800 1600 Discharge (cfs) 1400 1200 1000 800 600 400 Maximum 200 Mean Oct Nov Dec Jan Feb Mar Apr May Jun Jul Aug Sep
The Graded Stream The Longitudinal Profile
Braided/Meandering
Braided/Meandering
Velocity Variation
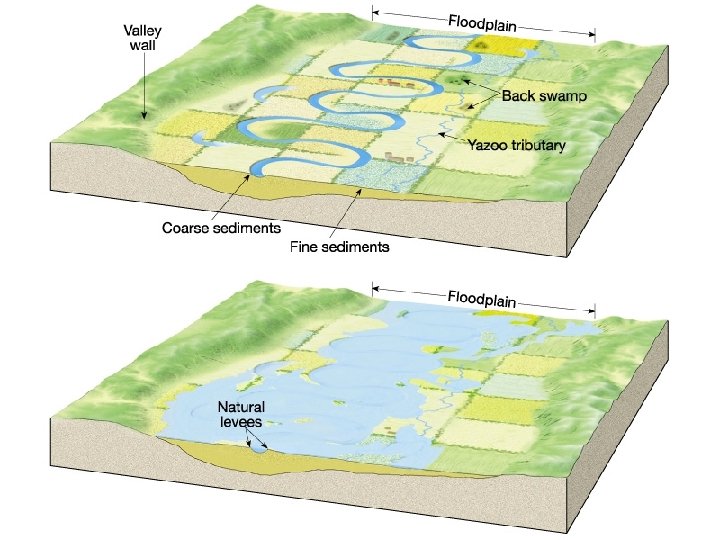
Meandering and Floodplains
Point Bar – Cut Bank
Point Bar – Cut Bank
Point Bar – Cut Bank
Point Bar – Cut Bank
Meandering and Floodplains
Meandering and Floodplains
Meandering and Floodplains
Meandering and Floodplains
Meandering and Floodplains
Meandering and Floodplains
Meandering and Floodplains
Deltas
Deltas
Deltas
Deltas
Deltas
Alluvial Fans
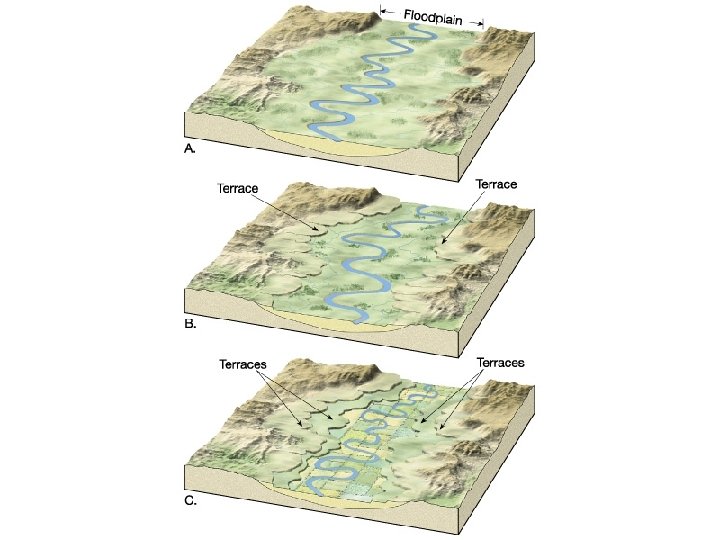
Floodplain Terraces
Floodplain Terraces
Stream Piracy
Flooding is dependent upon F precipitation in drainage basin F precipitation rate/infiltration rate F topography Flood Discharge = channel discharge when a river overflows its banks Flood Magnitude = discharge above flood discharge Flood Stage = elevation of water surface for a high-water condition likely to damage Thus depends on use of floodplain
Hydrograph for Mill Creek flood, Feb, 1996 Measured at Kooskie (max. was 6000 cfs at Walla) Mill Creek Flows 3500 Discharge (cfs) 3000 2500 2000 1500 1000 500 0 0 5 10 Day in Feb, 1996 15
Recurrence Interval as flood indicator Rec. Int. = (Y-1)/R Y = # of years for data R = rank of flood
Natural Levee
Response to Flood Hazards F Physical barriers · Levees · Flood walls with huge steel gates around towns · Retention reservoirs · Channelization to handle increase discharge · Storm channel system (LA)
Levees protect area behind until flood becomes too great working levee damming water behind it failed levee
Floodwalls on Mississippi in St. Louis and New Orleans
Flood Hazard Mapping Satellite images Upper = normal flow 1988 Lower = 1993 flooding
Landscape Evolution