Rivers and Stream Water Quality Management Water Quality


- oxidation of an organic compound is")


 • These include – Polychlorinated biphenyls – Pesticides – Phthalates •")


 and climates •")
 Watershed, climate &")


 O 2 O 2 Diffusion Water column respiration Sediment respiration (bacteria")


i. e. . ,")


 terminology Oligotrophic – low nutrients and “productivity; ” usually high clarity")


![Carlson TSI equations • TSI-S = 60 - 14. 41 ln [Secchi disk, m]](https://slidetodoc.com/presentation_image_h/9d025446b19cbc1ed483ca7a6e001052/image-53.jpg "Carlson TSI equations • TSI-S = 60 - 14. 41 ln [Secchi disk, m]")
 - graphical Oligotrophic Mesotrophic Eutrophic Hypereutrophic")

 106 CO 2")


 • Natural Sources - weathering of rocks • Municipal and")


O 2 - (important in lake metabolism")
 -TDS) / salinity • Winkler method - oxygen •")


 Land Use Export Coefficients (g/m")


 converted to organic material per square")
 6 CO 2 + 6 H 2 O+ solar energy C")
")


 • Developed algorithm to determine suspended sediment from Landsat MSS")
 • Worked to incorporated RS data into a water")


- Slides: 90
Rivers and Stream Water Quality Management
Water Quality Definitions • Contaminant - any constituent in the water deleterious to a particular end use regardless of its origin and whether it occurs in the watershed, source or in a water supply system • Pollutant - any constituent in the water source deleterious to a particular end use that is of anthropogenic origin • Pollutant = subset of contaminant Contaminants Pollutants isis. csuhayward. edu/alss/Geography/ mlee/geog 4350/4350 c 4 f 01. ppt
Types of Pollution • Disease-causing Agents – pathogens • Oxygen Demanding Agents – organic waste: manure • Water-soluble Inorganic Chemicals – acids, toxic metals • Inorganic Plant Nutrients – nitrogen and phosphorus • Organic Chemicals – oil, pesticides, detergents, Pharmaceuticals, MTBE • Sediment or Suspended Material – erosion, soil • Water-soluble Radioactive Isotopes – radon uranium • Heat – electric and nuclear power plants
Rivers • Rivers have been easy targets for dumping of sewage and industrial wastes • Many rivers that are in industrial areas are so polluted and low in oxygen that very few species can live in them anymore
Water Quality is. Management • Water quality management the science that predicts how much waste is too much for a body of water • Assimilated- amount of waste that can be tolerated by a body of water • Determined by knowing the type of pollutants discharged and their effect on water quality • Water quality is affected by natural factors: – Historical uses in the watershed – Geometry of the watershed area – Climate of the region • Good water quality protects drinking water as well as wildlife
Dissolved Oxygen DO • If the discharge of oxygendemanding wastes is within the self-purification capacity, the DO is high • Aquatic life cannot survive without DO • Objective of water quality
Sources of Water Pollution Ø Water pollution can come from a single source ØPoint Source Ø or a variety of dispersed sources Ø non-point source
Point Sources of Pollutants • Point sources include domestic sewage and industrial wastes • Point sources - collected by a network of pipes or channels and conveyed to a single point of discharge in receiving water • Municipal sewage - domestic sewage and industrial wastes that are discharged into sanitary sewers hopefully treated • Point source pollution can be controlled by waste minimization and proper wastewater treatment
Nonpoint Sources • Urban and agricultural runoff that are characterized by overland discharge • scattered and diffuse logged forest, urban streets, lawns and parking lots • This type of pollution occurs during rainstorms and spring snowmelt • Pollution can be reduced by changing land use practices • and cannot be traced to any single site of discharge (difficult to control)
Combined Sewer Flow • Nonpoint pollution from urban storm water collects in combined sewers • Combined sewers- carry both storm water and municipal sewage
Point and Nonpoint Sources NONPOINT SOURCES Rural homes Cropland Urban streets Animal feedlot Suburban development POINT SOURCES Factory Wastewater treatment plant Fig. 22 -4 p. 494
Biochemical oxygen demand • Biochemical oxygen demand (BOD)- oxidation of an organic compound is carried out by microorganisms using the organic matter as a food source • BOD is measured by finding the change in dissolved oxygen concentration before and after bacteria is added to consume organic matter
Nutrients • Nitrogen and phosphorus are considered pollutants when too much present in high conc. • High levels of nutrients cause disturbances in the food web • Organisms grow rapidly at the expense of others • Major sources of nutrients (N, P): – Phosphorus-based detergent – Fertilizer and agricultural runoff – Food-processing wastes – Animal and human waste
Toxic metals and toxic organic compounds • Agricultural runoff contains pesticides and herbicides • Urban runoff contains zinc - from tires • Too many toxic metals and toxic organic substances can leave a body of water useless – Zarjob River in Rasht • Toxic compounds can also make fish and shellfish unsafe to eat - As, Hg, Pb, and PCBs • The new concern is pharmaceutical chemicals in water and wastewater
Endocrine-Disrupting Chemicals (EDCs) • These include – Polychlorinated biphenyls – Pesticides – Phthalates • No suitable method exists to characterize EDC’s • Can mimic estrogens, androgens, or thyroid hormones • Interfere with regular animal reproduction • Affects synthesis of hormones in the body
Effect of Pollution on Streams • Pollutants can act as high-energy organic material – oxygen used at greater rate than before pollution occurred – DO level drops (dissolved oxygen sag curve) – rate of reaeration may not overcome depletion --> anaerobic • Critical DO levels occur when flow is lowest – most state regs are based on statistical low flow – UT regs based on 7 -day, 10 -year minimum • 7 consecutive days of lowest flow that can be expected to occur once during a 10 -year interval
Effect of Pollution on Streams • Characteristics of anaerobic streams – floating sludge solids & formation of gas which bubbles to surface • gases form (ammonia and sulfide) since oxygen no longer around to act as hydrogen acceptor • some gases readily dissolved, others attach as bubbles to hunks of solid material (benthic deposits), and buoy this material to surface • H 2 S emitted smells like rotten eggs – color of water generally black
Pollution of Streams Oxygen sag curve
Reservoirs and Lakes • Lakes reflect their watersheds (soils, vegetation, landuses) and climates • Morphometry (shape, depth, size) and hydrology (flushing rate) are important determinants of how lakes function • Lakes are very patchy - they are not homogeneous well-stirred bathtubs as they often appear to be - they exhibit great variability which creates large and small habitats
3 main factors determine a lake’s trophic state (its biological productivity) Watershed, climate & morphometry EVERYONE lives in a watershed! • Rate of nutrient supply (from watershed & airshed) – Bedrock geology, soils, vegetation, land uses, atmospheric deposition • Climate – Sunlight, temperature, precipitation and hydrology • Morphometry – Depth (mean and max), – size (volume/area), – “roundness” (shoreline Watershed - the area of land draining to a particular lake, wetland or stream Everything that happens on the land affects its water quality Climate: rain, snow, wind, air temperature, flows, seasonality play a role in determining a lake’s trophic state.
Nutrient loading and Watershed area
Density, Thermal and Oxygen Stratification • Temperature and oxygen levels are major factors regulating aquatic organisms • The layering of lake waters due to density differences is a major factor structuring the ecosystem and creating distinct habitats • The seasonal pattern of turbulent mixing is also a critical determinant of ecosystem function and community structure
Lake Temperature and DO Stratification
Aquatic ecosystems: Light and nutrients most limit primary production Within the photic zone the factor that most often limits primary production is a nutrient such as nitrogen or phosphorus, or a micronutrient such as iron. Exception: upwelling regions. Fig. 54. 5
O 2: Human significance • Not a direct threat to humans • Directly affects fish physiology and habitat • Indirectly affects fish and other organisms via toxicants associated with anoxia: – H 2 S – NH 4+ (converts to NH 4 OH and NH 3 above ~p. H 9) • Indirectly affects domestic water supply – H 2 S (taste and odor) – Solubilizes Fe (staining) • Indirectly affects reservoir turbines – Via H 2 S corrosion and pitting (even stainless steel) – Via regulation of P-release from sediments (mediated via Fe(OH)3 adsorption)
Two Major Sources of O 2 Photosynthesis Wind energy
Major Sinks (losses) O 2 O 2 Diffusion Water column respiration Sediment respiration (bacteria and benthos)
Phosphorus – point sources • Wastewater – Municipal treated wastewater – Combined sewer overflows (CSOs) – Sanitary sewer overflows (SSOs) • Industrial discharges Phosphorus – external sources • Nonpoint sources – Watershed discharge from tributaries – Atmospheric deposition • Point sources – Wastewater – Industrial discharges
Phosphorus – nonpoint sources • Watershed discharges from tributaries – – – Strongly tied to erosion (land use management) Stormwater runoff (urban and rural) Agricultural and feedlot runoff On-site domestic sewage (failing septic systems) Sanitary sewer ex-filtration (leaky sewer lines) • Atmospheric deposition – Often an issue in more pristine areas – Arises from dust, soil particles, waterfowl
Phosphorus – internal sources • Mixing from anoxic bottom waters with high phosphate levels is closely tied to iron redox reactions – O 2 > 1 mg/L – Insoluble ferric (+3) salts form that precipitate and settle out, adsorbing PO 4 -3 – O 2 < 1 mg/L (anoxic) – ferric ion reduced to soluble ferrous ion (Fe+2) – allowing sediment phosphate to diffuse up into the water
Nitrogen – basic properties • Nitrogen is relatively scarce in some watersheds and therefore can be a limiting nutrient in aquatic systems • Essential nutrient (e. g. , amino acids, nucleic acids, proteins, chlorophyll) • Differences from phosphorus – Not geological in origin – Unlike phosphorus, there are many oxidation states
Nitrogen – sources • Atmospheric deposition – Wet and dry deposition (NO 3 - and NH 4+) – Combustion gases (power plants, vehicle exhaust, acid rain), dust, fertilizers • • Streams and groundwater (mostly NO 3 -) Sewage and feedlots (NO 3 - and NH 4+) Agricultural runoff (NO 3 - and NH 4+) Regeneration from aquatic sediments and the hypoliminion (NH 4+)
Lake Productivity • Measure of a lake’s ability to support aquatic life. • Determined by determining how much algae the available nutrients will support • Increased productivity generally means reduced water quality
Relationship between P Loading and Fish Yield
Management topics • Trophic status • Eutrophication • Water quality
Pollution of Lakes: Cultural Eutrophication
Th ous and s New lake sediment is created over time of y ear s
Lake Succession or Eutrophication
Definition • Eutrophic - from Greek eutophus meaning ‘high nutritious’ where production is high and mainly based on the impact of phosphorus content of the water • Lake - a waterbody in which wind-induced turbulence plays a major role in mixing of the water column • Natural eutrophication - caused by change in form & depth of basin as it gradually fills with sediment • Cultural eutrophication - accelerated run-off from land caused by human action, e. g. . , sewage, fertilizers
Trophic Status and Biotic Productivity Trophic nature of a waterbody )i. e. . , soluble nutrients and resulting biotic activity) is the result of the interaction of four important factors • edaphic - refers to nutrients available to a waterbody via weathering of soils within the drainage basin. Determines if a lake is rich and productive or relatively sterile • morphologic - dimensions of the basin • climatic - range of climates from severe to favourable for growth and production • human actions - e. g. . , land clearing, agriculture, damming, shoreline development
The Eutrophication Process • increased nutrients • primarily phosphorus from catchment area • > photosynthesis due to > light & > heat in summer • increased growth of primary producers • increased O 2 due to photosynthesis • reduction in water transparency • due to abundance of primary producers • increased dead organic matter • increased bacteria feeding on matter • reduced oxygen contentration • reduced species populations
Indicators of trophic status • • specific nutrient loading nutrient concentration • critical phosphorus concentration : 0. 01 gm -3 • critical nitrogen concentration : 0. 3 gm -3 hypolimnetic oxygen depletion rate : > 550 mg m -3 day -1 secchi disc depth : vanishing point < 3. 0 m annual plankton primary productivity • carbon assimilation : 3000 - mg m-2 day-1 • chlorophyll-a concentration : 10 100 - mg m-3 chlorophyll-a • algal densities other trophic indicies • diatom populations : > 2 • indicator species waterbody characteristics
Negative Biological Effects • excessive visible algal plant growth • interference with the abundance of rooted aquatic plants sensitive to light • possible interference with drinking water • hypolimnetic anoxia due to algal decomposition • reduced water transparency • rapid shift in species composition of the biological community • reduced abundance of fish associated with weed beds • fish kills • consequences for birds
Eutrophication • • plentiful supply of nutrients --> uncontrolled growth of algae when algae plus zooplankton and fish die, drop to bottom and add to carbon source for bacteria aerobic bacteria will use all available DO to decompose this material if deplete all available DO --> anaerobic as more bacteria produced in epilimnion, bacteria in lower portions utilize more • • Natural aging process Can be accelerated (cultural eutrophication) oxygen and metalimnion --> anaerobic – all aerobic biological activity would concentrate in upper few meter • causing turbidity • decreasing light penetration • limiting algal activity to surface layers • amount of DO contributed by algae decreased – – – • increase in nutrients and organic substances, sediments overstimulation in growth of algae and aquatic plants create conditions that interfere with recreational uses of lakes, and the health and diversity of indigenous life Problems – – – algae blooms which form surface mats on water taste and odor problems due to algae noxious plants clog shoreline and reduce access to water body dead algae sink to bottom fish suffocate
Stages of Eutrophication • Oligotrophic: Clear water, minimal organic matter or sediment, minimum biological activity • Mesotrophic: More nutrients, more biological activity • Eutrophic: Nutrient-rich, high biological activity, change in aquatic species • Hypereutrophic: Murky, highly productive, closest to wetland; many clearwater species cannot survive
HUMAN IMPACTS Cultural Eutrophication – Excess fertility leading to excessive plant growth 1. Increased N and P availability 2. Increased algal blooms, nutrient pulse used up 3. Algae die, increased detritus 4. Increased decomposition 5. Decreased Oxygen 6. Anaerobic conditions kill fish, other animals
Trophic (feeding metabolism) terminology Oligotrophic – low nutrients and “productivity; ” usually high clarity Mesotrophic – moderate nutrients, “productivity” and clarity Eutrophic – high nutrients and “productivity; ” low clarity
Classifications of Productivity Oligotrophic water body Eutrophic water body Figure 14. 18 b, c
Microcystis bloom covers 600 sq. km
Microcystis A toxic blue-green alga
Remember from lecture on carbon, warm water and high photosynthesis can cause a precipitation of calcium carbonate. This precipitate can remain in suspension and cause the lakes to look milky, called “whiting” http: //earthobservatory. nasa. gov/Newsroom/New. Images/seawifs_lake_mich_2001_tn. jpg Eventually, the precipitate settles to the sediment
Lake Classification
Carlson TSI equations • TSI-S = 60 - 14. 41 ln [Secchi disk, m] • TSI-C = 9. 81 ln [Chlor-a, µg/L] + 30. 6 • TSI-P = 14. 42 ln [TP, µg/L] + 4. 15 • Average TSI = [TSI-P + TSI-C + TSI-S] / 3 • If the 3 TSI values are not similar to each other, it is likely that: • algae may be light- or nitrogen-limited instead of P-limited, or • secchi is affected by erosional silt rather than by algae, or something else. One should look deeper into the data! • Note that Dr. Carlson recommended not averaging the 3 values to avoid obscuring important differences
TSI (Carlson) - graphical Oligotrophic Mesotrophic Eutrophic Hypereutrophic
Limiting Cultural Eutrophication • Limit input of nutrients - phosphorous, nitrogen and trace elements • Reversing eutrophication – Add an agent to remove (precipitate) P – Dredge sediment to remove P
Productivity • Stoichiometry of photosysnthesis (C, N, P, O & H) 106 CO 2 + 16 NO 3 - + HPO 42 - + 122 H 2 O → C 106 H 263 O 110 N 16 P + 138 O 2 • Liebig’s law of the minimum – growth will be limited by the availability of the nutrient that is least available
Limiting Nutrients • Most marine systems are nitrogen limited • Excessive inputs will cause an algal bloom • Estimated that total phosphorus concentration in lake water should be below 0. 010 -0. 015 mg/L to prevent algal blooms
Limiting Nutrients • Most freshwater systems are phosphorus limited • Inputs of the limiting nutrient will result in a productivity increase – growth of algae
Sources of Phosphorus (reductions) • Natural Sources - weathering of rocks • Municipal and industrial wastewater – human excrement (build better WWTPs) – detergents (change the formula) – some industries (treatment at the source) • Septic tank seepage (proper construction & location) • Agricultural runoff - fertilizer (applying small amounts more frequently rather and a lot at once)
Phosphorous • • • major cause of eutrophication one of the most limiting inorganic elements not needed in large quantities highly soluble exerts control on plant growth most easily controlled nutrient from a human perspective excreted by fish and zooplankton controlled by dissolved oxygen accumulates in sediment rate of recycling to hypolimnion > with mineralisation recycling can sustain eutrophy long after external inputs of phosphorus are decreased
Control Perspectives point sources - effluent discharges from a pipe • phosphorus in municipal sewage treatment plants is usually bioavailable at point of discharge • this phosphorus is in soluble form and easily and rapidly used by aquatic plants • point sources discharging directly into lakes are usually most important sources of bioavailable phosphorus to consider in a control programme nonpoint sources - diffused runoff from land surface including agricultural runoff from fields & feedlots & urban storm sewer discharges • carbon and nitrogen have atmospheric sources which would negate efforts to control them in water
Eutrophication = nutrient over enrichment Phosphorus freshwater Nitrogen salt & brackish Limiting nutrient: The one in shortest supply relative to demand. If you add more of that nutrient the plants/algae will grow
Chemical Aspects • • • dissolved oxygen )O 2 - (important in lake metabolism solubility of O 2 - saturation level distribution of dissolved O 2 - determined by circulation phosphorus salinity - inorganic ion concentration total dissolved solids (TDS( alkalinity - high/low determines buffering capabilities p. H and buffering - controls chemical state of many nutrients dissolved organic carbon/matter (DOC/DOM) - influences water transparency - photic zone depth buffering, availability of ions/toxins, water chemistry
Measuring levels • conductivity ) -TDS) / salinity • Winkler method - oxygen • HACH kit • oxygen defecits • Redox potential - important to primary production • p. H - proton activity • p. E - electron activity • biotic index
Lake Restoration • technical solutions • dredging • physical removal of nutrient-rich sediment • Riplox • chemical & bacterial processes reduce internal loading of phosphorous • biomanipulation • biological interaction to alter components of food-web to
Eutrophication Models Introduction Ecological systems are very complex. Uncertainty associated with: · Structure of the model. · Parameter values. · Input data. A model is a simplification of the ecological system. The parameters are the coefficients in the Mathematical. representation of the processes. Uncertainty is inherent to the model’s predictions. As a management tool, sensitivity of the model output to the different sources of uncertainty must be evaluated.
Modeling Process Introduction Goals Available Data Previous Knowledge Assumptions Model Parameters Model Structure Reduction # Parameters Model Definition Sensitivity Analysis Fitting Function Feed-back Validation Calibration Independent Data Set
Watershed Nutrient Export Coefficients (from Rast and Lee, 1983) Land Use Export Coefficients (g/m 2/y) Total Phosphorus Total Nitrogen Urban 0. 1 0. 5 0. 25* Rural/Agriculture 0. 05 0. 2* Forest 0. 01 0. 3 0. 1* Rainfall 0. 02 0. 8 Dry Fallout 0. 08 1. 6 Other: Domestic Wastewater 1 kg. P/person/yr 3 kg. N/person/yr (nitrate, nitrite, ammonia, organic N) * Export Coefficients Used in Calculating Nitrogen Loadings for Waterbodies in Western US
Which water quality properties can be determined using RS? • Only conditions or substances which change the optical and/or thermal characteristics of surface waters. – Chlorophyll – Suspended sediment – Dissolved organic matter – Hydrocarbons – Temperature
Which properties can RS not detect? – Dissolved nutrients – Metals These properties may be inferred using other properties (like chlorophyll) which exhibit a response
Using RS to detect chlorophyll • An excess of nutrients in a body of water can lead to eutrophication (increased production of algae/plankton) • Eutrophication is quantified by concentration of chlorophyll in algae/plankton • Can measure chlorophyll by finding relationships between radiance/reflectance and chlorophyll from in situ measurements
Photosynthesis • Inorganic carbon transformed into organic molecules using sunlight as energy source: • 6 CO 2 + 6 H 2 O +sunlight C 6 H 12 O 6 + 6 O 2
Primary Productivity • Amount of carbon (in grams) converted to organic material per square meter of lake’s surface per unit time. – A measurement of rate – Units = g C/m 2/yr • Gross Primary Productivity, Pg – Total PP without considering losses. • Net Primary Productivity, Pn – Gross PP minus losses due to respiration. Pn = Pg – R. – Amount left over for growth & reproduction
Gross production (photosynthesis) 6 CO 2 + 6 H 2 O+ solar energy C 6 H 12 O 6 + 6 O 2 ) e nc n ai ss (respiration) C 6 H 12 O 6 + 6 O 2 (m na e t Lo 6 H 2 O + 6 CO 2+ energy Biomass ‘burned’ to provide energy for maintenance & growth: -synthesis of complex organic molecules -chemical gradients across membranes -motility by flagella or buoyancy control, -production of inorganic parts (frustules, calcite, etc. ). Remaining biomass = net production, i. e. , available for growth & reproduction Pn = P g - R
What Factors Control Primary Productivity in the Sea? • Primary: – Solar radiation (sunlight) – Nutrient concentrations (N, Si, P, Fe) • Secondary: – Turbulence – Grazing – Water turbidity
Other factors that limit primary productivity diatoms • Grazing by zooplankton – Copepods • Turbidity – River input of terrigeneous material. – Limits penetration of sunlight. Zoopl
• Several studies have been done to determine these relationships • Harding et al. (1995) Log 10 [Chlorophyll] = a + b (-Log 10 G) Where : a and b are empirical constants from in situ measurements G = [(R 2)2/(R 1*R 3)] R 1 is radiance at 460 nm R 2 is radiance at 490 nm R 3 is radiance at 520 nm
Using RS to determine suspended sediment • Suspended sediment is most common pollutant (in terms of volume and mass) in surface waters • Metals and insecticides attach to fine sediment particles
Suspended sediment • Increases reflectance from surface waters • Curvilinear relationship between sediment and reflectance/radiance • Ritchie et al. found that wavelengths between 700 -800 nm are most useful for determining suspended sediment
Ritchie and Cooper (1991) • Developed algorithm to determine suspended sediment from Landsat MSS data • Enid Reservoir in North Central Mississippi • Loge. SS(mg/L)=-9. 21 R(1/2)+2. 8 R(1/2)2+9. 4 – SS is suspended sediment in (mg/L) – R(1/2) is the ratio of reflectance in MSS band 1 (0. 5 -0. 6 m) to reflectance in MSS band 2 (0. 6 -0. 7 m) – Similar studies suggest widespread applications for such algorithms
Yang, Merry, and Sykes (1999) • Worked to incorporated RS data into a water quality model (QUAL 2 E) in order to forecast short term water quality conditions • Te-Chi Reservoir in Taiwan • Water quality model within ERDAS Imaging (spatial modeler module) – Extracted water pixels from SPOT image – Converted RS data into water quality variables
Limitations • Often, the spectral and spatial resolution offered by current satellites is not great enough – Example: at broad wavelengths, chlorophyll cannot be distinguished from suspended sediment if sediment load is very high (due to dominance of spectral signature from sediment) • However, newer satellites and sensors offer greater resolution
Conclusions • Many water quality parameters can be measured using remote sensing • New satellites providing high resolution will increase precision of data • Remote sensing may allow for short term forecasting of water quality conditions
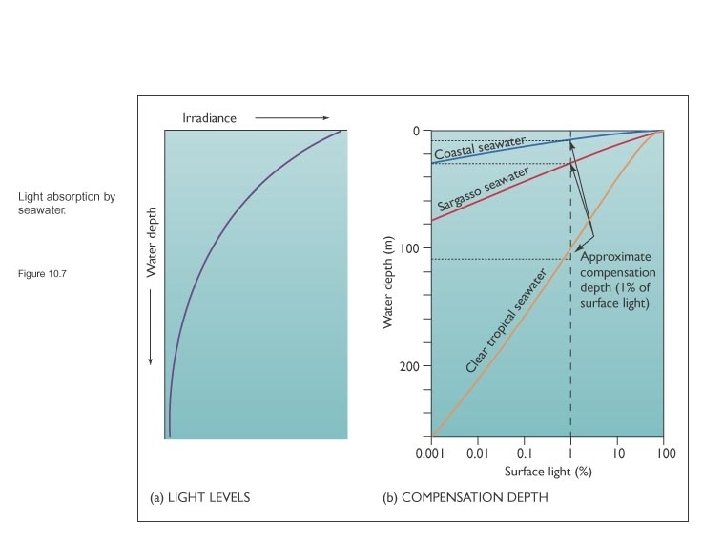
Solar Radiation: Attenuation • Sunlight is rapidly attenuated with depth as it passes through the water column. • Attenuation of light is due to absorption and scattering by various dissolved and particulate substances, including phytoplankton.
THE FATES OF PHOTONS Scattering and absorption by atmospheric particles and aerosols Ocean color Sun Remote sensing reflectance Emergent flux Sea-surface reflection (diffuse, beam) Atmosphere Ocean Absorption by water and DOM Scattering by water, particles and dr/dr Bottom reflection and absorption Bottom Absorption by particles (algae, detritus, colloids, etc. )
Instrument Satellite Spatial Resolution CZCS Nimbus-7 825 m MOS IRS P 3 520 m MOS Priroda 650 m OCTS ADEOS 700 m ﺳﻨﺠﻨﺪﻩ ﻫﺎﻱ ﺭﻧگ آﺐ Sea. Wi. FS Sea. Star 1100 m (Ocean Color Sensors) OCI ROCSAT-1 800 m MODIS EOS AM-1 1000 m GLI ADEOS-2 1000 m MERIS ENVISAT-1 300 m
ENVISAT Satellite MERIS sensor
ﺑﻪ ﻣﻨﻈﻮﺭ ﺗﻘﻮﻳﺖ ﻭ JICA ﻃﺮﺡ ﻧﻬﺎﻳﻲ ﺍﺭﺍﺋﻪ ﺷﺪﻩ ﺗﻮﺳﻂ ، پﺲ ﺍﺯ ﻣﻄﺎﻟﻌﺎﺕ ﺟﺎﻣﻊ ﺑﺨﺶ ﻣﻲ 7 ﺷﺎﻣﻞ ، ﺑﻬﺒﻮﺩ ﻣﺪﻳﺮﻳﺖ ﺯﻳﺴﺖ ﻣﺤﻴﻄﻲ ﺟﻬﺖ ﺣﻔﺎﻇﺖ ﺍﺯ ﺗﺎﻻﺏ ﺍﻧﺰﻟﻲ ﺑﺎﺷﺪ Wetland Ecological Management Plan Watershed Management Plan Wastewater Management Plan Solid Waste Management Plan Environmental Education Plan Environmental Monitoring Plan Institutional Arrangement for the Master Plan