RISK MANAGEMENT MINING INDUSTRY By Hartanto Salim Allen

RISK MANAGEMENT - MINING INDUSTRY By: Hartanto Salim Allen Yeung Desiree Lee

Agenda Mining Industry Overview BHP-Billiton Newmont Teck

Industry Characteristics Capital intensive Sensitive to business cycles Revenues driven by fluctuations in commodity prices and exchange rates Costs associated with exploration, licensing, mine construction, rehabilitation and clean up Operating expenses � Maintenance � Fuel costs � Energy costs � Labour costs

Industry Characteristics Environmental concerns � Noise pollution � Acid mine drainage � Changes in local water balance � Soil erosion � Disruption of animal life Stringent environmental regulations

Mining Terminology Mineral Resource � Inferred Mineral Resource � Indicated Mineral Resource � Measured Mineral Resource Geological Confidence Mineral Reserve � Probable Mineral Reserve � Proven Mineral Reserve Economicall y Mineable

Mining Process 1. Prospecting to locate ore body 2. Deposit evaluation or pre-feasibility activities - Mathematically estimate the extent and grade of the deposit - Evaluate the economically recoverable portion of the deposit 4. Mine planning and feasibility study to evaluate the total project -Mining methods, infrastructure required, location of facilities, impact assessment of facilities 5. Mine construction and operation 6. Mine closure - Reclamation to make a previous mine suitable for future use.

Coal World’s most abundant and widely distributed fossil fuel Used for: Power generation (Thermal Coal) � Steel production (Metallurgical or Coking Coal) � Cement manufacturing � As a liquid fuel � Quality Ranking: High-rank coals are high in carbon and therefore heat value, and have low moisture content. � Low-rank coals have low carbon content but high in hydrogen and oxygen content. �
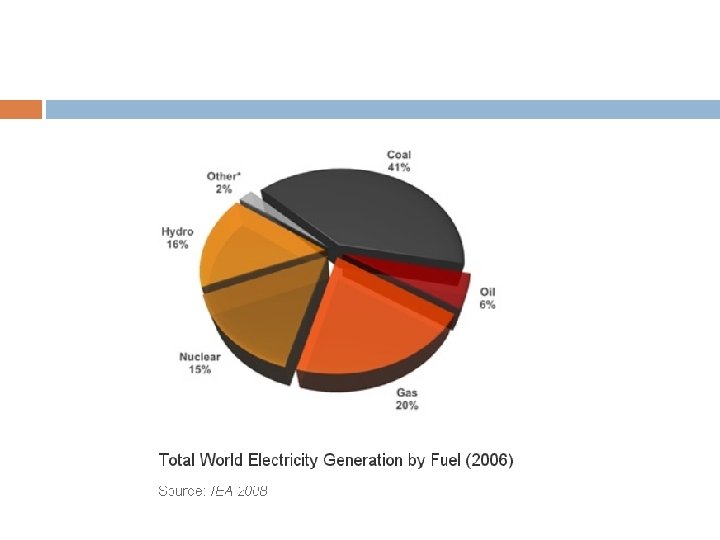

Coal Consumption Worldwide consumption in 2009 � � Around 5. 9 billion tonnes of hard coal Around 909 million tonnes of brown coal Top five coal users are China, USA, India, Japan and South Africa � Accounts for 82% of total global coal usage

Global Consumption and Production

Coal Trade
")
Price Chart (Metallurgical Coal)

Copper Excellent conductor of electricity mostly used in electrical wiring and electronics Resistant to corrosion, high thermal conductivity, durable and flexible � Extensively used in construction industry for piping, plumbing and ventilation • Energy-efficient and infinitely recyclable Traded on established international exchanges � � � New York Mercantile Exchange (COMEX) London Metals Exchange (LME) Shanghai Futures Exchange (SHFE)

Copper Usage

Copper Production

Copper Demand Driven by global industrial activity levels In 2009, global copper consumption exceeded 18 million tonnes but down 1. 3% from 2008 � North America: Demand down 9% � Germany: Demand down 12% � France: Demand down 9% � China: Demand up 42%

Copper Demand
 24")
Zinc 4 th most common metal in use (behind iron, aluminum and copper) 24 th most abundant element in Earth’s crust Commonly mined as a co-product with standard lead Largest exploitable deposits located in Australia, Asia and U. S.

Zinc Usage

Zinc Production

Zinc Demand

BHP company overview World largest diversified natural resource company Listed in Australian Securities Exchange, London Stock Exchange, Johannesburg Stock exchange and BHP plc ADR trade in New York stock exchange Market cap: 165. 6 Billion USD BHP operates 9 businesses: petroleum, aluminum, base metals (copper, silver, lead, zinc, uranium), diamonds, stainless steel materials, iron ore, manganese, metallurgical coal, energy coal

BHP company overview

Risk Factors 1. Fluctuation in commodity price and macro economic factors Ø Ø 2. the policy is sell the goods at prevailing market prices Maintain credit rating “A” as part of strategy Exchange rate fluctuation Ø Ø Sales are dominated in USD Costs in Australian dollar, USD, South African rand, Chilean peso, and Brazilian Real Do not believe that hedging provides long term shareholder value Special circumstances hedge subject to limit by board

Risk Factors Continued Interest Rate Risk Ø Ø Counterparty Default Risk Failure to discover new resource/ maintain and develop new operations Ø Policy: U. S. Floating interest rate basis Uses interest rate swaps, cross currency interest rate swap to convert floating rate into fixed rate Uncertainty in estimating resources Reduction in Chinese demand Ø 56% of iron demand, 36% copper demand, 35% nickel demand, 39% aluminum demand comes from china

Risk Factors Continued Legal / political risks in some countries Ø Mineral Resource Rent Tax in Australia Operational Risk Exposed to increased litigation, compliance cost, unforeseen environmental rehabilitation cost. Ø Natural and operational catastrophe: Risk management maintains self-insurance for property damage and business interruption risk exposure Ø Third party claim may exceed insurance policy that’s in place Ø

Corporate Governance

Corporate Governance continued
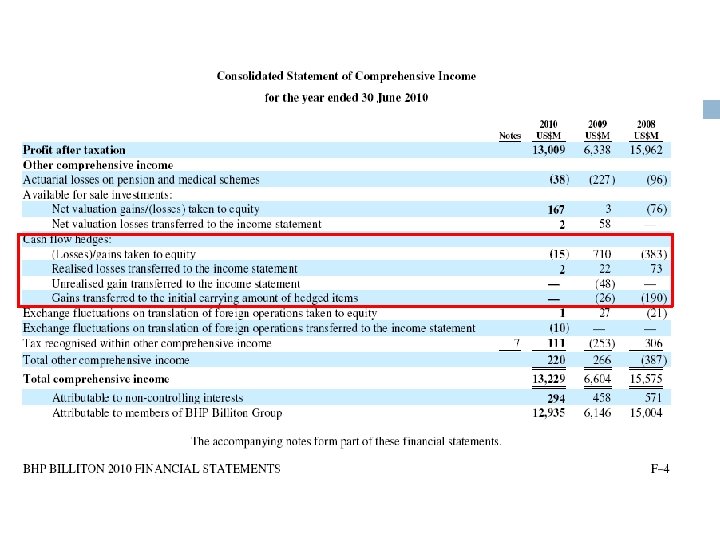

Note 1 Cash flow hedges: Fair value of derivatives designated and qualify for as cash flow hedges in hedging reserves

Other Financial assets
 method,")
Risk management Financial risk management strategy uses cash flow at risk (CFa. R) method, which is defined as worst expected loss to projected business plan cash flow over one year horizon under normal market circumstances at a confidence level of 95% Risk mitigation activity: hedging revenues with financial instrument to mitigate risk; Assess CFa. R against board approved limits Economic hedging of commodity sales, cost and debt Ø Ø Align total group exposure to index target measuring and reporting exposure in customer commodity contracts and issue debt instruments

Risk Management continued Strategic financial transaction Ø Proprietary trading Ø Opportunistic transaction of over/under valued valuation may be executed with financial instrument Undertake trading activities of approved commodity derivatives Interest rate risk Ø Managed as part of portfolio management strategy within the CFa. R limit

Swaps

Currency Risk Currency risks due to financial asset/liabilities in currency other than functional currency of operation

Currency Risk Continued

Commodity Price Risk Contracts for sale, physical delivery are executed on pricing basis to meet a relevant index target

Liquidity risk Uses highly liquid derivative market only Moody investor guide rated A-1 for group’s long term rating (Short term rating P-1) S&P Rating of A+ (Short term rating A-1) No default on loan payable

Credit risk Manage credit risk by group-wide procedures covering approval for credit approvals, granting, and renewal of counterparty limits and daily monitoring of the limit. No significant concentration of credit risk
, also")
Company Profile Incorporated in 1921 Primarily a gold producer (83% of net revenue), also engages in some copper production Owns 91. 8 million equity ounces of proven and probable gold reserves, 9. 1 billion equity ounces of copper reserves Listed on NYSE, Australian and Toronto stock exchanges (NYSE & ASX: NEM; TSX: NMC) Only gold company included in the S&P 500 Index and Fortune 500 Market Capitalization: 30. 12 B USD

Newmont Operations and Major Projects Have operations in US, Canada, Australia, Peru, Indonesia, Ghana, New Zealand Mexico

Financial Highlights In 2009: Revenues of $7. 7 billion Equity gold sales of 5. 3 million ounces Equity copper sales of 226 million pounds Net cash from continuing operations of $2. 9 billion

Hedging Philosophy Follows the strategy of not hedging gold and copper sales to provide shareholders with leverage to changes in gold and copper prices Uses derivatives to manage risk associated with: � � � Commodity input costs Interest rates Foreign currencies

Stock Price vs. Gold Price

Risk Exposures Mineral Exploration and Mining Hazards Environmental Risks Reserve Estimates Licenses and Permits

Risk Exposures Commodity Price Risk Foreign Exchange Risk Interest Rate Risk Derivative Instrument Risk - Credit risk - Market liquidity risk - Mark-to-market risk

Commodity Price Risk Newmont’s revenues, net income and cash flow is highly dependent on the price of gold and copper Metal prices fluctuate due to factors which include: � � � � Gold sales or leasing by government and central banks Forward sales by producers; Demand for jewellery, industrial and investment purposes Speculative trading The relative strength of U. S dollars to other currencies Global production and cost levels Availability of cheaper substitutes

Derivatives for Commodity Price Risk Gold mining companies mainly use: � Forward contracts � Spot deferred contract � Put and call option � Gold lease rate swaps Most prefer to use forward contracts as its hedging instruments since this allows producers to not consider their sales contracts as derivative instruments as long as they are considered to be normal sales Gold mining firms can record the proceeds under this contract as revenue and can be held off balance sheet until maturity

Foreign Exchange Risk Gold and copper sold based primarily on the U. S. dollar price, but operating expenses are incurred in local currencies � Appreciation of local currencies against U. S. dollar increases costs of production in U. S. dollar terms at mines located outside of U. S. The currency that primarily impacts Newmont’s results of operations is the Australian dollar Newmont enters into fixed forward contracts to hedge up to: � 80% of IDR, 85% of A$ and 75% of NZ$ denominated operating expenditures

Foreign Currency Derivatives At Sept. 30, 2010, Newmont had the following foreign currency contracts outstanding:

Diesel Fixed Forward Contracts Newmont hedges up to 66% of its operating cost exposure related to diesel consumed at its Nevada operations to reduce the variability in realized diesel prices At Sept. 30, 2010, Newmont had the following diesel derivative contracts outstanding:

Interest Rate Risk Interest rate swap contracts to hedge against the interest rate risk exposure from bonds, notes, debentures, and other debts At December 31, 2009, Newmont had fixed to floating swap contracts to hedge against its 8. 625% senior notes due 2011 Receives fixed-rate interest payments at 8. 63% and pays floating rate interest amounts based on periodic LIBOR settings plus a spread, ranging from 2. 60% to 7. 63% The purpose is for providing balance to Newmont’s targeted mix of fixed and floating rate debt

Price-Capped Sales Contracts In September 2001, Newmont entered into transactions that closed out certain call options through replacement with a series of forward sales contracts requiring physical delivery of the same quantity of gold over slightly extended future periods Under the terms of the contracts, Newmont will realize the lower of the spot price on the delivery date or the capped price ranging from $381 to $392 per ounce In June 2007, Newmont paid $578 to settle the 1. 85 million ounce price- capped forward sales contracts, reporting a $531 pre-tax loss on the early settlement after a $47 reversal of previously recognized deferred revenue in 2007 55
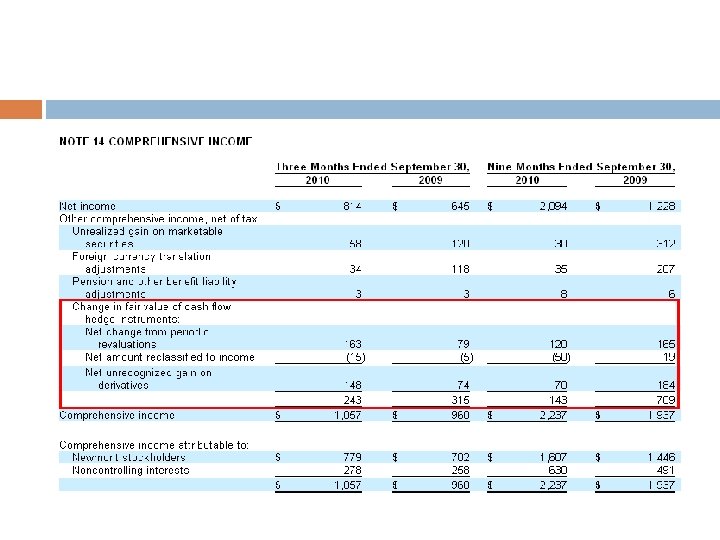

Derivative Instrument Fair Values Newmont had the following derivative instruments designated as hedges with fair values at Sept. 30, 2010 and Dec. 31, 2009


About Teck Canada’s largest diversified mining, mineral processing and metallurgical company Focus on copper, metallurgical coal, zinc and energy 2009 experienced record revenue of 2. 5 B

Area of Operations

Q 3 2010 Report

Q 3 2010 Report

Quarterly Earnings and Cash Flow

Teck’s Risk Exposures Foreign exchange risk Interest rate risk Commodity price risk Credit risk Liquidity risk Risks associated with capital markets Use of derivatives managed by Hedging Committee and Board of Directors

Risk Factors Teck faces inherent risks in mining and metals business. � Environment � Industrial acidents � Geological formations

Risk Factors Fluctuations in market price of base metals, speciality metals and metallurgical coal may significantly adversely affect results of operations � Cyclical prices � Teck’s policy on hedging � Makes exception in certain circumstances

Sensitivity Analysis:

Risk Factors Commodity Price Risk:

Risk Factors Volatility in commodity markets/financial markets may adversely affect ability to operate, as well as their financial condition � Inability to obtain equity

Risk Factors Liquidity Risk: Teck’s liquidity risk arises from general and capital financing needs. The following chart illustrates contractual undiscounted cash flow requirements from liabilities as at December 31, 2009, and is taken from the 2009 Annual Report.

Risk Factors Teck may be adversely affected by currency fluctuations � Enter into limited foreign exchange contracts time to time � Contracts expose Teck to risk of default

Risk Factors Interest rate changes may adversely affect Teck � Interest rate swaps � As at December 31, 2009, with other variables unchanged, a 1% change in the LIBOR rate would have a $36 million effect (2008 - $75 million) on net earnings. There would be no effect on other comprehensive income.

Other Risks Insurance may not provide adequate coverage Subject to potential labour unrest/other labour disturbances as a result of failure of negotiations May not be able to hire enough skilled employees to support operations Ability to acquire properties may be affected by competition from other mining companies Competition in product markets May face restricted access to markets in futures (trade barriers or policies on tariffs) Depletion of mineral reserves may not be offset by future discoveries or acquisitions of mineral reserves Risks associated with issuenace and renewal of environmental permits Changes in environmental, health and safety laws may have adverse effect on operations Teck is highly dependent on third parties for provision of trasportation services (due to geographical locations of mining properties, i. e rail and port services) Aboriginal title claims and rights to consultation and accomodation may affect existing operations as well as development projects and future acquisitions Operations in foreign juristictions face added risks and uncertainties due to different economic, cultural and political environments

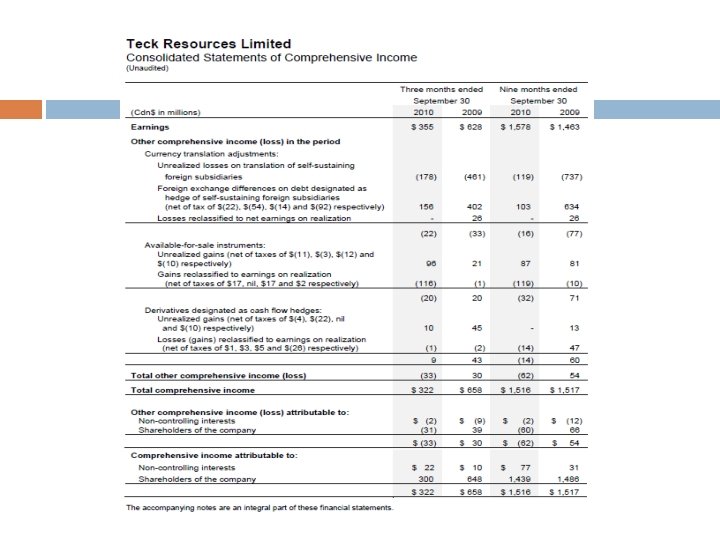
Effect of Derivative Instruments on Statement of Earnings and Comprehensive Income in 2009:

Accounting for Financial Instruments:

Financial Instruments and Derivatives

THANK YOU
- Slides: 78