Risk factors for and impacts of visual impairment


![An ageing world [Nothing] is more likely to shape economic, social, and political developments](https://slidetodoc.com/presentation_image_h2/c152a8849193b3011eb59170948055e6/image-3.jpg "An ageing world [Nothing] is more likely to shape economic, social, and political developments")


 30% 25% Improvement")


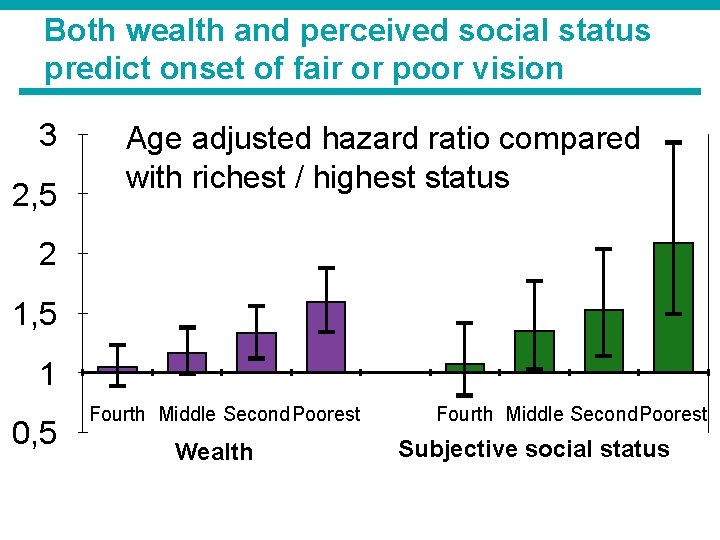
 § The risk of developing visual impairment is strongly related to")
 § However, socioeconomic factors are not related to the likelihood of")
 § Changes in visual acuity, both deterioration and improvement in vision,")
 § These findings demonstrate marked socioeconomic inequalities in risk of impaired")
 § There is, therefore, a clear need for policy to: §")
- Slides: 28
Risk factors for and impacts of visual impairment in older people The role of inequality Presented by: James Nazroo james. nazroo@manchester. ac. uk 1
Researchers James Nazroo, Jennifer Whillans and Katey Matthews Sociology, Cathie Marsh Institute and Manchester Institute for Collaborative Research on Ageing. 2
An ageing world [Nothing] is more likely to shape economic, social, and political developments in the early twenty-first century than the simultaneous aging of Japan, Europe, and the United States… The human life cycle is undergoing unprecedented change. To preserve economic security, we must adapt the social institutions built around it to these new realities. The Commission on Global Aging (1999) 3
The importance of visual impairment • More common in older ages • Rate of sight loss expected to rise dramatically due to ageing UK population There is limited understanding of broader factors related to the incidence and consequences of visual impairment. Identifying those at risk and factors that minimise the impact of visual impairment, has important social and economic implications. 4
Current evidence § Previous work demonstrates that older people with visual impairments have high levels of: § Co-morbidity; § Poverty; § Social exclusion; § Disability; and § Low quality of life. § Most of this work has relied on cross-sectional analyses of associations between risk factors and the prevalence of visual impairment. § Causal mechanisms can be more convincingly identified using longitudinal data.
Core questions 1. How is change in vision patterned by socioeconomic factors (wealth and subjective social status)? a. What factors predict deterioration in vision? b. How are different trajectories of vision change distributed in the population? 6
Core questions 2. Is the uptake of treatment patterned by socio-economic factors? 3. What are the consequences of change in vision on psychological, social and economic wellbeing? 7
The English Longitudinal Study of Ageing § A panel study of people aged 50 and older with six waves of data available. § Sample at wave 1 (2002) was approximately 11, 400 people in private households. § Face to face interview every two years since 2002, with a four yearly biomedical nurse assessment. 8
The English Longitudinal Study of Ageing § Detailed content on: demographics, health, physical and cognitive performance, biomarkers, wellbeing, economics, housing, employment, social relationships, social civic and cultural participation. (www. ifs. org. uk/elsa) 9
Assessment of vision in ELSA § Is your eyesight (using glasses or corrective lenses as usual): § Excellent, § Very good, § Good, § Fair, § or Poor? § (Blind) § Detailed validation of this assessment using The Irish Longitudinal Study of Ageing (TILDA) 10
What predicts deterioration in vision? 11
Fair or poor vision more likely to develop for the poorest 100% Proportion with remaining good vision 90% 80% 70% 60% 50% 0 Richest Fourth 2 4 Years Middle 6 Second 8 Poorest
Can we identify trajectories of vision? And how are they distributed in the population? 15
Trajectories of visual acuity and their distribution Improvement from good 10% Deterioration from excellent 8% Deterioration from good Deterioration followed by improvement 6% Stable excellent or very good 30% 7% Poor and deteriorating 4% Stable fair (fluctuation) 5% Stable good (fluctuation) 30%
Poorer people are much more likely to have sub-optimal compared with optimal vision 40% 35% Stable excellent or very good 30% 25% Stable good (fluctuation) 20% 15% Stable fair (fluctuation) 10% 5% 0% Richest Fourth Middle Second Poorest 17
Poorer people are more likely to have poor and deteriorating vision 35% 30% Stable good (fluctuation) 25% 20% Poor and deteriorationg 15% Deteriorating from good 10% Deteriorating from excellent 5% 0% Richest Fourth Middle Second Poorest 18
Improvements in vision are unrelated to wealth 35% Stable good (fluctuation) 30% 25% Improvement from good 20% 15% Deterioration followed by improvement 10% 5% 0% Richest Fourth Middle Second Poorest 19
What predicts uptake of treatment – cataract surgery? 20
Age and vision predict cataract surgery, socioeconomic factors do not 3 2, 5 2 1, 5 1 0, 5 60 -69 70 -79 Age 80+ Fair Poor Visual acuity Has private insurance
What are the consequences of change in vision? 22
Deterioration of vision impacts on wellbeing, social participation and income 40% Proportionate change in score Partially adjusted 30% Fully adjusted 20% 10% 0% Depression Fall in quality Low social Fall in income of life engagement 23
Concluding comments (1) § The risk of developing visual impairment is strongly related to socioeconomic factors (wealth and subjective social status). § Socioeconomic inequalities are also present for trajectories of visual acuity. Decreasing levels of wealth and lower subjective social status were associated with a decreased probability of having an optimal vision trajectory and increased probability of having a suboptimal trajectory. 24
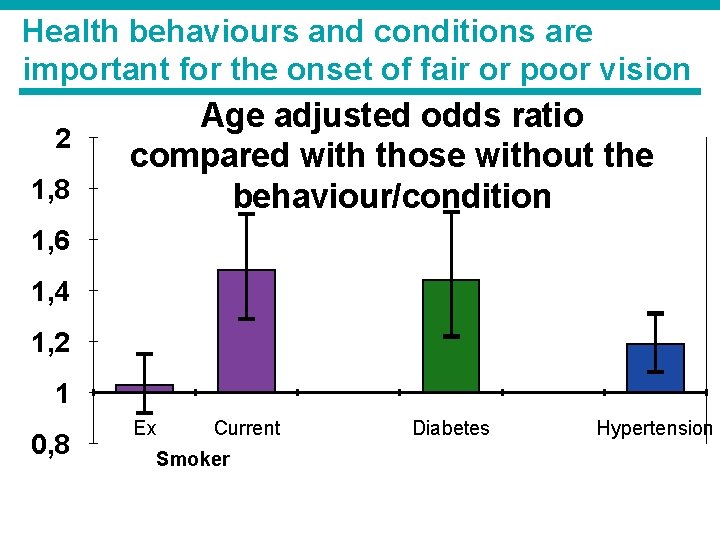
Concluding comments (2) § However, socioeconomic factors are not related to the likelihood of having surgery for those with cataracts. An NHS effect? § Health related factors – smoking, diabetes and hypertension – were also all related to increased risk of onset of visual impairment. 25
Concluding comments (3) § Changes in visual acuity, both deterioration and improvement in vision, were related to changes in levels of psychological wellbeing (depression and quality of life), social engagement and income over a two year period. § Stronger associations with these outcomes were present for deteriorations in vision than improvements in vision. 26
Concluding comments (4) § These findings demonstrate marked socioeconomic inequalities in risk of impaired vision and strong evidence on the relationship between change in vision and psychological, social and economic wellbeing. 27
Concluding comments (5) § There is, therefore, a clear need for policy to: § Minimise socioeconomic risks for deterioration in visual acuity; § Ensure equitable access to treatment, including easy and free access to corrective lenses, and § Mitigate the negative effects of visual impairment. 28