Risk and Return Selected Realised Returns Average Return


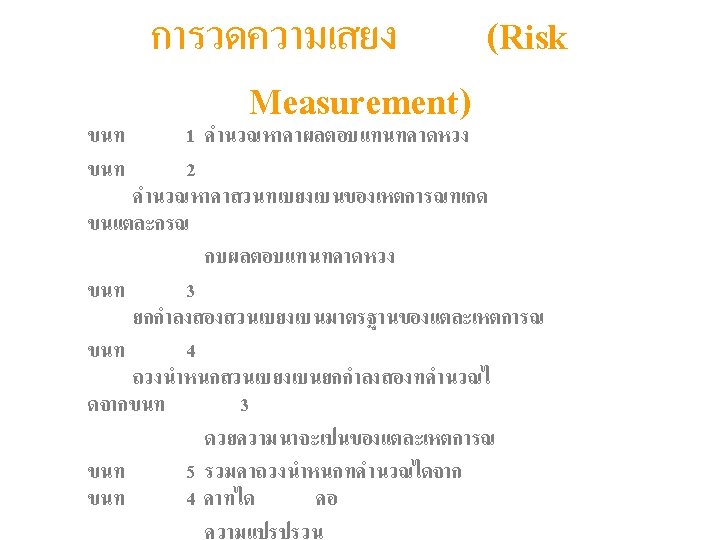


 Project 2")

 Project 2")


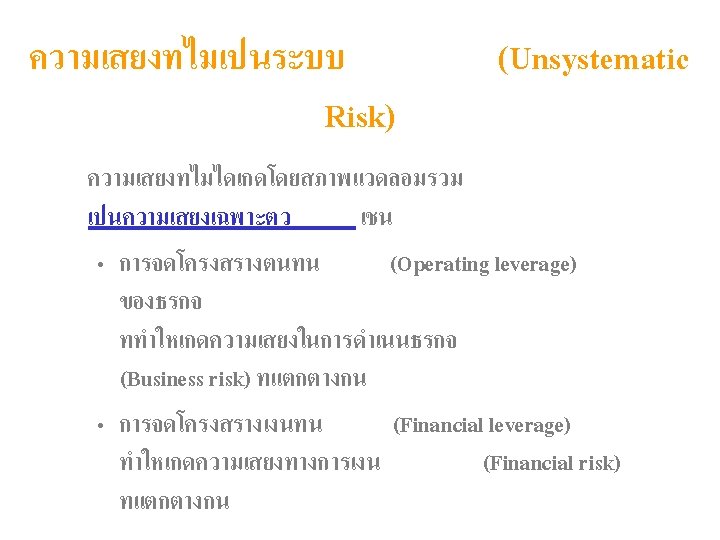
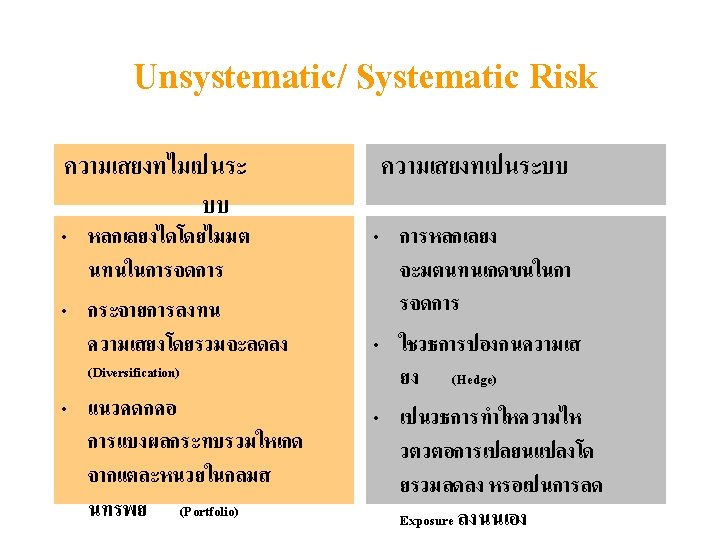
 Unsystematic / Diversiable / Firm-specific risk Total risk")
- Slides: 51
Risk and Return
Selected Realised Returns Average Return Standard Deviation หนสามญขอบรษทขนาดเลก 17. 3% 33. 2% หนสามญขอบรษทขนาดใหญ 12. 7 20. 2 หนกระยะยาวของบรษท 6. 1 8. 6 หนกระยะยาวของรฐบาล 5. 7 9. 4 ตวเงนคลง 3. 9 3. 2 Source: Based on Stocks, Bonds, Bills, and Inflation: (Valuation Edition) 2002 Yearbook (Chicago: Ibbotson Associates, 2002), 28.
Risk and a single investment Consider 2 possible investments: 1. Investment in Treasury bill which is a government security that mature in 90 days and promise to pay an annual of 6% 2. Investment in the stock of local company which the estimate of the annual returns will be Probability of Occurrence 10 % 20% 40% 20% 10% Rate of Return on Investment -10% 5% 15% 25% 40%
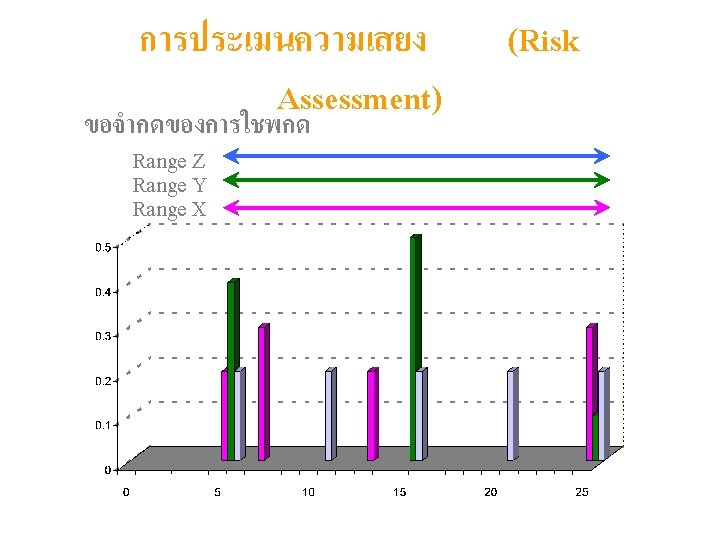
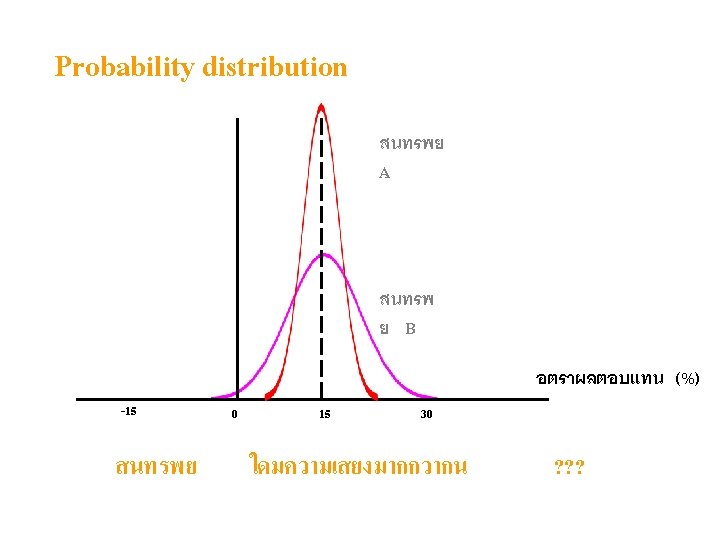
Risk and a single investment 1. 0 Treasury bill Stock of local company 0. 5 0. 4 0. 3 0. 2 0. 1 -10% 5% 15% 25% 40%
Measuring Risk Probability of Occurrence 10 % 20% 40% 20% 10% Rate of Return on Investment -10% 5% 15% 25% 40% return : k = (. 10)(-10%) + (. 20)(5%) + (. 40)(15%) + (. 10)(40%) = 15 % 1/2 risk : SD = ( -10% - 15%)2(. 10) + ( 5% - 15%)2(. 20) = 12. 85% + ( 15% - 15%)2(. 40) + ( 25% - 15%)2(. 20) + ( 40% - 15%)2(. 10)
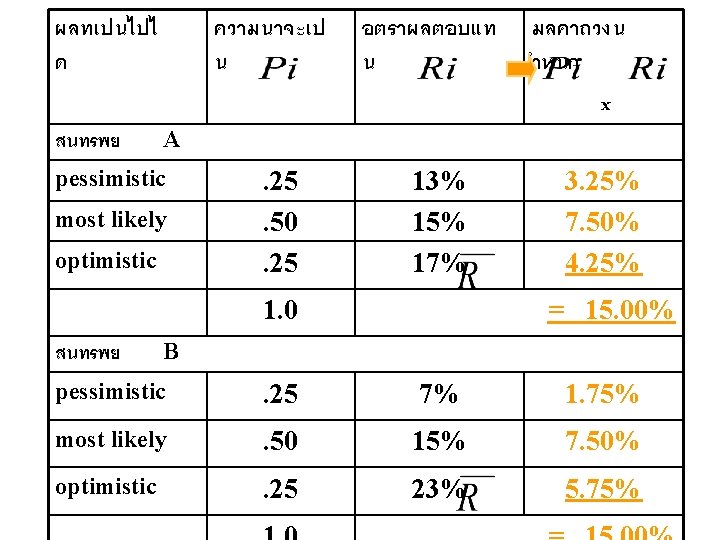
Ex. Risk Averse plc. Which project to invest ? Project 1 Project 2 Project 3 Project 4 Project 5 Return Probability of return occurring 16 20 -16 36 48 -8 16 24 -40 0 100 1. 0 0. 25 0. 50 0. 25 0. 10 0. 60 0. 30
Risk Averse plc Return x Prob Project 1 Project 2 Project 3 16 x 1. 0 20 x 1. 0 - 16 x 0. 25 = - 4 36 x 0. 50 = 18 48 x 0. 25 = 12 - 8 x 0. 25 = -2 16 x 0. 50 = 8 24 x 0. 25 = 6 -40 x 0. 10 = -4 0 x 0. 60 = 0 100 x 0. 30 = 30 Project 4 Project 5 Expected Returns 16 20 26 12 26
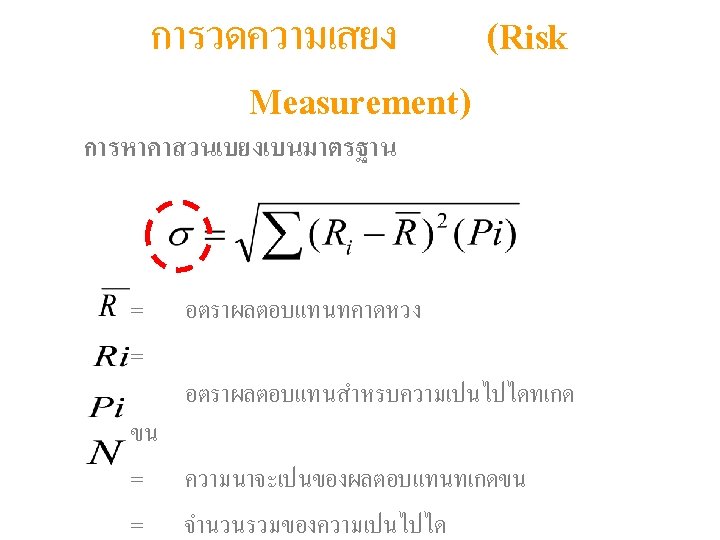
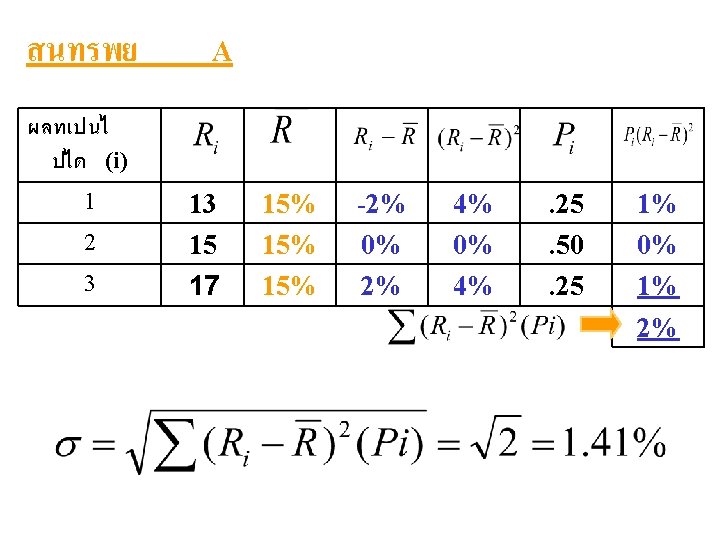
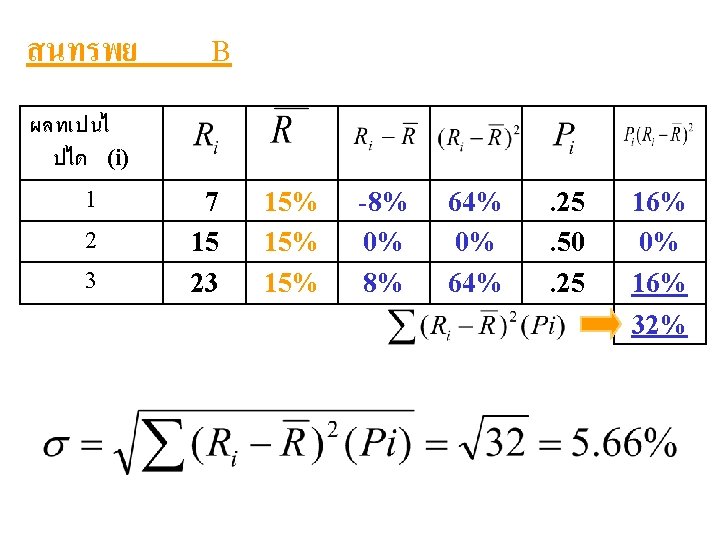
from question Project 1 Project 2 Project 3 1 2 3 4 5 return probability expected return deviation 2 x prob sum Ri Pi R 16 20 -16 36 48 1. 00 0. 25 0. 50 0. 25 16 20 26 26 26 Ri-R (Ri-R)2 Pi ∑(Ri-R)2 Pi 0 0 - 42 10 22 0 0 1764 100 484 0 0 441 50 121 0 0 612 SD = 24. 7 Project 4 -8 16 24 0. 25 0. 50 0. 25 12 12 12 -20 4 12 400 16 144 100 8 36 144 SD = 12 Project 5 - 40 0 100 0. 10 0. 60 0. 30 26 26 26 -66 -26 74 4356 676 5476 436 406 1643 2485 SD = 49. 8
Risk Averse plc: Expected Return & Standard Deviation expected return standard deviation Project 1 Project 2 Project 3 Project 4 Project 5 16 20 26 12 26 0 0 24. 7 12 49. 8
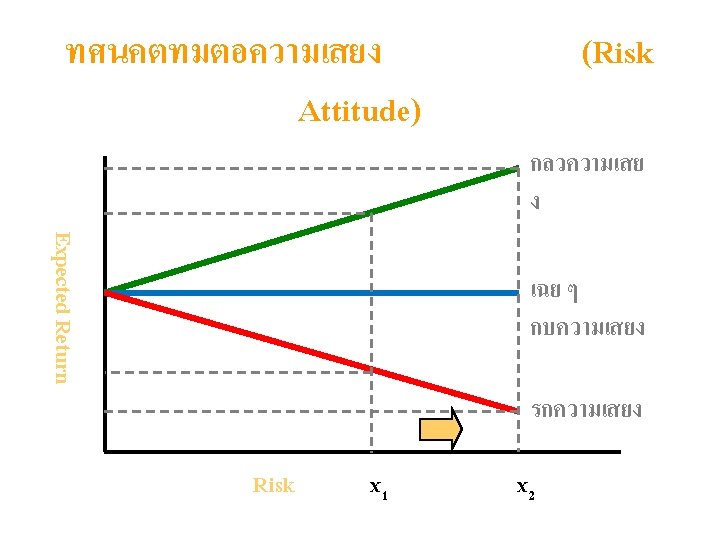
Make a decision which project would be selected ? Expected Return (%) Project 2 Project 1 Project 3 Project 4 Standard deviation (Risk) Project 5
Make a decision which line would be selected ? I 1 or I 2 ? And why ? I 3 or I 4 ? Expected Return (%) I 1 I 2 I 3 I 4 Standard deviation (Risk)
Make a decision which project would be selected ? Expected Return (%) Project 2 Project 1 Project 3 Project 4 Standard deviation (Risk) Project 5
Unsystematic/ Systematic Risk Standard deviation (risk) Unsystematic / Diversiable / Firm-specific risk Total risk Systematic / Undiversiable / Market-related risk 10 20 Number of stocks in portfolio