Revolution Evolution and Decline Michigan K12 School Finance


 • SAF provides nearly all state K-12 funding. • Designated")
($ Real")

 formula – Local voters select")


 1994 -95 $4, 200 $5, 000")

 • 20%")


- Slides: 42
Revolution, Evolution, and Decline: Michigan K-12 School Finance Since Proposal A of 1994 School Funding Workshop State Board of Education Lansing February 17, 2010 Michael Addonizio, Wayne State University
Constitution of Michigan of 1963 Article VIII – Education • Sec. 1 – Religion, morality and knowledge being necessary to good government and the happiness of mankind, schools and the means of education shall forever be encouraged. • Sec. 2 – The legislature shall maintain and support a system of free public elementary and secondary schools as defined by law. Every school district shall provide for the education of its pupils without discrimination as to religion, creed, race, color or national origin.
State Policy Choices: Revenues • The “Big 3”: – Property tax – Sales tax – Income tax Other Sources: • Business taxes • Excise taxes (e. g. , tobacco, alcohol, etc. ) • Lotteries
Constitution of Michigan of 1963 Article IX – Finance and Taxation • Sec 3 …A law that increases the statutory limits in effect as of Feb. 1, 1994 on the maximum amount of ad valorem property taxes that may be levied for school district operating purposes requires the approval of ¾ of the members elected to and serving in the Senate and in the House of Representatives. • Sec. 7 - No income tax graduated as to rate or base shall be imposed by the state or any of its subdivisions.
FY 2008 -09 School Revenue Local; 20. 7% Federal; 9. 3% State GF/GP; 0. 2% State Restricted State GF/GP Federal Local State Restrict. 69. 8%
FY 2009 -10 School Revenue
Federal Revenue • • No Child Left Behind = $753. 0 million Special Education = $424. 7 million Free and Reduced Lunch = $332. 5 million Other Federal Revenue = $51. 8 million
Local Operating Revenue • 18 Mills Non-Homestead = $2, 189. 8 million • Special Education Mills = $1, 045. 4 million • Vocational Education Mills = $203. 7 million • ISD Operating Mills = $62. 8 million
School Aid Fund (SAF) • SAF provides nearly all state K-12 funding. • Designated taxes earmarked for deposit into SAF for school operations. • MI Constitution requires that SAF be used exclusively for schools, higher education, and school employee retirement benefits. • SAF received approximately $11. 4 billion for FY 2008 -09.
FY 2008 -09 SAF Revenue Other (e. g. , liquor, casinos, etc. )($ Real Estate Transfer Tax in$238 millions) $144 Tobacco Tax $415 Use Tax $423 Lottery Profits $700 MI Business Tax $729 Income Tax $1, 990 State Education Property Tax $2, 010 Sales Tax $4, 720
SAF Revenue History
State Policy Choices: Distribution • Guaranteed Tax Base (GTB) formula – Local voters select tax rate and spending level – State guarantees a minimum per pupil revenue yield per mill of tax effort • Foundation Formula State sets tax and spending level
Michigan K-12 Finance, circa 1993, GTB • Local Property Tax Covers 2/3 of Operating Revenues • 122 Districts within 4 Mills of Constitutional Limit • Rich Schools, Poor Schools • Onaway with $3, 277 PP @ 22. 66 mills • Ypsilanti with $5, 919 PP @ 43. 68 mills • Bloomfield Hills w/ $10, 358 @ 24. 41 mills
Proposal A Goals • • • Reduce, but not eliminate per pupil gaps Reduce & limit property tax for operations Reduce local share of operations costs Increase state funds and state share Provide greater stability in funding
Foundation Growth, 1993 -94 Pre-A Foundation Base through 2008 -09
Foundation Levels Year Minimum Basic Maximum (hold harmless) 1994 -95 $4, 200 $5, 000 $6, 500 1995 -96 4, 506 5, 153 6, 653 1996 -97 4, 816 5, 308 6, 808 1997 -98 5, 124 5, 462 6, 962 1998 -99 5, 170 5, 462 6, 962 1999 -00 5, 700 7, 2000 -01 6, 000 7, 500 2001 -02 6, 500 8, 000 2002 -03 6, 626 8, 126 2003 -04 6, 626 8, 126 2004 -05 6, 700 8, 2005 -06 6, 875 8, 375 2006 -07 7, 085 8, 585 2007 -08 7, 204 8, 704 2008 -09 7, 316 8, 816
Per-Pupil Foundation Levels 10000 9000 8000 7000 6000 5000 4000 3000 2000 1000 0 Minimum Basic Maximum (hold harmless) 1994 -951995 -961996 -971997 -981998 -991999 -002000 -012001 -022002 -032003 -042004 -052005 -062006 -072007 -082008 -09
School Aid FY 2009 -10 • $165 reduction in foundation ($263 million) • 20% cut in ISD operations aid ($16. 3 million) • $32. 8 million reduction in categorical aid • Governor vetoed Sec. 20 J payments, reducing aid to 39 districts by $51. 5 million • Additional $127 foundation cut withdrawn, along with $8. 8 million cut in ISD aid
State K-12 Membership History
K-12 Membership History, updated
State and Local Revenue for School Operations, 1978 -79 through 2007 -08
Measuring A’s Success • • • Clear reduction in per pupil gaps Property taxes clearly reduced & limited Major change in state / local share Clear shift to state financing Revenue stability has suffered for many districts
Improved Finances for Many Traditional Districts thru FY 04 • Significant and dramatic increases in fund balances for most traditional districts • Sources a combination of foundation increases, pension re-financing, “Durant” settlement, enrollment growth and district management practices • Increases now eroding for many districts
Total Fund Balance as Percent of Current Operating Expenditures – Traditional Districts and Public School Academies
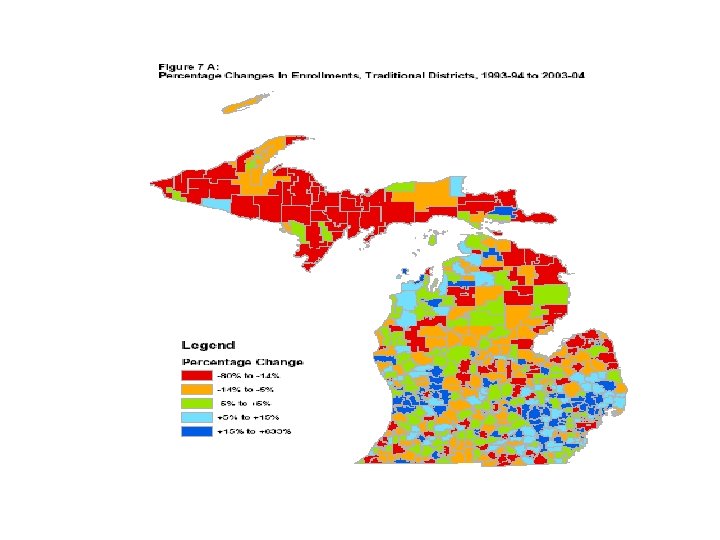
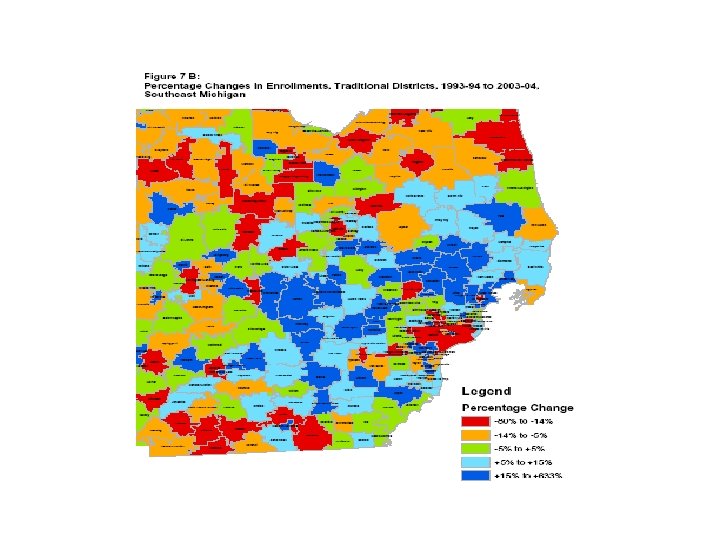
Enrollment Patterns Have Become a Critical Finance Issue • Growing enrollment usually results in good fiscal health • Declining enrollment often results in fiscal problems • Majority of districts and pupils now in decline status • Very, very few districts are steady growers
Enrollment Patterns, cont. • Declining enrollment not just an urban issue • Significant declines in rural and small city /towns/older suburbs • 80% of all traditional districts now face declining enrollments
Property Taxes Limited • The assessment cap critical • Also limitations on local school options for operations – Only two ISDs with “enhancement” mills – Very few enhancement elections held • Overall limitation from ¾ vote requirement to change millage limits
From Equity to Adequacy • After years of unexpectedly large foundation increases, years of flat to reduced foundations • Did over-optimism of late 90’s create unrealistic expectations? • Enactment of numerous tax exemptions that reduced growth potential of SAF • Replacement funds, largely tobacco taxes, are long-term decliners • Total revenue declines with enrollment
Challenges • Capital funding • Declining enrollment from population decline and shifts • Impact of charters and choice on traditional district enrollment • Tax policy and erosion in the revenue base • Impacts of personnel and fringe costsproductivity gap
Capital Funding for K-12 • Proposal A made up-front decision to NOT attempt capital funding reform • Assumption that dramatic cut in property taxes would make it easier for some districts to obtain financing until such time as a solution could be developed • Data on increased bonding and debt millages clearly indicates that happened • Now the next challenge
The Challenge of Declining Enrollment • Declining enrollment-in a traditional district or a charter school-virtually guarantees financial difficulty-very quickly • It’s much harder to manage down than to manage growth • Strong consideration needs to be given to change pupil count to a one year lag
Tax Policy Changes Impact SAF Revenues • Legislation did hold SAF harmless from recent income tax rate cuts (by pushing burden completely on GFGP) • Legislation has not held SAF harmless from dozens of base exemptions and other changes that have added up to hundreds of millions of reduced income • SAF does not have the same tax base it had in 1994
U. S. and Michigan Unemployment Rates, 2000 - 2009
History of Michigan Jobs
History of Deficit Districts
MPSERS School Contribution Rates FY 1995 -96 through FY 2008 -09 20 18 16 14 12 10 8 Pension Rate Health Rate 6 4 2 0 19951996199719981999200020012002200320042005200620072008 -96 -97 -98 -99 -00 -01 -02 -03 -04 -05 -06 -07 -08 -09
MPSERS Costs per Pupil, FY 1998 -99 through FY 2007 -08
New Challenges • Increasing mandatory school attendance age from 16 to 18 • Universal, high-quality early education • Importance of non-school human services • Rational tax policy: – Fairness – Stability – Efficiency – Adequacy