Revision Session Nothing to fear everything to gain

")


, there was a 12 mark question")

 2) 3) Number of marks available Number and content of bullet points Specific")


- Slides: 22
Revision Session
Nothing to fear, everything to gain Aim for a level four answer (top marks) Straight forward if you approach it correctly This is your chance to be a STAR Simple: clear, consistent, ‘tight’ and academic Testable: IV and DV, other measurements operationalised? Achievable: will the aims be achieved with this design? Realistic: Can this actually be done/ethics?
Experimental: Lab & Field Natural & Quasi Non‐Experimental: Observation Correlation Questionnaire/Interview Case Study Content Analysis
Hold up a green card for A and a red card for B IV = experimenter / environment = controlled A = Laboratory B = Quasi IV = naturally occurring / environment = natural A = Field B = Natural IV = Naturally occurring / environment = controlled A = Natural B = Quasi IV = experimenter / environment = natural A = Natural B = Field
Hold up a green card for A and a red card for B Participants respond verbally to questions A = interview B = correlation Co‐variables are measured to find an association A = questionnaire B = correlation A detailed analysis of one unique person or small group A = case study B = content analysis Coding items of interest in a transcript of an interview, or diary and tallying each time they occur? A = thematic analysis B = Content analysis
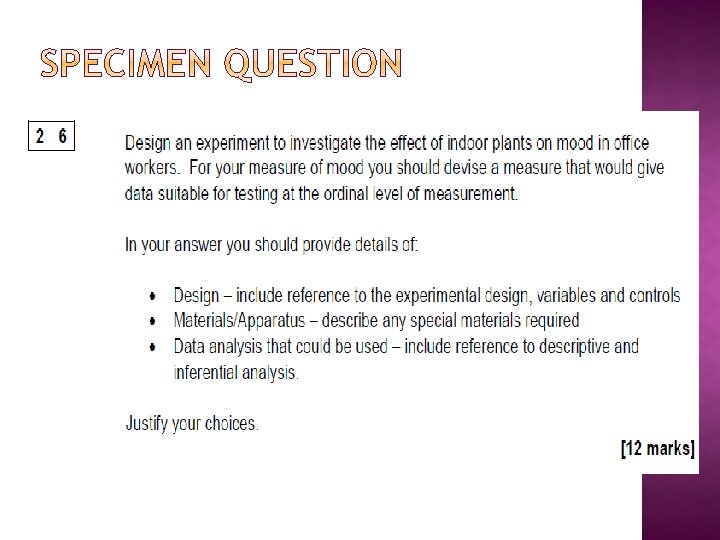
One exam so far (2017), there was a 12 mark question
� Examiners’ report showed the main problem in weaker answers: � lacked detail/explanations. Behavioural categories were generally poor operationalisation was rarely evident. Time/event sampling was often stated but for their use was absent or muddled. Confusion was often evident, particularly in relation to time sampling (often mistakenly presented as how long a behaviour lasted). Reliability was often covered well with detailed descriptions of inter‐ rater reliability given. However, test‐retest was frequently suggested inappropriately as a way of assessing reliability and students confused the purpose of assessing reliability with ensuring reliability. Unfortunately, students frequently focussed on additional material, such as ethical issues, sampling of participants, etc, at the expense of covering all the bulleted requirements successfully. some students designed a complete study and a few wrote a whole report, including abstracts, statistical analysis, etc. However, these did not receive credit. � � �
1) 2) 3) Number of marks available Number and content of bullet points Specific instructions in the stem (text) or elsewhere
Have you noticed what all the best answers have in common? They have all planned their answers in the box provided
Des: repeated measures – avoid natural diffs in mood between conds NB: remember to justify! IV: mood assessed before plants then again a week after plants DV: score on a questionnaire ‘happiness’ rating on likert scale 1 -10 (1 least happy) Controlled: office temp/heating. Noise levels Materials: question sheet for rating scale 1 – not happy and 10 very happy. Q “please rate how happy you have felt at work this week” good decision about plants Data: ordinal = mode median and range. SD useful even on ordinal data here. Graph = scatter graph simple bar chart of medians, Descriptive stats = Wilcoxon (repeated, difference, ordinal)
� Use the subheadings in your answer. The AQA examiners advise this and like it when marking � Only stick to the bullet points � Split it in your mind so it seems like a number of three mark questions � Keep referring to your plan. Don’t worry if after more thought, you tweak it. � Remember realistic) STAR (simple, testable, achievable,
Hold up a green card for A and a red card for B 2/3 Design: I would use an independent groups design because if there is suddenly a change in the environment (the plants arrive), whilst psychologists have been in the office testing mood before and after, this would be a demand characteristic and the participants may report being happier as a result. The IV would be the office environment and the DV would be a rating scale of happiness. I would control for temperature of the office because if it is too hot, people may be unhappy. Design: A repeated measures design should be used. Mood is so variable between people that such participant variable must be removed to infer cause and effect. The IV would be the office environment without plants and then without plants, whilst the DV would be operationalised as participants rating from 1‐ 10 on the question “In general, how happy have you been at work this week? ” 1 would indicate very unhappy whilst 10 would indicate very happy. This would create data at an ordinal level A number of environmental controls would include keeping the office temperature comfortable and constant over the duration of the study, and controlling any noise pollution that may occur. If these differ across the conditions, they may cause changes in mood, and 3/3 cause and effect cannot be inferred.
Hold up a green card for A and a red card for B 3/3 Materials/Apparatus: Participants would receive a consent form to sign, indicating their rights in the study. They would then be presented with a question sheet asking “In general, how happy have you been at work this week? ” With a scale between 1 to 10. On the scale, there would be indications about what the marks mean, for example, 1 = very unhappy, 5 = neither happy nor unhappy, 10 = very happy. This simple measurement will produce ordinal data, and is straight forward for the participants to understand. The plants should be pleasant but understated, as to not be obvious to the study or over bearing in the working environment. Materials/Apparatus: Find at least three things wrong with the paragraph below Pens and paper are required, I would choose philodrendrons as they are common indoor plants and make sure they are watered daily and kept out of direct sunlight. This would make them wilt and might make the environment worse for the workers, confounding the DV. I would then give the participants a questionnaire on a daily basis, and statistically analyse any changes in behaviour that occurred each day. I would have a chart and I would tally these changes. I would need a calculator, clip board, and computer to record the data. 1/3
Hold up a green card for A and a red card for B 3/3 Data Analysis: In relation to descriptive statistics, the median and range of participants’ mood rating is appropriate due to the data being ordinal. Each of the medians from the ‘before plants’ and ‘after plants’ conditions could be displayed in a bar chart, with the higher median score indicating in which condition participants felt happier. The range would indicate the extent of the variation in mood scores in each condition, useful to gauge whether some individuals were affected more than others by the plants. Find at least three things wrong with the paragraph below Data analysis: In relation to descriptive statisitcs, the mean and standard deviation of the participants’ mood rating is appropriate due to the data being interval. Each of the means from the ‘before plants’ and ‘after plants’ conditions could be displayed in a histogram, with the higher mean score indicating in which condition participants felt happier. The standard deviation would indicate the extent of the variation in mood scores in each condition, useful to gauge whether some individuals were affected more than others by the plants 1/3
Hold up a green card for A and a red card for B 1/3 Data Analysis: In relation to inferential statistics, the experimenter would chose a sign test. This is because the data can be treated as nominal, is a repeated measures design and is a test of difference. There is no indication of whether this is a replication, so the critical value would be chosen as 2‐tailed with a p ≤ 0. 05. Find at least three things wrong with the paragraph above Data analysis: In relation to inferential statistics, the experimenter would chose a Wilcoxon test. This is because the data can be treated as ordinal, is a repeated measures design and is a test of difference. There is no indication of whether this is a replication, so the critical value would be chosen as 2‐tailed with a p ≤ 0. 05. 3/3
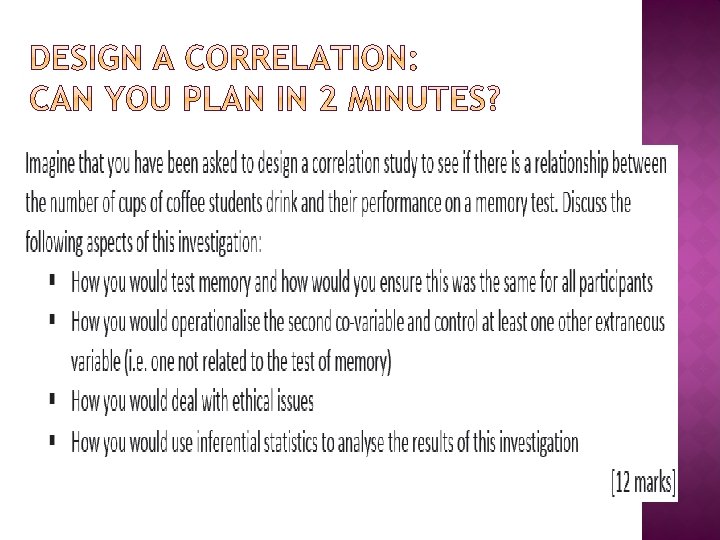
I would give all the participants 20 words to learn. These would be presented on a computer screen at a rate of one word every second. The participants would then be given five mental arithmetic problems to solve (also using the computer). Once they complete this, I would give each participant three minutes to recall as many of the 20 words as they can, in any order. All of the participants would be given the same words, the same standardised instructions and the same distractor task, to ensure that none of these variables could affect performance.
�I would ask each participant how many cups of coffee containing caffeine they had drunk in the last 24 hours. I would also make sure that they did not count cups of decaffeinated coffee as this might not have the same effect on memory. I would also need to ensure that participants had not taken caffeine in any other form during the last 24 hours (e. g. energy drinks or painkillers containing caffeine, etc. ).
� My participants would be 18‐year‐old students in a sixth form college and therefore they would be able to provide informed consent. As I approach potential participants I would explain that the study is examining the relationship between memory and caffeine consumption, which would involve learning a list of words. Providing the participants with this information would allow them to provide fully informed consent. I would also explain that their data would remain confidential and that they would have the right to withdraw at any time. Once I have collected the information on the number of cups of coffee they had drunk, and the participants had completed the memory test, I would thank them and debrief them by explaining the aims of the research in more detail. If they were unhappy with anything about the study I would allow them to withdraw their data. I would also ask if they had any questions.
I would use a Spearman’s Rho to analyse the results because the data is at least ordinal and the study is looking for a correlation between memory and the number of cups of coffee drunk. The test would provide the correlation coefficient which would tell us the strength and the direction of the relationship, with the sign informing me of the direction of the correlation, and the value between 0 and 1 indicating the strength. For example, if the correlation was +0. 8, this would indicate a strong positive correlation. To judge significance, this would be compared with critical values at p≤ 0. 05
A educational psychologist was assigned to assess the progress of a 12 year old child. She had been adopted by British parents after she had spent her first 5 years in a Romanian orphanage. Design a case study investigating the child’s progress. Discuss the following aspects of the investigation. Justify your choices � Methods to collect data � Techniques to analyse the data � Ethical issues and ways to deal with them (9 marks)