Revision 2 Revision Remembering work on speed time

Revision 2
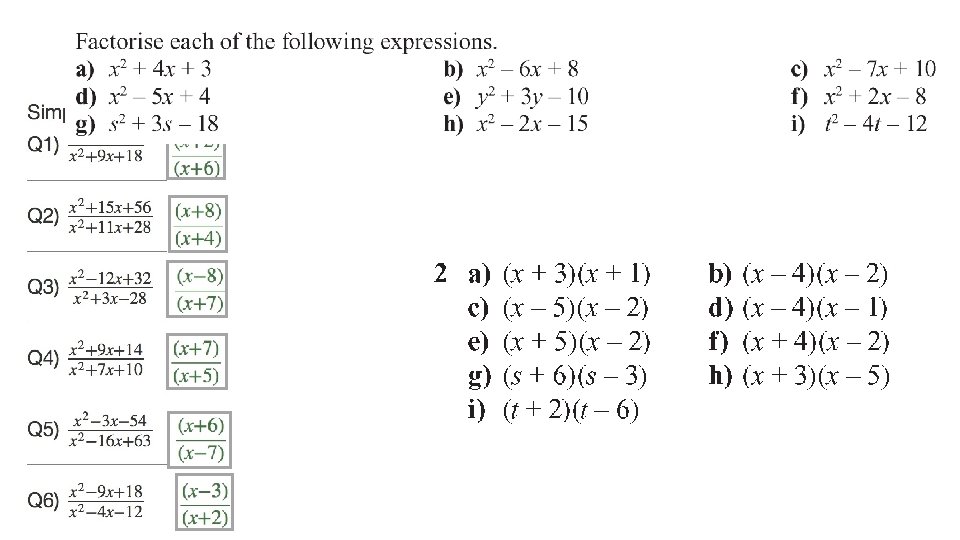

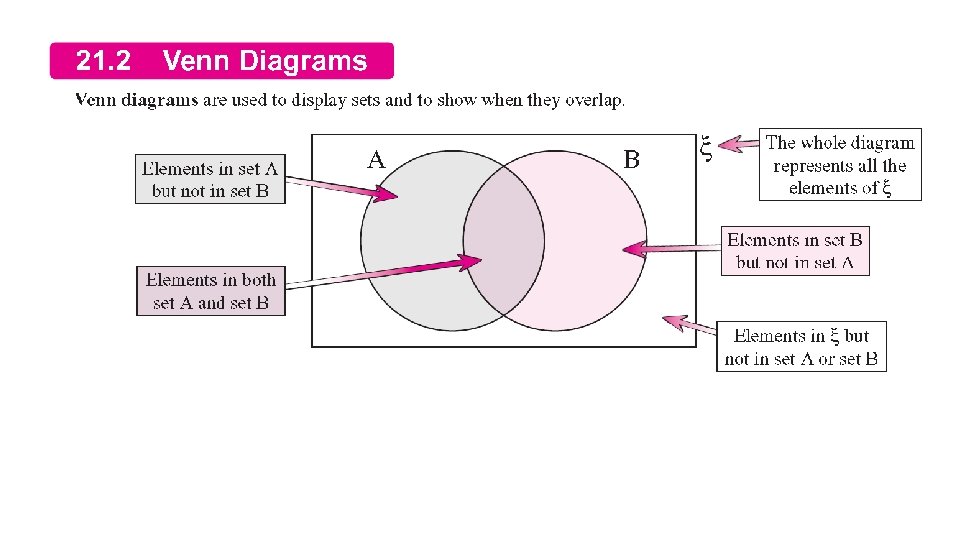
Revision Remembering work on speed time graphs Annotate these diagrams with the best words Speed-time graphs Distance—time graphs A train changes speed as shown in the speed—time graph. acceleration Constant Speed total distance decelerating Resting speed Going back to the start

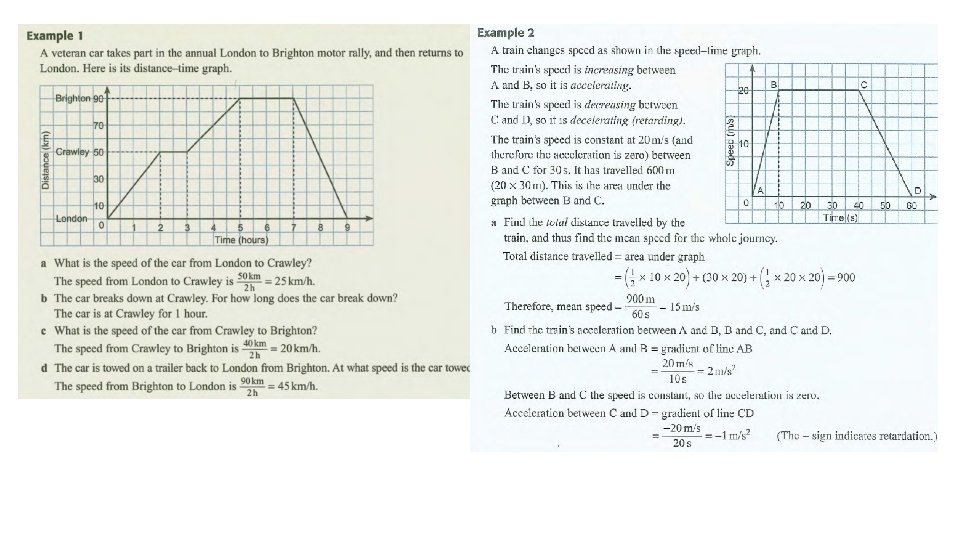
Answer the questions for each graph Distance—time graphs a What is the speed of the car from London to Crawley? b The car breaks down at Crawley. For how long does the car break down? c What is the speed of the car from Crawley to Brighton? d The car is towed on a trailer back to London from Brighton. At what speed is the car towed? Speed-time graphs A train changes speed as shown in the speed—time graph. a Find the total distance travelled by the train, and thus find the mean speed for the whole journey. b Find the train's acceleration between A and B, B and C, and C and D.

Revision of Tree Diagrams – Probability Flash back

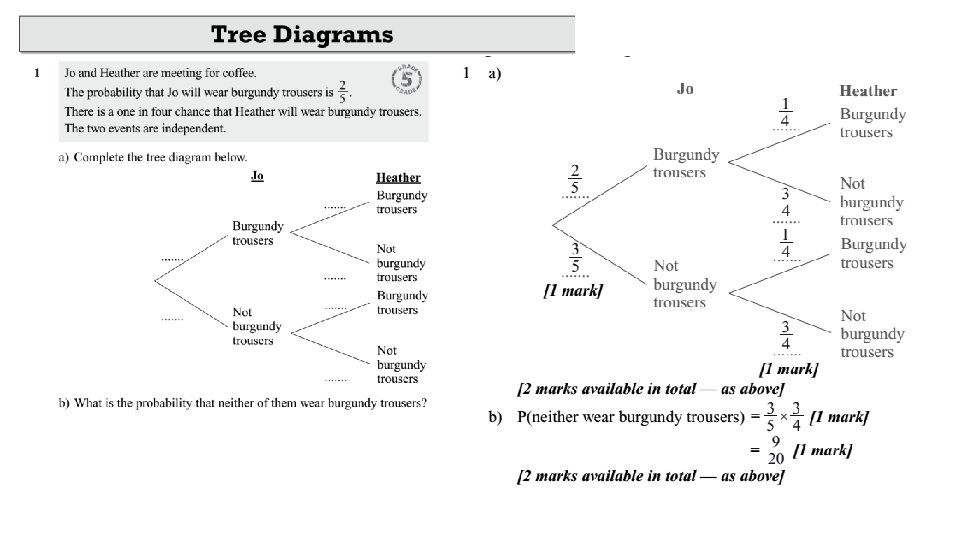
Remember this Tree Diagrams A vending machine offers tea or coffee; with or without sugar; and with or without milk. Use a tree diagram to show the variety of drinks on offer Decision 1 Decision 2 Decision 3

Peter has ten coloured cubes in a bag. Three of the cubes are red and 7 are blue. He removes a cube at random from the bag and notes the colour before replacing it. He then chooses a second cube at random. Record the information in a tree diagram. First Choice Second Choice red blue red Independent blue

Going along the branches you multiply First Choice Second Choice + + + + + d o w n red blue The probabilities for each event are shown along the arm of each branch and they sum to 1. blue Ends of first and second level branches show the different outcomes. Probabilities are multiplied along each arm. Characteristics
 Question 3 Peter and Becky run a race")
Q 3 Sports Probability (Tree Diagrams) Question 3 Peter and Becky run a race and play a tennis match. The probability that Peter wins the race is 0. 4. The probability that Becky wins the tennis is 0. 7. (a) Complete the tree diagram below. (b) Use your tree diagram to calculate (i) the probability that Peter wins both events. (ii) The probability that Becky loses the race but wins at tennis. Tennis 0. 3 Race 0. 4 Peter Win 0. 7 0. 3 0. 6 Becky Win 0. 7 P(Win and Win) for Peter = 0. 12 Peter Win 0. 4 x 0. 3 = 0. 12 Becky Win 0. 4 x 0. 7 = 0. 28 Peter Win 0. 6 x 0. 3 = 0. 18 Becky Win 0. 6 x 0. 7 = 0. 42 P(Lose and Win) for Becky = 0. 28

Thinking about the concept of dependents events

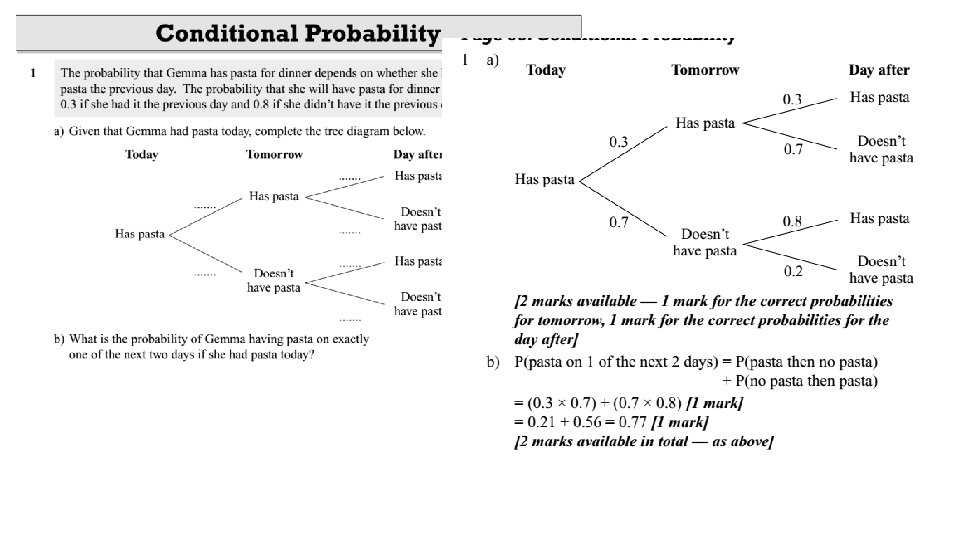
Peter has ten coloured cubes in a bag. Dependent Events Three of the cubes are red and seven are blue. He removes a cube at random from the bag and notes the colour but does not replace it. He then chooses a second cube at random. Record the information in a tree diagram. What is the probability of a) RR b) RB c) BR rr bbbbbbb First Choice rrr bbbbbbb Second Choice red blue rrr bbbbbb red blue Dependent blue d) BB

New questions to work on – they are difficult – you need to read the questions carefully !

Draw a tree diagram – it is hard to keep track of the answers

Draw a tree diagram – it is hard to keep track of the answers
 (i) x = 8 (ii) 32 b) (i)")
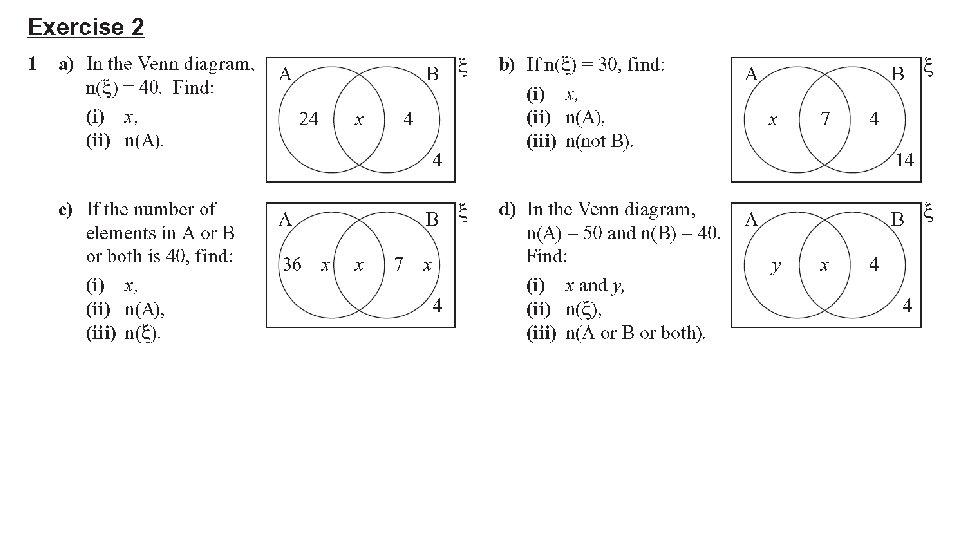
Page 185 Exercise 2 1 a) (i) x = 8 (ii) 32 b) (i) x = 5 (ii) 12 (iii) 19 c) (i) x = 3 (ii) 36 (iii) 44 d) (i) x = 36, y = 14 (ii) 58 (iii) 54
- Slides: 21