Review Why and How is PED useful PED

 • Therefore ………. . total revenue is at its maximum when price is")

 When incomes are $1000, the demand for strawberries is 500 kilos")
 measures the responsiveness of")


 • YED is also a measure for the development of the economy (Macroeconomic")

 – The historical experience of both more and less developed nations show that")
 • Cross-price elasticity of demand (XED)")


 • 2. Complements and Degree of Complementarity • When")


 – It is a vital measure to consider merger and acquisition (M&A) of")
 is a measure of")


")


 capacity of firms: if firms have unused capacity")
:")
 usually")


- Slides: 41
Review: Why and How is PED useful? • PED on pricing decisions and total revenue – When the demand is in the elastic portion of the D curve, an increase in price causes a …………. in total revenue – When the demand is in the inelastic portion of the D curve, an increase in price causes a …………in total revenue – And when the demand is unit elastic, then a change in price…………………. .
(continued) • Therefore ………. . total revenue is at its maximum when price is at the point where PED =1 • BUT be careful this should NOT be confused with maximizing profit (total revenue – total cost) as it is possible that as TR increases so as the TC at a faster rate • We will elaborate on this more when we study about the firms
Elasticities of Non-Price Determinants • non-price determinants of demand cause a shift in the demand curve • What we now want to ask is by “how much” the demand curve will shift or what is the “responsiveness” of demand, given the change in non-price determinants • And this shall complete the tools (concepts) to fully conduct D and S analysis of various market scenarios/cases as shown in the real world • Page 6 of H/O Different Types of Elasticity
Calculations • 1) When incomes are $1000, the demand for strawberries is 500 kilos per day. When incomes are $1200, the demand for strawberries is 502 kilos per day. • What is the YED for strawberries? • Is demand income-elastic or income-inelastic? • 2) When incomes rise by 5%, the demand for new cars rises by 8% and the demand for second hand cars falls by 1%. • What is the YED for new cars? • What is the YED for second-hand cars? (Group III)
Income Elasticity of Demand • Income elasticity of demand (YED) measures the responsiveness of demand to changes in income (involving a shift of the demand curve). It gives information on direction of change of demand given a change in income (increase or decrease) and on size of the change • Demand is income-elastic if, after a change in income, the change in demand is proportionately greater than the change in income (compare “price-elastic demand”)
The Formula for Income Elasticity of Demand • NOTICE: YED has the same basic form as the formula for PED.
2 Key Types/Cases of YED • 1. Inferior Goods • A negative YED (YED < 0) indicates an inferior good. When the income increases, the demand for the inferior good decreases (demand curve shifts left). The demand income change in opposite directions. e. g. bus rides, second hand clothes, second hand used cars, etc • 2. Normal Goods • A positive YED (YED > 0) indicates a normal good. When the income increases, so does the demand (demand curve shifts right). The demand income change in the same direction. • e. g. most goods are normal goods such as i. Phone 6, new Nike shoes, new car, etc… • Within NORMAL goods, there are two types…………………
Good Demand when Income = $100 Proportion of Income Spent on good Demand when Proportion of Income = $110 Income Spent on good A $20 $21 B $30 $33 C $50 $60 YED If the good is INFERIOR, what happens to the proportion of income spent on a good as incomes rise?
Two Types of Normal Goods: Necessities usually have a YED that is positive but less than 1 (0 < YED <1). Demand is income inelastic, where a percentage increase in income produces a smaller percentage increase in quantity demanded e. g. food, water, clothes, shelter, medication, etc. – as income increases the proportion of income spent on these goods becomes ……………. – EXAMPLE: The YED for food is estimated to be around 0. 15 to 0. 20 in the OECD nations. • This means that a 1% increase in income produces 0. 15 to 0. 2% increase in spending on food • Luxuries are usually goods that have a YED that is positive and greater than 1 (YED > 1) e. g. travel, private education, eating in nice restaurants, etc. • as income increases the proportion of income spent on these goods becomes ……………. .
!Point of Caution! • What is a “necessity” or what is a “luxury” depends on income levels. Many estimates of YED are for the OECD nations (Organization of Economic Cooperative and Development). These OECD nations are the clan of the 30 plus richest nations in the world. (www. oecd. org) • For people or nations with extremely low income levels (less developed countries) food and clothes may be luxuries and not necessities ‒ e. g. while YED for food is about 0. 15 to 0. 20 in developed or OECD nations, it is estimated to be about 0. 80 in poor nations. If you are more interested, try visiting www. worldbank. org, www. ilo. org, www. imf. org ‒ Therefore the necessity/luxury classification is not fixed or reliable
To Graphically Summarize…as incomes rise • There is a relatively smaller rightward shift for necessities than luxuries for an increase in income
How is the YED useful in the real world? – YED is a vital measure in signalling market opportunity and the rate of expansion of industries for producers • e. g. over time, as countries experience economic growth, people’s incomes increase demand changes • The higher the YED for a good or service, the greater the expansion of its market is likely to be in the future. • This is why companies are always looking at the GDP estimates and forecasts when they decide on expanding their operations overseas e. g. Uniqlo eyeing South East Asia such as Vietnam, Indonesia, etc. • But if the economy experiences a recession, (a fall in national income) goods with YED > 1 are the hardest hit while necessities are less hit and demand for inferior goods increases
(continued) • YED is also a measure for the development of the economy (Macroeconomic concept) – The previous point regarding industries generalizes to the entire “macro” economy – Every economy has 3 main sectors: primary (agriculture), manufacturing, and services (banking, insurance) and with economic growth, the relative sizes of the three sectors usually change over time and this can be explained with YED • YED for primary sector is 0 < YED < 1 while for some manufacturing and services it is YED >1. This is because as incomes rise, demand gets more sophisticated and consumers demand more high-tech goods etc. They can also save and invest more and finance the development of the manufacturing and service sectors.
Three types of production • Primary goods are available from cultivating raw materials without a manufacturing process. They are raw materials that are “extracted” from the land or ocean. – e. g. oil, water, fish, fruit, crops, wood • Manufactures (secondary goods) are the production of merchandise using labor and machines, tools, chemical and biological processing or formulation. Manufactured goods are goods that have been processed – e. g. aircraft, household appliances or automobiles • Services (tertiary goods) are intangible products. Services are actions that someone does for you. – e. g. accounting, banking, cleaning, consultancy, education, insurance, expertise, medical treatment, or transportation
(continued) – The historical experience of both more and less developed nations show that with economic growth, the primary sector becomes less and less important and gets replaced by manufacturing and services. – In the developed world today, industries experiencing the fastest growth are often in the service sector including technology and communications, financial services, health care and medical research, etc. – Note: the falling share of the primary sector does not mean its output is falling. It only shows that it is increasing more slowly than the total output (GDP)
Introducing the Cross Price Elasticity of Demand (XED) • Cross-price elasticity of demand (XED) measures the responsiveness of demand for one good to a change in the price of another good, (involving a demand curve shift ). • It shows whether demand increases or decreases and the size of the shift • two key cases/types: – How changes in the price of substitutes and complements affect demand…
Calculation • When the price of good M is $4, the quantity demanded of good N is 100 units. When the price of good M falls to $3, the quantity demanded of good N is 80 units. • 1) Calculate the cross-price elasticity of demand between M and N • 2) Are M and N more likely to be skis and snowboards or skis and poles? • Note: When calculating XED, we do so by measuring changes in purchases of a good, hence in “quantity demanded” but with the understanding that this involves a shift to a new demand curve
The Formula for Cross-Price Elasticity of Demand •
Interpretation of XED formula – 1. The sign of XED: unlike PED, whose minus sign is ignored through taking the absolute value, XED is either positive or negative and the sign is very important for its interpretation. • eg When two goods are substitutes, the cross-price elasticity of demand for two goods is … POSITIVE (XED >0) • (The demand for one good and the price of the other good change in the same direction: when the price of one increases, the demand for the other also increases (shifts right)) – 2. The value of XED: the absolute value of the XED will demonstrate the extent of the “shift” in demand i. e. the degree of substitutability or complementarity.
Example • So if the price of Coca-Cola increases, the quantity demanded of Coca-Cola decreases and the demand for Pepsi increases as consumers switch to Pepsi, resulting in a shift of the demand curve to the right for Pepsi • A study by Gasmi et al. (1992) “Econometric analysis of collusive behavior in a soft-drink market” estimated that the XED of Coca-Cola and Pepsi is about “+0. 7” ‒ This means that a 1% increase in the price of one leads to a 0. 7% increase in the demand for the other or 10% increase in the price of one leads to a 7% increase in the demand for the other. This is considered fairly high substitutability.
Graphically…
Key Types/Cases of XED (continued) • 2. Complements and Degree of Complementarity • When two goods are complements, the cross-price elasticity of demand for two goods is ……………NEGATIVE • (XED < 0). • The demand for one good and the price of the other good change in the opposite directions: when the price of one increases, the demand for the other falls (shifts to left) and vice versa • e. g. i. Phone 6 and …………… ; DVDs and…………. ; tennis rackets and……………… etc. – e. g. demand for complements with XED = -0. 8 will shift ? RIGHT (MORE) than for complements with XED = -0. 2 if the price of one of the goods decreases
Graphically… • *Note/correction*: it is the horizontal shift distance!
Finally, the XED = 0 or Unrelated, Independent Goods • Substitutes and Complements are the two key cases for the use of XED but in real life, majority of the goods are unrelated or independent of each other e. g. potatoes and ………………. • In such cases, XED = 0 or close to 0 as a change in the price of one is unlikely to affect the demand for the other
Why is XED useful in the real world? – It is a vital measure to help a business’s (firm’s) pricing decisions and strategies to maximize profits • E. g. substitutes produced by single firm e. g. Coca Cola also produces Sprite. Increase in sales through changing prices can come at the expense of the sales of the other • E. g. substitutes produced by two or rival firms e. g. Coca Cola and Pepsi • E. g. if complements are produced by different firms, they have an incentive to collaborate (or engage in joint ventures) like Expedia with hotels and airlines; sports clothes and equipment; car parts and car companies; etc.
(continued) – It is a vital measure to consider merger and acquisition (M&A) of companies in the financial markets i. e. companies with very similar products might be interested to merge to eliminate competition (but government might interfere and establish Competition and Corporate Law) – e. g. Starbucks buying Boulangerie Patisserie; Facebook buying Instagram; – M&A often leads to big profits and market share. . Also allow synergies of production, cutting cost, etc.
Price Elasticity of Supply • Price elasticity of supply (PES) is a measure of the responsiveness of the quantity of a good supplied to changes in its price. • (PES is calculated along the supply curve) • It is the same principle as PED and the formula follows the same general form as well…
Price Elasticity of Supply
Example • Suppose the price of strawberries increases from $3 per kg to $3. 50 per kg and for this change in price the quantity supplied increases from 1000 to 1100 tones per season. Then the PES is calculated as follows. • Strictly, the answer should be 0. 6 (it was rounded too early) • This finding implies that for a 10% increase in the price of strawberries, quantity supplied increases by 6% (vice versa). • Page 7 of H/O
Range of values and special cases • Price Elasticity of Supply also ranges in value from zero to infinity. • And because of the positive relationship between P and Qs, PES is always………………. . POSITIVE • Supply is unit elastic when PED = 1 meaning the % change in Qs is equal to the % change in P. • Supply is perfectly inelastic when PED = 0 meaning the % change in Qs is zero and it does not change no matter what % the P changes. • e. g. agricultural products such as season’s entire harvest of fresh produce/vegetables; the supply of Picasso paintings, seats in a sports stadium • Supply is perfectly elastic when PED = infinity meaning the % change in Qs is infinite for a given % change in P. When there is change in price, this results in an infinitely large response in the quantity supplied (eg global supply of cars)
PES Graphs (Group VI)
Comparison of Entire Supply Curves
Important Technical Points and Caveats • Just like in the case of demand, – 1. Only when the two supply curves intersect, is it possible to make comparisons of PES of the entire curve by references to the steepness of the curve… the flatter the supply curve, the more elastic it is at any given price – 2. PES also varies along upward sloping straight line supply curves. Comparison of PES should be done only at a specific price or price range. Constant PES across entire supply curves are found only for those that go through the origin (unit elasticity) and perfectly elastic (infinite) and inelastic (zero) supply curves
Determinants of PES • Spare (unused) capacity of firms: if firms have unused capacity or resources (e. g. factories and machines) it is relatively easy and less COSTLY for a firm to respond with increase in output to a change in price. The greater the spare capacity, the more elastic. But if capacity is TIGHT, then supply is less elastic • Length of time: the amount of time firms have to adjust their inputs and resources to alter the quantity supplied in response to changes in price – Very short time – unable to respond, inelastic – As time increases – slightly elastic e. g. hire more workers – In a very long time – highly elastic e. g. can hire both labor and invest in new machines
Determinants of PES • Mobility and availability of factors of production (inputs and resources): if the firms can shift the resources easily and speedily between different products, the greater the PES. • If inputs (eg raw materials) are available extra cost of increasing supply is less • Ability to store stocks: some firms can save and store production and not sell it right away (if the goods are durable). The more stock firms have, the more elastic supply is to changes in prices
Real life example • For the reasons described above, primary commodities (agricultural goods) usually have a ………………. . PES than manufactured goods – Long time period need to respond (change output) to changes in price e. g. farmers have long planting season (eg cocoa trees take SEVEN years from planting to yielding fruit) – Limited and immobile resources e. g. land for cultivating crops – Long time need to apply or innovate new technologies to increase the output per land area e. g. new machines, new irrigation systems, etc.
Short run and long run PES estimates for selected agricultural commodities
Therefore combining the demand supply elasticities……… • Price elasticity of supply for primary products is inelastic with relatively steep slope, but there are supply shocks • If we combine this with price inelastic demand, then this leads to… • High price volatility! – High price fluctuations in prices • But as prices change, so do the revenue/income of the primary product producers • An increase in supply with inelastic demand will lead to …………………. in revenue of producers • For primary producers: they face volatility and instability. But food is a NECESSITY for people around the world, - may need……………. • UN World Food Program (WFP), UN Food and Agriculture Organization (FAO) try to provide more stability
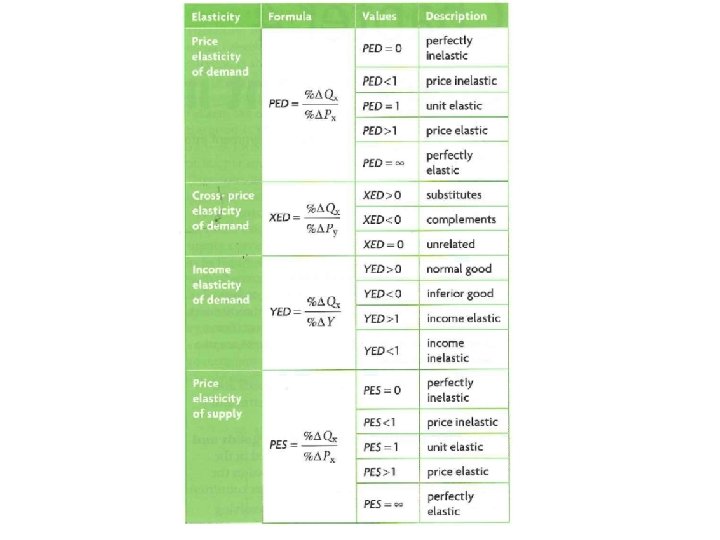
Elasticities: summary • To enhance the precision of demand supply analysis, use the concept of elasticities, which quantify the extent of the shift of D and S or the movements along the curves • 4 types were introduced – Price Elasticity of Demand – Income Elasticity of Demand – Cross-Price Elasticity of Demand – Price Elasticity of Supply
General Hints and Points on Elasticities • Make sure to interpret it correctly. The use of percentage change! For 1% change in xx the other changes by XX% • The same general form and equation – % change in QUANTITY divided by % change in P, P of other goods, income • The range of values and the types of goods and outcomes • Its determinants • And WHY they are useful in real life: Important real life application of these measures e. g. business price strategy and how to maximize profits, implications in primary goods market, and economic development • - use to analyse the effects of indirect taxes and subsidies