Review CENTRAL LIMIT THEOREM 1 STAT 206 Chapter


 – interval containing the")

(Std Error) **A 95% confidence")
 • Suppose confidence level = 95% • Also written")


 ways to reduce the width of a confidence")


 • Contemplating switch from")


 •")
 Upper Tail Area df . 10")


- Slides: 40
Review: CENTRAL LIMIT THEOREM! • 1
STAT 206: Chapter 8 Confidence Interval Estimation 3
Ideas in Chapter 8 • 4
Confidence Intervals – General discussion • 5
So… What is a Confidence Interval? • Confidence Interval (CI) – interval containing the “most believable” values for a parameter • Confidence level – probability that this method produces an interval that contains (covers) the parameter • Confidence level is usually close to 1. 00 (most commonly 0. 95 or 95%, but depends on criticality of the decision) • Margin of Error – measures how accurate the point estimate is likely to be • Multiple of the standard deviation (e. g. 1. 96 * std dev) • Confidence Interval is constructed by taking a point estimate and adding and subtracting the margin of error (that is, critical z-score times the standard error)
Lower Confidence Limit Point Estimate Width of confidence interval Upper Confidence Limit • That is, CI = point estimate ± (Critical Value)(Std Error) • Where: • Point Estimate is the sample statistic estimating the population parameter of interest • Critical Value is a table value based on the sampling distribution of the point estimate and the desired confidence level • Standard Error is the standard deviation of the point estimate • How confident are we that the interval covers the unknown population parameter? • Some percentage (less than 100%) • 95% confident (probably most common), 99%, 90% • Desired level of confidence defines the “critical value” or z-score • But that means, we are NEVER sure… 7
Understanding Confidence Intervals CI = point estimate ± (Critical Value)(Std Error) **A 95% confidence interval is formed under the knowledge: • 95% of all the possible intervals based on every possible sample from the population • Would cover the parameter and the other 5% would miss Figure 21. 4 Twenty-five samples from the same population give these 95% confidence intervals. In the long run, 95% of all such intervals cover the true population proportion, marked by the vertical line. (Statistics: Concepts and Controversies (8 th Edition), by Moore and Notz, W. H. Freeman and Company, 2013 p. 495 )
Confidence Level, (1 - ) • Suppose confidence level = 95% • Also written (1 - ) = 0. 95, (so = 0. 05) • A relative frequency interpretation: • 95% of all the confidence intervals that can be constructed will contain the unknown true parameter • A specific interval either will contain or will not contain the true parameter • No probability involved in a specific interval Pearson slides (Chapter 8, slides 14&18) Confidence Level 80% 95% 98% 99. 9% Confidence Coefficient, 0. 80 0. 95 0. 98 0. 998 0. 999 Zα/2 value 1. 28 1. 645 1. 96 2. 33 2. 58 3. 08 3. 27
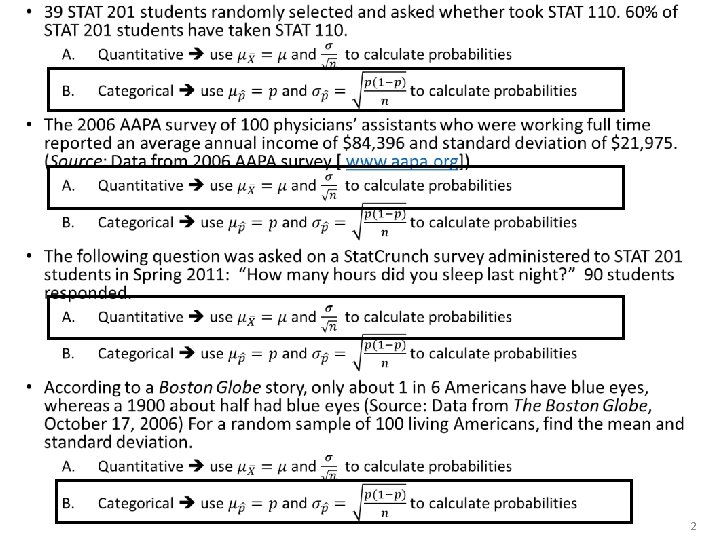
Central Limit Theorem: Proportions AND Means RULE: If many samples or repetitions of the SAME SIZE are taken, the frequency curve made from STATISTICS from the SAMPLES will be approximately normally distributed • •
• Margin of Error Standard Error or Standard Deviation of the Sampling Distribution • What affects the margin of error? • The level of confidence which determines the value of z • the standard error which is a function of sample size • How can we achieve a narrower confidence interval? 1. Decrease the level of confidence OR 2. Increase the sample size
Question: • What are two (2) ways to reduce the width of a confidence interval? A. B. C. D. Larger sample size and higher level of confidence Smaller sample size and lower level of confidence Larger sample size and lower level of confidence Unable to determine without seeing the data 12
Question: Two different researchers measured the weight of two separate samples of ruby-throated hummingbirds from the same population. Each calculated a 95% confidence interval for the mean weight of these birds. (Source: _http: //www. biology. ucsd. edu/labs/rifkin/courses/bieb 100/win 2012/Practice. Problem. Collection/ Normal. Inference. Practice. Problems_ch 11. pdf ) • Researcher 1 found the 95% CI to be (3. 12 g , 3. 48 g), while • Researcher 2 found the 95% CI to be (3. 05 g , 3. 62 g). If we assume similar means and sample standard deviations, which of the researchers probably had the larger sample? A. Researcher 1 CI interval width = upper limit – lower limit B. Researcher 2 Width 1 = 3. 48 – 3. 12 = 0. 36 Width 2 = 3. 62 – 3. 05 = 0. 57 Larger sample Narrower CI Research 1 probably had the larger sample. 13
• Interpretation: We are x% confident that the true <statistic> <description of problem> is between a and b. • Confidence interval interpretations talk about PARAMETERS • Although the true population values (i. e. , parameters) may or may not be in the calculated interval, x% of intervals formed in an appropriate manner will contain the true value. HOWEVER, (100 – x)% percent will NOT contain the true value a mistake due to chance. 14
Example 1: • A random sample of 100 people shows that 25 are left-handed. Form a 95% confidence interval for the true proportion of left-handers • 95% CI = 0. 25 ± 1. 96(0. 0433) = 0. 25 ± 0. 0849 = (0. 1651 , 0. 3349) Interpretation: We are 95% confident that the true proportion of people in the population who are left-handed is between 0. 1651 and 0. 3349. _OR_ • 95% confidence z = 1. 96 We are 95% confident that the true percentage of left-handers in the population is between 16. 51% and 33. 49%. Although the interval from 0. 1651 to 0. 3349 may or may not contain the true proportion, 95% of intervals formed from samples of size 100 in this manner will cover the true value.
Example 2: A planning committee needs to estimate the percentage of students at a large university who will attend an upcoming event so that they can determine an appropriate location for the event. 80 students are randomly selected, and 15 say that they will come to the event. • What is a 95% confidence interval for the proportion of all the university’s students who will attend the event? Interpret the interval. Is the confidence interval a valid method for this problem? 90% confidence z = 1. 645 90% CI = 0. 1875 ± 1. 645(0. 0436) = 0. 1875 ± 0. 071722 = (0. 115778, 0. 259222) 99% confidence z = 2. 58 99% CI = 0. 1875 ± 2. 58(0. 0436) = 0. 1875 ± 0. 112488 = (0. 075012 , 0. 299988) . 05 . 10 . 15 . 20 . 25 . 30 . 35
Source: Utts, Seeing Through Statistics, : p. 384, #11 • Contemplating switch from quarter system to semester system • Survey – random sample of n=400 students • 240 prefer quarter system a. Construct 95% Confidence Interval for true proportion who prefer to remain on the quarter system •
Why can I say that more than half of the students prefer to stay on the quarter system versus semester? • Look at the number line • Where does ½ appear? • Where is the Confidence Interval? • Does it cover ½? NO! Completely above 0. 50. • Thus, we are able to say that we are 95% confident that more than half of the students prefer to stay on the quarter system.
Source: Utts, Seeing Through Statistics, : p. 384, #11 (cont) • Contemplating switch from quarter system to semester system •
Notice that our CI • Calculate Confidence Interval for the MEAN, µ, formula uses the quantitative variables population standard deviation, σ. • Remember: Confidence Interval = statistic ± MOE • Categorical (proportions) • Quantitative (means) Margin of Error Standard Deviation of distribution of X values or Standard Error 20
Example: A sample of 11 circuits from a large normal population has a mean resistance of 2. 20 ohms. We know from past testing that the population standard deviation is 0. 35 ohms. Determine a 95% confidence interval for the true mean resistance of the population. Interpretation: We are 95% confident that the true mean resistance is between 1. 9932 and 2. 4068 ohms Although the true mean may or may not be in this interval, 95% of intervals formed in this manner will contain the true mean 21
Can we ever know σ? • 22
Central Limit Theorem: Proportions AND Means RULE: If many samples or repetitions of the SAME SIZE are taken, the frequency curve made from STATISTICS from the SAMPLES will be approximately normally distributed • •
Notice that our CI • Calculate Confidence Interval for the MEAN, µ, formula uses the quantitative variables population standard deviation, σ. • Remember: Confidence Interval = statistic ± MOE • Categorical (proportions) • Quantitative (means) Margin of Error Standard Deviation of distribution of X values or Standard Error 24
Can we ever know σ? • 25
• Student’s t Distribution • • William S. Gosset (under his pen name “Student”) Working for Guinness in Ireland Trying to help brew better beer less expensively Needed to make inferences about means without knowing σ • Substitute the sample standard deviation, S • Introduces extra uncertainty, since S is variable from sample to sample • Use the t distribution instead of the normal distribution 26
t - distribution • Similar to normal distribution • • • Bell-shaped Symmetric Centered at mean/median/mode BUT… tails are “heavier” more probability in the tails Multiply by a little higher value (t-score) than z-score to get margin of error if n is small • Very close to z if n is large • DISADVANTAGES: • To use the t-distribution, we must assume normality of the underlying population • Degrees of freedom (associated with sample size) = n-1 • t-score times standard error estimate gives the margin of error for a confidence interval for the mean
http: //ci. columbia. edu/ci/premba_test/c 0331/s 7_4. html 28
Confidence Level, (1 - ) •
Student’s t Table (Table E. 3, p. 746) Upper Tail Area df . 10 . 05 . 025 1 3. 078 6. 314 12. 706 Let: n = 3 df = n - 1 = 2 = 0. 10 /2 = 0. 05 2 1. 886 2. 920 4. 303 3 1. 638 2. 353 /2 = 0. 05 3. 182 The body of the table contains t values, not probabilities Pearson slide (Chapter 8, #30) 0 2. 920 t
Selected t distribution values With comparison to the Z value Confidence t Level (10 d. f. ) t (20 d. f. ) t (30 d. f. ) Z (∞ d. f. ) 0. 80 1. 372 1. 325 1. 310 1. 28 0. 90 1. 812 1. 725 1. 697 1. 645 0. 95 2. 228 2. 086 2. 042 1. 96 0. 99 3. 169 2. 845 2. 750 2. 58 Note: t Z as n increases Pearson slide (Chapter 8, #31)
Confidence Interval for a Population Mean • When the standard deviation of the population is unknown, the confidence interval for the population mean µ is CI = • “t-score” is based on the t-distribution • Determined from the level of confidence (α) and • Degrees of freedom (df = n– 1), where n is the sample size • To use this method, you need: • Data obtained by randomization • Approximately normal population distribution • Especially important for small sample sizes (if non-normal, use large sample, i. e. , n>30) • Make a graphical display of the data and check for extreme outlier • t-distribution is a robust method in terms of the normality assumption
Example: • Interpretation: Assuming that the underlying data are approximately normally distributed, we are 95% confident that the true mean is between 46. 698 and 53. 302 Although the true mean may or may not be in this interval, 95% of intervals formed in this manner will contain the true mean 33
8. 4 Determining Sample Size • Sometimes given sample size reported with results for a sample already executed • BUT… determination of sample size is a part of the business world • We’ve already looked at Margin of Error (MOE) when we created confidence intervals Margin of Error Standard Deviation of distribution of values or Standard Error Margin of Error Standard Error or Standard Deviation of the Sampling Distribution • Develop sample size estimator (ne) using our estimates for MOE 34
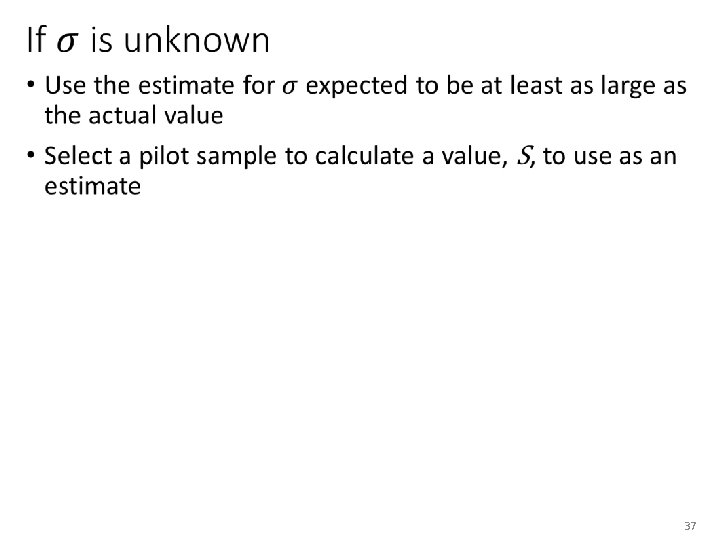
Sample size for means • 35
Example • 36
Sample size for proportions • 38
Example • 39
8. 5 CI Estimation and Ethical Issues • A confidence interval estimate (reflecting sampling error) should always be included when reporting a point estimate • The level of confidence should always be reported • The sample size should be reported • An interpretation of the confidence interval estimate should also be provided 40