Reverse Logistics Dr Ron Lembke Free Book Amazon

Reverse Logistics Dr. Ron Lembke

Free Book �Amazon. com: $20 �www. rlec. org - $0 �Free download

CSCMP �Free to all members

Flow of Retail Goods �Retailer would like to stop it all at the red line

Reverse Logistics �Logistics is the process of getting products from the point of production to where someone wants to buy them. �Cell phone from manufacturer in China to US distribution center �Reverse logistics is products going the “wrong way” to recapture value or proper disposal. �Like Salmon spawning, swimming against the current

Reverse Logistics is: The process of planning, implementing, and controlling the efficient, cost effective flow of raw materials, in-process inventory, finished goods and related information from the point of consumption to the point of origin for the purpose of recapturing value or proper disposal.

Things you don’t want

Reverse Logistics Materials

A Bunch of Junk

RL and Green Logistics Reverse Logistics · Product returns · Marketing returns · Secondary markets “Green” Logistics · Remanufacturing · Recycling · Reusable packaging · Disposal issues · Air & noise emissions · Environmental impact of mode selection · Packaging reduction

U. S. Reverse Logistics Costs Total U. S. Logistics Costs Approximate RL cost % Estimated U. S. RL Costs Source for U. S. total costs Bob Delaney, 13 th Annual State of Logistics Report. $970, 000 4. 00% $38, 800, 000

Size of Reverse Logistics �Logistics costs 9. 5% U. S. economy. � (State of Logistics Report) �Logistics costs were $1. 2 trillion in 2005 �Reverse logistics costs 4 -5% total logistics costs or �Roughly one-half percent of the total U. S. gross domestic product (GDP). �Reverse logistics costs approximately $60 billion in 2006.

How much stuff comes back? �We estimate 6% based on extensive interviews � 5. 5% Shop. org � 6% was “typical” in 1958 � 4 -5% in 1929 � 15% - Chicago (State St. ) 1933 � 12. 5% - Boston 1933

How much stuff? �$870 b furniture, clothing, electronics, sporting goods, general merchandise, catalog sales � 6% return rate �$52 b product returned annually

Productivity Press

Key RL Management Elements · · · · · Gatekeeping Compacting Disposition Cycle Time Reverse Logistics Information Systems Centralized Return Centers Zero Returns Remanufacture and Refurbishment Asset Recovery Negotiation Financial Management Outsourcing

Reverse is Different Forward Reverse Product quality uniform Product quality not uniform Disposition options clear Disposition not clear Routing of product unambiguous Routing of product ambiguous Forward distribution costs more easily understandable Pricing of product uniform Reverse costs less understandable Inventory management consistent Inventory management not consistent Product life cycle manageable Product lifecycle less manageable Financial Management issues clearer Financial Management issues unclear Negotiation between parties more straightforward Type of customer easy to identify and market to Negotiation less straightforward Visibility of process more transparent Pricing of product not uniform Type of customer difficult to identify and market to Visibility of process less transparent

Cost Comparisons: Reverse vs. Forward Cost Comparison to Forward Logistics Transportation Higher Inventory holding cost Lower Shrinkage (theft) Much lower Obsolescence May be higher Collection Much higher -- less standardized Sorting, quality diagnosis Much greater Handling Much higher Refurbishment / Repackaging Significant for reverse logistics, very low forward Change from book value Significant for reverse logistics, nonexistent forward

CRCs: What do they do? �Store sends to CRC – centralized return center, which: �Identifies the product �Assesses its condition �Sell as new �Sell as is via outlet, retail �RTV return to vendor if possible �Sell to brokers �Landfill / recycle

Typical Benefits from Centralized Return Centers �Simplified store procedures �Improved supplier relationships �Better returns inventory control �Improved inventory turns �Reduced administrative costs �Reduced store level costs �Reduced shrinkage �Refocus on retailer core competencies �Reduced landfill �Improved management information

Centralized Return Centers �Consistency - Impose procedures �Space Utilization �Labor Savings �Transportation Costs �Improved Customer Service �Compacting Disposition Time �Visibility of Quality Problems �Forward/Backward �Accounting Issues �Information system improvement �Bottom line impact

Key Reverse Logistics Management Elements �Improve return “gatekeeping. ” �Compact disposition cycle time. Information systems

Disposition Options �What are we going to do with it? �Sell as new and make a profit �Open box – discounted, smaller profit �RTV – money back, but have to pay shipping, paid to stock, repack, etc. �Sell off for 10% of cost �Recycle – less than 10% at best �Landfill – pay to haul away

Compact Disposition Cycle �Respondent firms that have very short reverse logistics disposition cycle times have lower average reverse logistics costs as a percentage of logistics costs. �Shorter reverse logistics disposition cycle times result in reverse logistics costs having a smaller impact on profitability.

Outsourcing: Bottom-Line Impact By what percentage did reverse logistics costs reduce your profits? In-House Outsourced Central Return Center 4. 8% 3. 7% Companies that outsourced Central Return Centers saw profits reduced by smaller about due to returns.

RL Service Providers-2002 �Contacted 135 3 PLs offering RL services �Inbound Logistics, Google � 52. 4% response rate (9 wouldn’t respond) � 55 actually provide some kind of reverse logistics services (10 don’t) � 38 actually touch the product � 17 sell a software product � 35 manage transportation of RL

Does your firm have reverse logistics IT system capabilities?

What type of systems? �Return tracking, RMA �Dispositioning �WMS �Retail �Manufacturing 33% 9% 24% 3% 2%

Do you expect reverse logistics activities to increase?

Zero Returns �Reduces the variability of returns costs. �Retailer has to take responsibility for minimizing returns. �Enables the firm to avoid the problem of physically dealing with returns altogether. �Does not reduce much of the physical burden placed on downstream channel participants. �Cannibalization of “A” channel concerns. � 2%/6% Problem

Customer Returns

Marshall Field’s 1861 ad “Give the Lady What She Wants”

Return Percentages �Book Publishers �Book Distributors �Greeting Cards �Catalog Retailers �Electronic Distributors �Computer Manufacturers �CD-ROMS �Printers 20 -51% 10 -20% 20 -30% 18 -35% 10 -12% 10 -20% 18 -25% 4 -8% �Mail Order Computer Manufacturers 2 -5% �Mass Merchandisers 4 -15% �Auto Industry (Parts) 4 -6% �Consumer Electronics 4 -5% �Household Chemicals 2 -3%

Efforts to Reduce Returns �Shorter Returns windows �Restocking fees �Mandatory Receipts, Identification �Look up purchase �Gift cards �instead of refunds w/o receipt �Sell instead of gifts – nothing to return!

Customers Accepting Changes

“Regifting” Elaine: Hey. Oh, is that a label maker? Jerry: Yes it is. I got it as a gift, it's a Label Baby Junior. Elaine: Love the Label Baby, baby. You know those things make great gifts, I just got one of those for Tim Whatley for Christmas. Jerry: Tim Whatley? Elaine: Yeah. Who sent you that one? Jerry: One Tim Whatley! Elaine. No, my Tim Whatley? I think this is the same one I gave him. He recycled this gift. He's a regifter! Copyright © 2005 Reverse Logistics Trends, Inc.

Regifting? Copyright © 2005 Reverse Logistics Trends, Inc.

Harris Interactive Poll �Have done it �Think it’s OK By Age: �Plan to do it Men 39% 70% Women 64% 86% 25 -34 46% Copyright © 2005 Reverse Logistics Trends, Inc. 35 -44 36% Total 52% 78% 45 -54 28%

Giftcards? �Gift cards estimated at $60 b � 10 -15% go unused �Card. Avenue 5, 000/mo Copyright © 2005 Reverse Logistics Trends, Inc.

Consumer Returns Focus Groups �Consumer Electronics Association �Focus Groups: � Half men, half women � 10 online, 2 in-person groups �All across US �e. Brain market research �Recruited through Survey. Savvy. com �Returned consumer electronics product recently.

Focus Groups

What if you could never return? �not buy any thing �I sometimes make bad purchase decisions. . �I wouldnt shop there �I’d be very reluctant to buy with a no returns policy. Stuff happens. �I won't buy nothing at a store with such policy �“Tuck the Tags” �Receipts? Look me up

How choose a store �“It's the closes electronics store to where I live, not that much thought really” �“the cheapest cost or closest location or sale” �“looked up ads for a couple of weeks, found the cheapest price” �“FREINDS FAMILY” �“long relationship” �“COOL” �“Price and location” �No one mentioned returns policy

Shifting Policies �Returns Avoidance �Customer behavior adapting

Even The Almighty is Confused

Secondary Markets Who is in it? How big is it?

Research Motivation �Companies typically sell to secondary market as last resort �First, mark down 50 or 75%, to roughly 50% of cost, still didn’t sell in stores �Broker buys for 10% of cost �A 1 percentage point increase gives a 10% in revenues �For a large retailers, that’s millions of $

Secondary Market Flow We want to understand the total dollars flowing through the secondary market

Key Decision Factors �Price secondary to trust in choosing whom to sell to �Brand equity protection �Who are you? Why do you want to know? �Very thin margins �Buy for 10 -15% of cost typically �Mark up by 1% �Try to sell before taking possession, buyer takes it straight from retailer’s dock

Secondary Market Goods �New product: �Overproduction �Shelf pulls �Lifts �Marketing returns �Second quality �End of life/season closeouts �Salvage / returns: �Customer returns �Freight damage �Defective �Recalls �Gray market �Black market �Knockoffs

Secondary Market Buyers �New vs. Salvage: �New: Close-outs, job-outs, surplus �Diverters �Deal in salvage, deal in both �Primary brokers �Buy large quantities (truckload) from retail �Sell TL or pallet quantity to secondary brokers �Brokers want to resell before possession �“Direct from retailer”

Selling Process �Pricing �Per pallet, per pound, per item �“Cherry picking” despised �Buyers’ belief less information is better �Caveat emptor: Good & bad loads even out

Structure of Selling �No standardization, automation �Phone, fax often still primary tools �Retailers sell same things at same times �Brokers call and request �Some quasi-auctions, some FCFS �Trust: Relationship-based processes �Often Invitation only �Gordon Brothers exchange

Information availability and Risk to Buyer Low High Variabilty of product Low risk to buyer Predictable profits for buyer Brokers unwilling to risk High trust required Maximize revenue Low Information availability to broker High
 as Condition improves 100% Repaired “As is” 0%")
Secondary Market value (% of cost) as Condition improves 100% Repaired “As is” 0% Damaged Used New

Brokers �Overstock Brokers: new product �seasonal �package change �product change �Overruns �Salvage Brokers: not new condition �Returned goods �Shelf damage �Acts of God

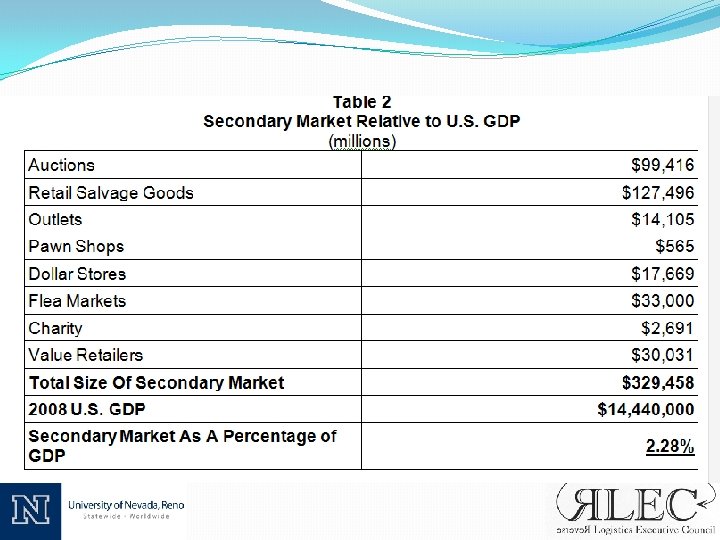
Size of Secondary Market: $329 B US GDP: $ 14, 440 B 2. 28% US GDP

Salvage Dealer?

Highway 61 = e. Bay? Well Mack the Finger said to Louie the King “I got forty red white and blue shoe strings And a thousand telephones that don't ring Do you know where I can get rid of these things? ” And Louie the King said, “Let me think for a minute son. ” And he said, “Yes I think it can be easily done. Just take everything down to Highway 61. ”

Who buys from the brokers? �Sold directly on e. Bay �Buy a pallet, open a shop �Flea markets �Websites �Dollar / Bargain stores

Returns to Secondary Market Flow

Methodology �Delphi Panel Methodology �Lack of data, inability to measure directly �Panel � 4 mass merchandisers (RL and returns) � 4 3 PLs specializing in RL � 5 RL managers at CE firms � 2 contract manufacturers � 3 industry association executive directors

Auctions �e. Bay, amazon, nobetterdeal, alibris �e. Bay goods sold 2008 $59. 7 b �Not including autos �Market share estimated at 60% �Total market $99. 4 b

Pawn Shops � 3 Largest Publicly Traded: �EZ Pawn �Cash America International �First Cash Financial Services � 10% of total market �Combined Co. GS * 10: �$5, 655 m
 �Dollar General �Family Dollar � 80%")
Dollar Stores �Dollar Tree (40% of US stores) �Dollar General �Family Dollar � 80% of goods estimated to be from asset recovery process �$17, 669 m �Underestimate �American consumers much more willing to purchase from secondary outlets. �Can be difficult to manage. �Fastest growing retail sector

Charities Flea Markets �Salvation Army �$30 billion estimate, 2006 �Goodwill Industries �$2. 7 b combined revenues � 10 -15% increase since then �Clear underestimate �$33 billion

Reuse Friends of Multiple Sclerosis will pick it up, sell it at Savers’ Washoe ARC pick up Salvation Army, Goodwill

Value Retailers �Often returned to retail, or bought on secondary market � 1 -2 seasons behind current retail �Big Lots, TJ Maxx, Marshall’s, Ross �Combined revenues $30, 013 m �clear underestimate

Factory Outlets �Factory Outlet Stores: �Goal often 70% of retail price � 80% of goods non-secondary market �Factory Outlet Sales � 58, 579, 379 SF � 95% typical occupancy rate �$301 revenue/SF �$13, 400 m

Salvage Dealers-2007 Econ Census $m of Cust $m Mktg Avg Cust % to Returns Secondary Marketin Secondary % y Mkt g Returns Mkt Computers & Consumer Electronics Clothing Stores Department Stores General Merchandise Electronic Shipping & Mail Order Total 7, 664 7, 715 0, 142 7, 865 8 6% 15 10% 21 6% 36 6% 21 5, 963 8% 1, 03 9, 349 75% 75% 75% 45 29 56 54 58 42 3, 9 7% 11, 8 7% 9, 4 7% 16, 5 7% 12, 9 7% 54, 7 36 40 10 51 17 54 6 11, 0 14, 7 25, 7 15, 1 72, 7

Salvage Dealer Market Flow

Size of Secondary Market Sector Auctions Outlets Dollar Stores Flea Markets Pawn Shops Charity Value Retailers Retail Salvage Goods Total Size of Secondary Market 2008 US GDP Secondary Market as % US GDP: Size 99, 416 14, 105 17, 669 33, 000 565 2, 691 30, 031 127, 496 324, 973 14, 440, 000 2. 25%

Security is Sometimes Key � 288 t-shirts & caps �Sewickley, PA: World Vision �Remote villages in Africa �Antithesis of revenue maximization
- Slides: 75