
Retention of Top Performers and High Potential Employees













- Slides: 44
Retention of Top Performers and High Potential Employees NOARK SHRM Chapter Meeting / NOARK 2012 C & B Study August, 2012 Blair Johanson
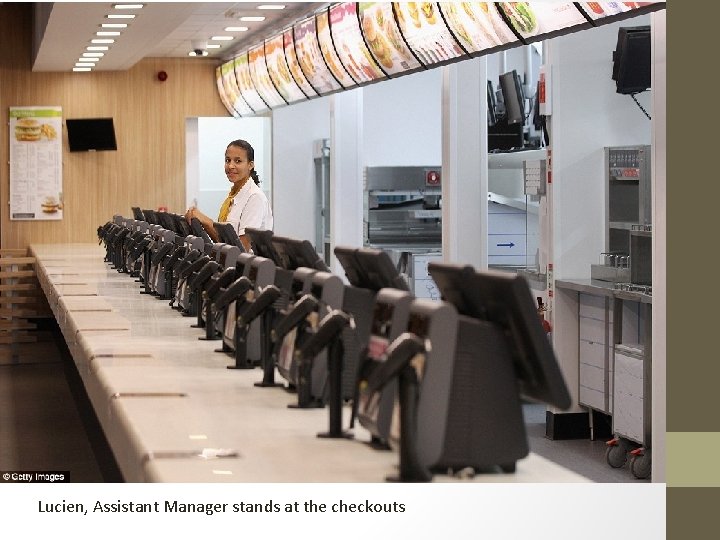
Lucien, Assistant Manager stands at the checkouts
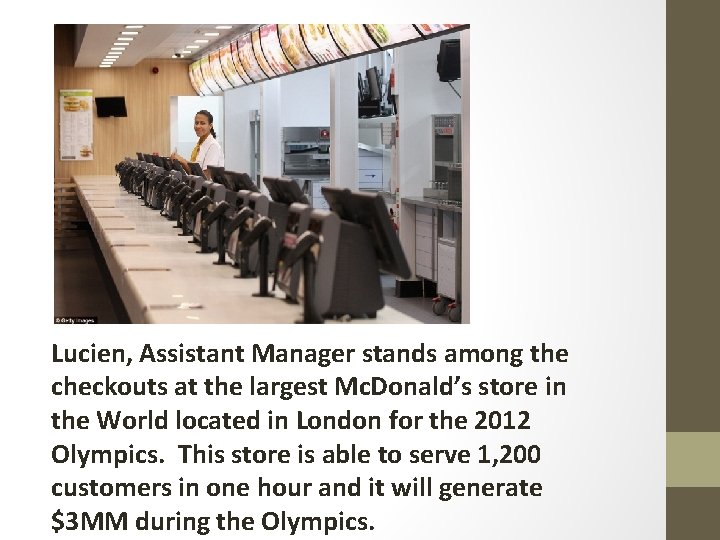
Lucien, Assistant Manager stands among the checkouts at the largest Mc. Donald’s store in the World located in London for the 2012 Olympics. This store is able to serve 1, 200 customers in one hour and it will generate $3 MM during the Olympics.
Presentation Agenda q. Define top performers q. Risks of losing top performers q. Why top performers look elsewhere q. Effective retention strategies q. Case Studies – New pay plans q. High level results of 2012 NOARK Compensation and Benefits Study
Top Performers Defined q. Everything they do is exceptional q. Excellence award winners q. Long-tenured top performers q. Envision and impact end results q. Problem solvers q. Exhibit or have leadership potential
Study: Rewarding and Retaining Key Talent – Post Recession Defining Key Talent Employees q Strongest performers q High potential q Are in critical jobs Dr. Dow Scott, Ph. D. Loyola University, Chicago Input from 600 Reward Professionals, December 2011 to January-2012
Katrina Markoff, the founder of Vosges Haut-Chocolat, a Chicago business with annual sales that exceeded $30 MM in 2011. Sales to Neiman Marcus, eight chocolate bontique shops around the Chicago metroplex and now to Target and Walmart. Prices range from $4 to $100+ and Katrina states, “We use chocolate to tell stories. ” Katrina ask her employees for their personal dreams and she and the company help them achieve these dreams and goals.
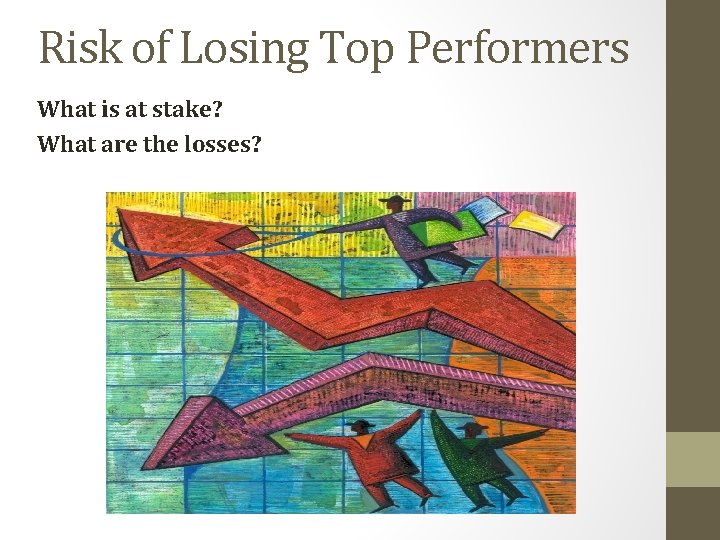
Risk of Losing Top Performers What is at stake? What are the losses?
Risk of Losing Top Performers q q q Contribution to bottom line and lost momentum Reputation for short retention of top performers T. P. ’s network with other T. P. ’s Loss of sensitive information and differentiation Future innovations and bright minds out the door Competition – “War for Talent” - $$$$ WAW Article: Stacey Carroll, MBA. CCP, SPHR – Pay. Scale
Ulysses "Junior" Bridgeman was an accomplished basketball player during 12 years in the NBA. Bridgeman is owner and president of $500 million Manna Inc. and ERJ Inc. , which manage more than 320 restaurants. Those include 163 Wendy's Old Fashioned Hamburger restaurants, 120 Chili's, nine Perkin's Family Restaurant & Bakery restaurants and at least 28 Fazoli's. They're all slam dunks. "But what we found is the more people we helped along the way - maybe they get a job or they're able to support their family - the more things seem to grow.
Why are They Looking or Leaving? q q Seeking higher pay elsewhere Personal reasons Seeking advancement opportunities Not taking care of top performers WAW Article: Stacey Carroll, MBA. CCP, SPHR – Pay. Scale q More pay q Lack of promotional opportunities q Pay equity issues Dr. Dow Scott, Ph. D. Loyola University, Chicago
Major Concerns of Top Performers q q q q Increasing frustration with slow decision-making Layoffs Expansion of job accountabilities Constraints on rewards programs Limits on base salary increase Lower incentives Fewer advancement opportunities Dr. Dow Scott, Ph. D. Loyola University, Chicago Tom Mc. Mullen and Mark Royal Ph. D. – Hay Group
Survey Findings Define Key Talent/Top Performers and Why? Intentional Plan – How to Treat Top Performers? Relevant and fair pay program Pay above median of relevant markets Careful monitoring of external markets Clear communication of performance and pay Clear and compelling reasons for pay systems that differentiate key talent from other employees q Development/advancement/succession plans q q q Dr. Dow Scott, Ph. D. Loyola University, Chicago Tom Mc. Mullen and Mark Royal Ph. D. – Hay Group
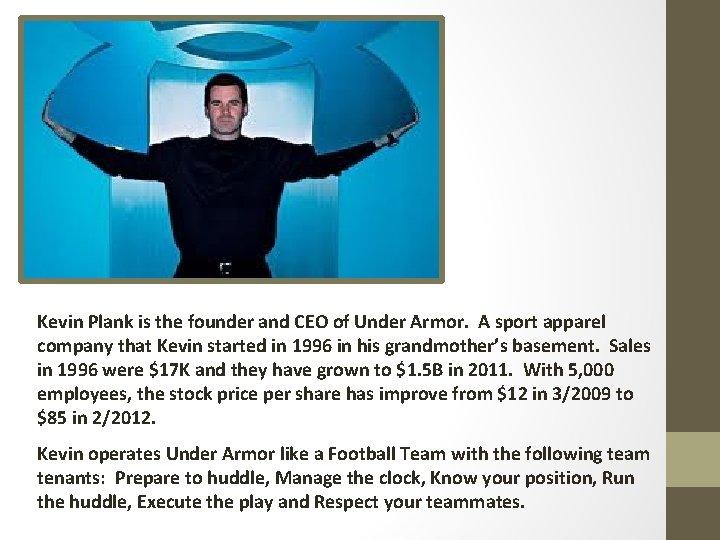
Kevin Plank is the founder and CEO of Under Armor. A sport apparel company that Kevin started in 1996 in his grandmother’s basement. Sales in 1996 were $17 K and they have grown to $1. 5 B in 2011. With 5, 000 employees, the stock price per share has improve from $12 in 3/2009 to $85 in 2/2012. Kevin operates Under Armor like a Football Team with the following team tenants: Prepare to huddle, Manage the clock, Know your position, Run the huddle, Execute the play and Respect your teammates.
Compensation Mistakes Failure to reward performance q Top performers work for top performance and paying companies q SHRM Study – 7% to 8% in addition to base pay q Driving positive performance culture - $$ for TP’s q Google’s WAW Statement – Only TP’s work here! q Fair & equal pay vs. unequal pay for performance q Healthy competition greater than low performance WAW Article: Stacey Carroll, MBA. CCP, SPHR – Pay. Scale
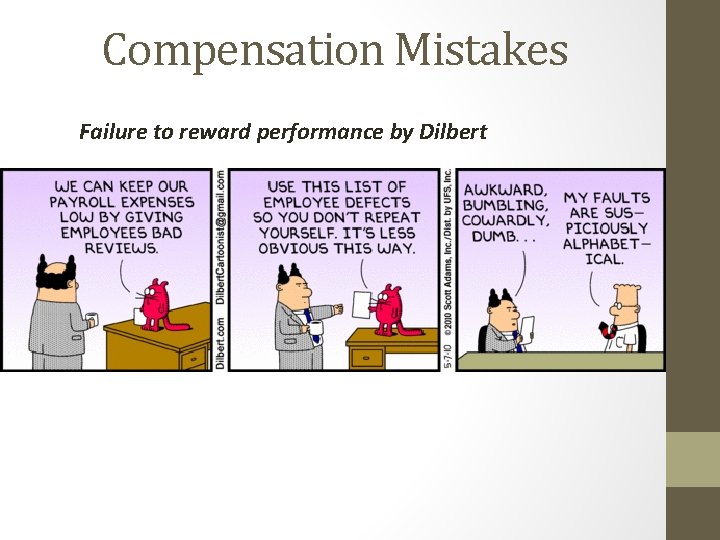
Compensation Mistakes Failure to reward performance by Dilbert
Compensation Mistakes Poor incentive design q q q Line of sight - FOCUS Performance contributes to business results Employees feel that they can impact results Reward Results – not activity Simplicity of design – Two-three targeted results Design good goals by seeking knowledge and expertise WAW Article: Stacey Carroll, MBA. CCP, SPHR – Pay. Scale Ann Bares, Compensation Café Blog: “Simplifying incentive plans requires courage. Why?
Compensation Mistakes Following the Macro trends q External competition trends do not necessarily equal internal compensation strategies q The market and employees are always in transition – moving q Market leaders work to stay ahead of the crowd q Base pay has stabilized and funds are transferring to variable pay plans WAW Article: Stacey Carroll, MBA. CCP, SPHR – Pay. Scale
Retention Strategies WORLD AT WORK STUDY Compensation Objectives for 2011 q q q Retaining top employees Attracting new talent 80% formal strategy for compensation 50% focus on merit base pay plan 45% learning and development opportunities Compensation Objectives for 2012 q 93% plan to increase employee pay in 2012 q 69% will adjust pay to reward performance q 31% will make cost of living pay increases
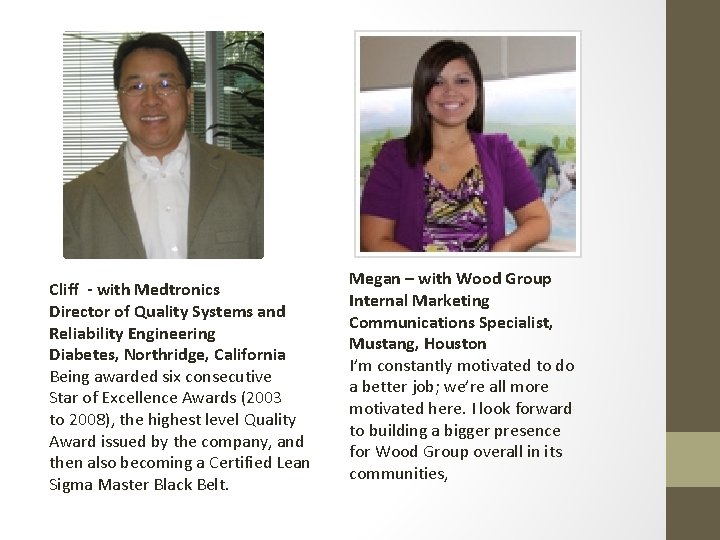
Cliff - with Medtronics Director of Quality Systems and Reliability Engineering Diabetes, Northridge, California Being awarded six consecutive Star of Excellence Awards (2003 to 2008), the highest level Quality Award issued by the company, and then also becoming a Certified Lean Sigma Master Black Belt. Megan – with Wood Group Internal Marketing Communications Specialist, Mustang, Houston I’m constantly motivated to do a better job; we’re all more motivated here. I look forward to building a bigger presence for Wood Group overall in its communities,
Retention of Top Performers q Take care of top performers q Larger salary increases and incentives to clearly demonstrate their contribution and importance to the organization q Two-pool merit increase approach: 5% - top 20% & 2. 5% rest q Link incentive pay to results for variable compensation plans q 2 to 3 key measurable goals – individual/team expectations q Manage new job structures – hybrid jobs, broader scope q Balance of internal job evaluation and market pay pricing q Communicate clearly and openly q Transparency increases employee engagement and support for organizational goals Richard Sperling, CCP and Neil Lappley – Workspan Article 12/11
New Rewards Plan Case Study Regional Mutual Insurance Company, Anthony Riani, CCP, CSCP q q q Less than 1, 000 employees Doing business since 1949 No written compensation philosophy No pay ranges No budget for increases No detailed performance management system New Plan: Pre-work q q Constant communications Trust building with managers Training and brown bag sessions Patience and persistence
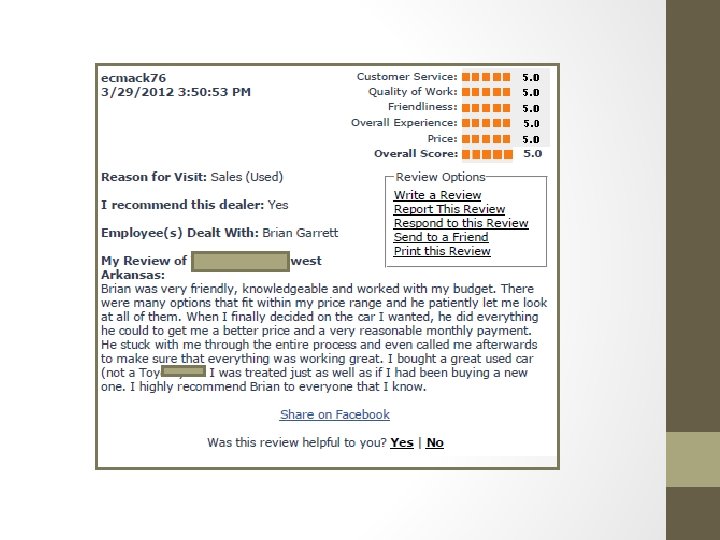
New Rewards Plan Case Study Company developed a structured and open compensation system with a compensation strategy, transparent pay ranges and performance increase process. q Conversion of time honored Holiday Bonus Plan to a Performance Bonus Plan q Brown bag lunches with top performers q Focus on Metrics: Customer Loyalty (30%), Retention (20%), Growth (20%), Efficiency (30%) q X annual company financial target opens the door q 1% to 7% of base pay q Quarterly updates on progress toward goals/$% q Employees grasped this simple plan w/enthusiasm
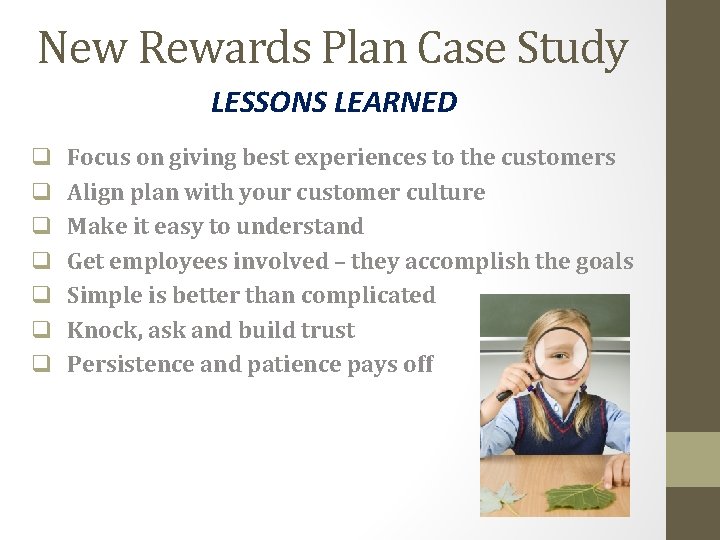
New Rewards Plan Case Study LESSONS LEARNED q q q q Focus on giving best experiences to the customers Align plan with your customer culture Make it easy to understand Get employees involved – they accomplish the goals Simple is better than complicated Knock, ask and build trust Persistence and patience pays off
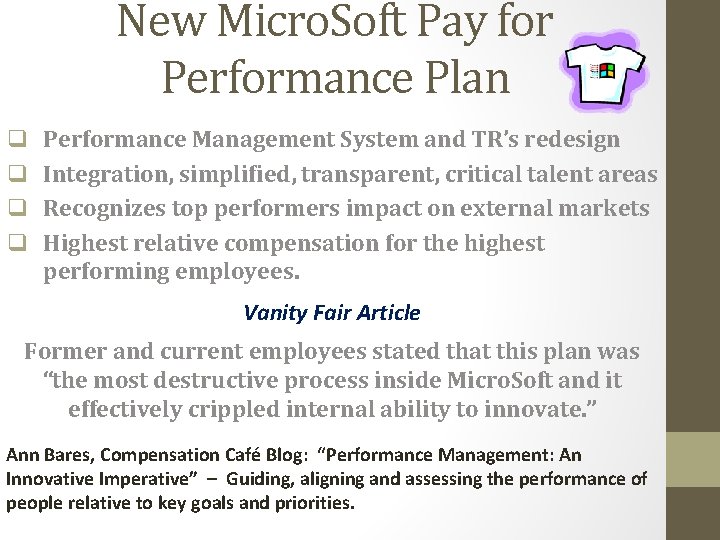
New Micro. Soft Pay for Performance Plan q q Performance Management System and TR’s redesign Integration, simplified, transparent, critical talent areas Recognizes top performers impact on external markets Highest relative compensation for the highest performing employees. Vanity Fair Article Former and current employees stated that this plan was “the most destructive process inside Micro. Soft and it effectively crippled internal ability to innovate. ” Ann Bares, Compensation Café Blog: “Performance Management: An Innovative Imperative” – Guiding, aligning and assessing the performance of people relative to key goals and priorities.
The Merit Matrix An Effective Tool for Driving Pay for Performance, Beverly Dunlap, KENEXA q Identify high, average and low performers q Recognizing and rewarding employee contributions q Useful tools and processes * * * Performance Merit Matrix Table Percentage of Midpoints Matrix Table Performance and Position in Range Matrix Table Educating and Training Managers Employee Communication “Employees who perform well are appropriately rewarded, and those who do not, are given the incentive to improve performance or seek opportunities in another organization. ”
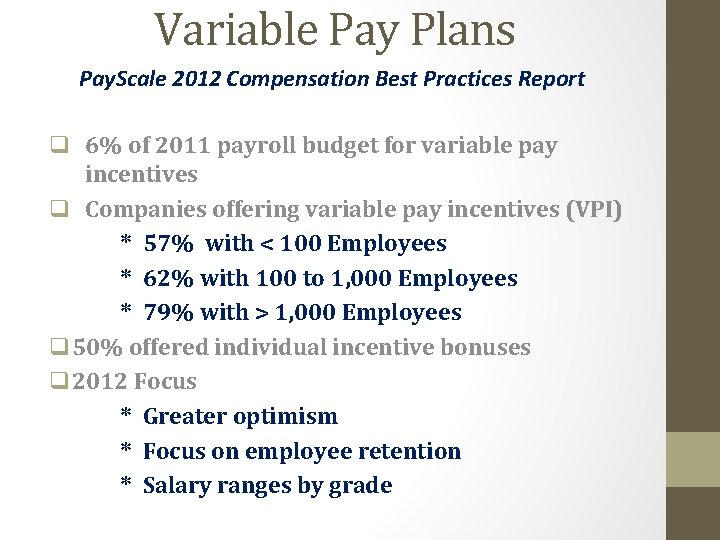
Variable Pay Plans Pay. Scale 2012 Compensation Best Practices Report q 6% of 2011 payroll budget for variable pay incentives q Companies offering variable pay incentives (VPI) * 57% with < 100 Employees * 62% with 100 to 1, 000 Employees * 79% with > 1, 000 Employees q 50% offered individual incentive bonuses q 2012 Focus * Greater optimism * Focus on employee retention * Salary ranges by grade
Incentive Pay Purpose Statement Ann Bares: Compensation Café Blog “Purpose of incentive pay is – in fact – to influence the efforts and choices of workers who had better already have a baseline level of motivation, by calling out top priorities, by guiding their employees to areas and activities where they can create the most value, by signaling the importance of collaboration through highlighted shared goals and the opportunity for shared reward, and by defining a form of partnership through which employees have the chance to share in the economic success they help produce. ”
Though Different - What is the Same?
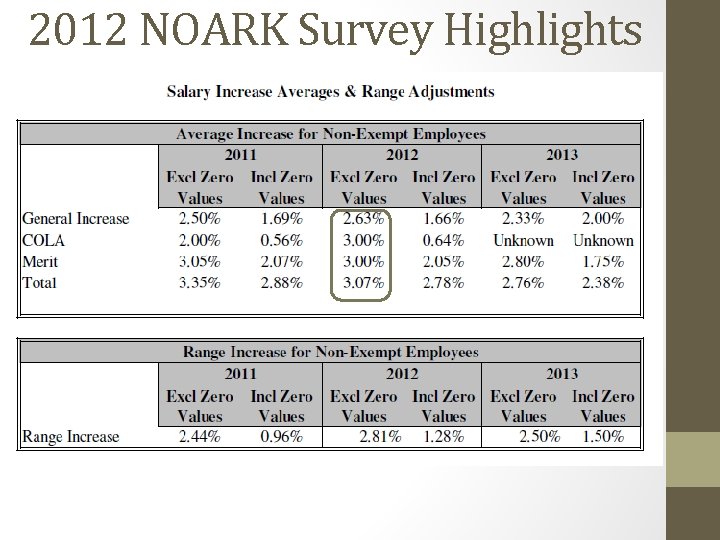
2012 NOARK Survey Highlights
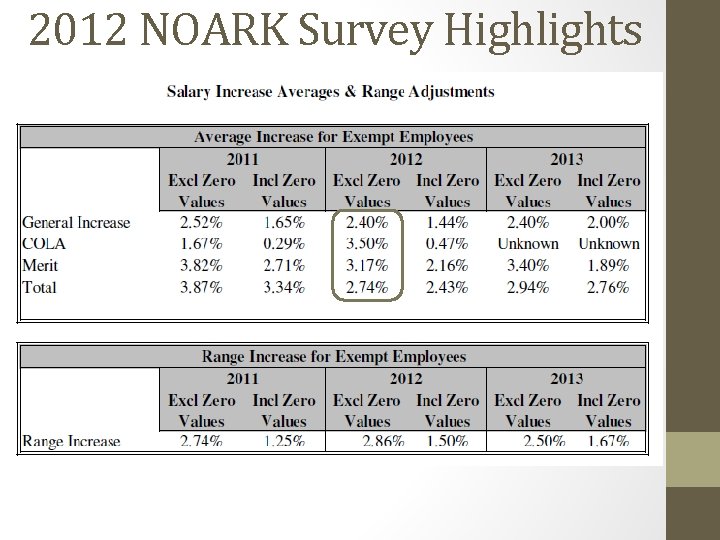
2012 NOARK Survey Highlights
2012 NOARK Survey Highlights
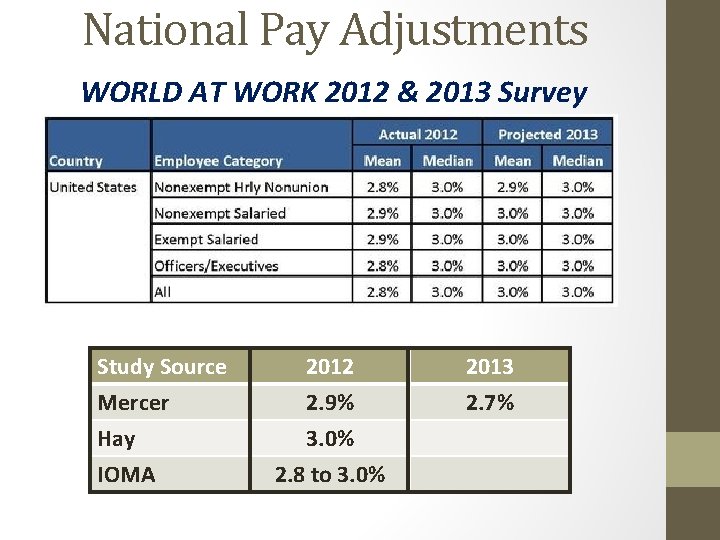
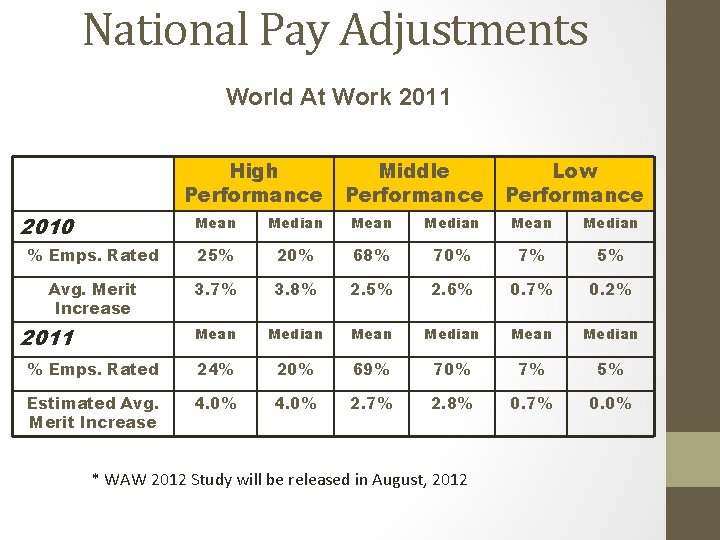
National Pay Adjustments WORLD AT WORK 2012 & 2013 Survey Study Source Mercer Hay IOMA 2012 2. 9% 3. 0% 2. 8 to 3. 0% 2013 2. 7%
National Pay Adjustments World At Work 2011 High Performance 2010 Middle Performance Low Performance Mean Median % Emps. Rated 25% 20% 68% 70% 7% 5% Avg. Merit Increase 3. 7% 3. 8% 2. 5% 2. 6% 0. 7% 0. 2% Mean Median % Emps. Rated 24% 20% 69% 70% 7% 5% Estimated Avg. Merit Increase 4. 0% 2. 7% 2. 8% 0. 7% 0. 0% 2011 * WAW 2012 Study will be released in August, 2012
National Pay Adjustments WORLD AT WORK 2012 & 2013 Survey With average (mean) salary increase budgets below 3% for the fourth consecutive year, managers may be tempted to skip differentiating employee performance altogether. But with such modest salary budgets, pay for performance should actually be more heavily underscored, according to World at Work Practice Leader Kerry Chou, CCP. "In order to accomplish this, you need to effectively allocate available salary dollars, which could mean low or no raises for marginal performers, " he said. "And while this isn't a pleasant conversation for managers to have, in the long run it's easier than losing your stars to the competition and then spending far greater sums to find replacements.
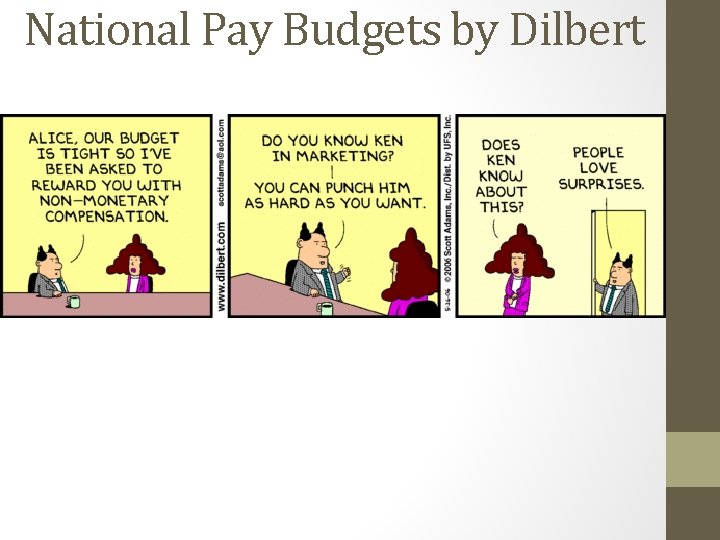
National Pay Budgets by Dilbert
2012 NOARK Survey Highlights % of Employee Premium Paid by: % of Employee Plus Spouse Premium Children Premium Family Premium Paid by : Paid by 2012 Emp. Co. 19. 5 80. 5 34. 1 65. 9 33. 0 67. 0 32. 6 67. 4 2011 Emp. Co. 19. 4 80. 6 34. 0 66. 0 37. 3 62. 7 36. 1 63. 7
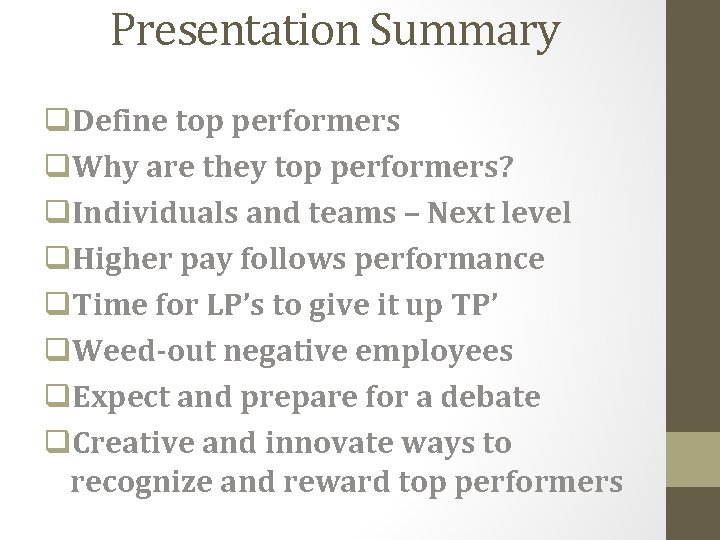
Presentation Summary q. Define top performers q. Why are they top performers? q. Individuals and teams – Next level q. Higher pay follows performance q. Time for LP’s to give it up TP’ q. Weed-out negative employees q. Expect and prepare for a debate q. Creative and innovate ways to recognize and reward top performers
QUESTIONS blair. johanson@johanson group. net