Results from the Mars Express Active Ionospheric Sounder


 as a function of solar zenith angle")


- Slides: 61
Results from the Mars Express Active Ionospheric Sounder D. D. Morgan 1, D. A. Gurnett 1, D. L. Kirchner 1, F. Duru 1, R. L. Huff 1, D. A. Brain 2, W. V. Boynton 3, M. H. Acuña 4, E. Nielsen 5, A. Safaeinili 6, J. J. Plaut 6, G. Picardi 7 1 Department of Physics and Astronomy, University of Iowa, Iowa City, Iowa 2 Space Physics Research Group, Space Sciences Laboratory, University of California, Berkeley, California 3 Lunar and Planetary Laboratory, University of Arizona, Tucson, Arizona 4 NASA Goddard Space Flight Center, Greenbelt, Maryland 5 Max-Planck-Inst. For Solar System Research, Katlenburg-Lindau, Germany 6 Jet Propulsion Laboratory, Pasadena, California 7 Infocom Department, “La Sapienza, ” University of Rome, Italy
Mars Express Dec. 25, 2003 Dipole Antenna: 2 x 20 m P-03 -14
Mars Express Orbit
Nominal Mars Express Orbital Parameters at Insertion • • • Orbital Inclination: 86. 3° Apocenter: 11, 560 km (altitude) Pericenter: 258 km (altitude) Orbital period: 7. 5 h Observing time about periapsis: ~1 h
Mars Express Radar Transmitter
Mars Express Spacecraft
Summary of Active Ionospheric Sounder sequence • 160 frequencies sampled between 0. 1 and 5. 4 MHz (receive frequencies can be varied). • 1 pulse every 7. 857 ms, bandwidth = 10 k. Hz • 80 receive times per frequency , 91. 4 μs/sample • Complete cycle every 7. 543 s (data rate limited).
Timing of AIS data
Radar Reflections from the Ionosphere
Ionogram inversion • Time delay equation:
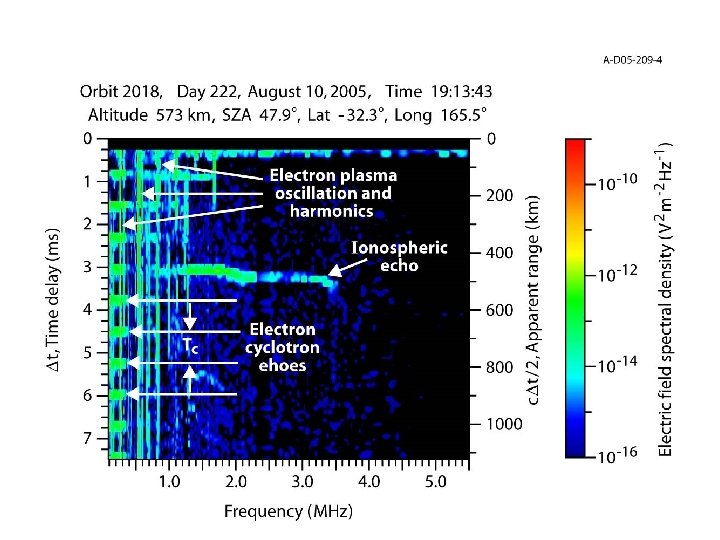
Example Ionogram
Topics of Interest • Maximum electron density and total electron content • Detection of magnetic fields • Double and complex traces and oblique echoes • Surface reflection and ionospheric absorption • Ionogram inversion • Spacecraft local electron density • Total electron content
Maximum electron density and total electron content
Maximum Electron Density Versus Solar Zenith Angle From Gurnett et al. , 2005
Safaeinili et al. LPSC, 2006
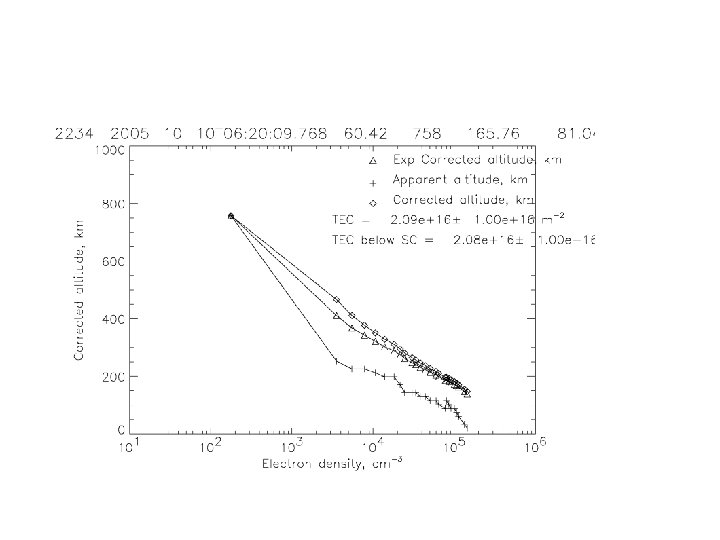
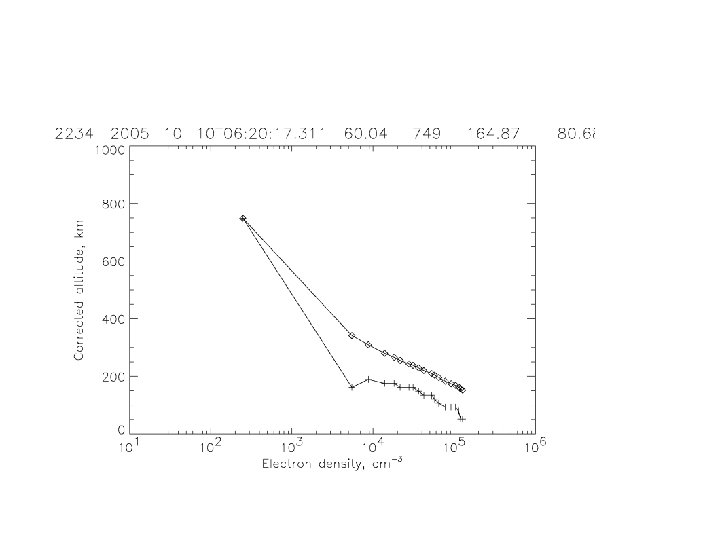
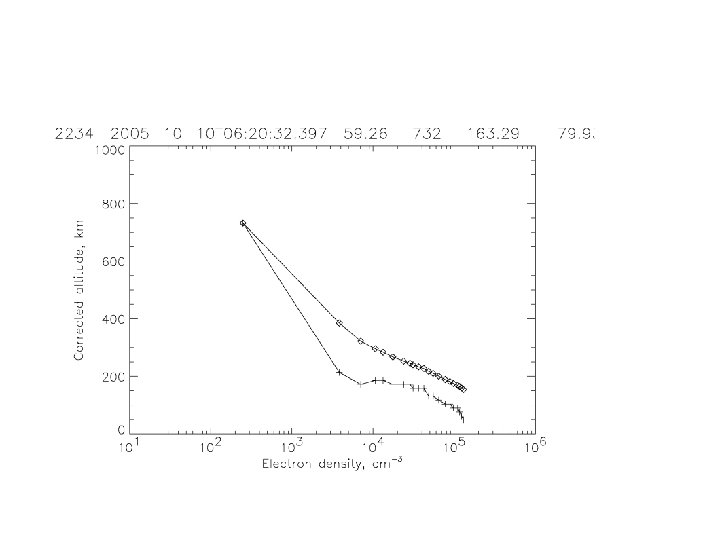
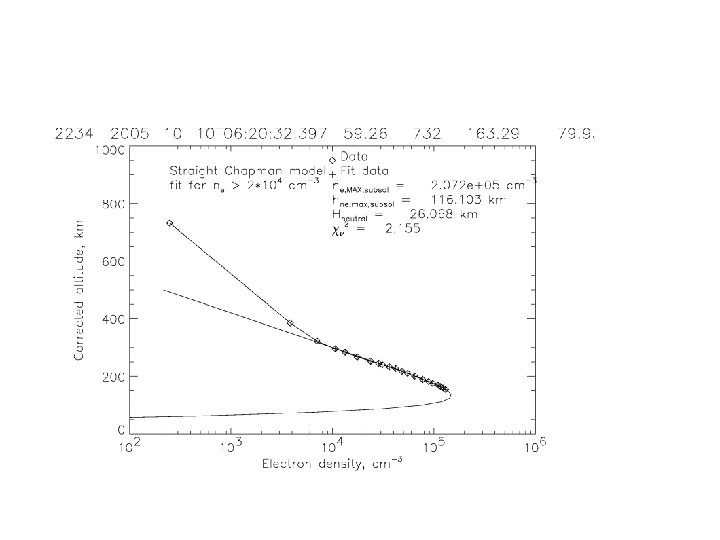
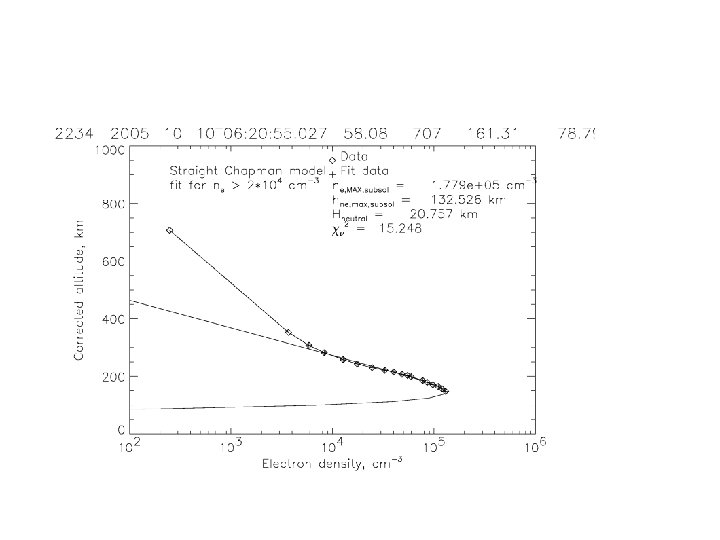
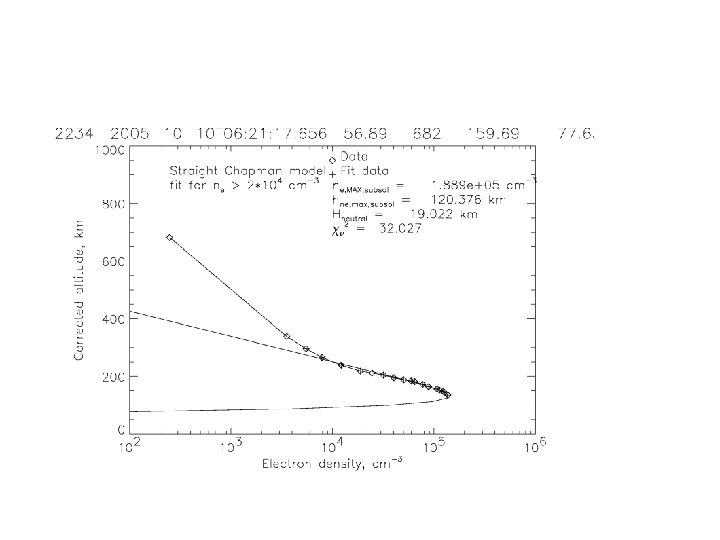
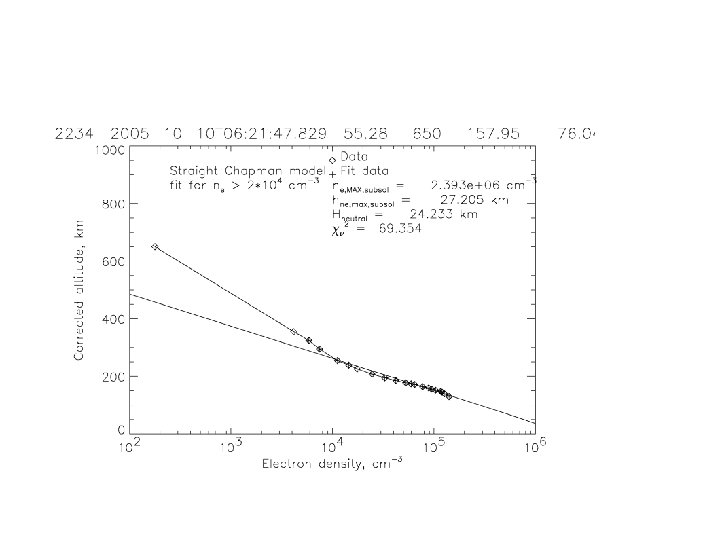
Spacecraft-local electron density
Inbound Electron Density Orbit 2018
Inbound Electron Density Orbit 2032
Inbound Electron Density Orbit 1994
Log 10 ne
Ionogram inversion • Time delay equation:
Radar Reflections from the Ionosphere
Corrected altitude Apparent altitude
Detection of magnetic fields
Electron Cyclotron Echoes
Comparison of the Measured and Model Magnetic Field Strength
Electron Cyclotron Echoes, Video/Audio
Double and Complex Ionospheric Traces
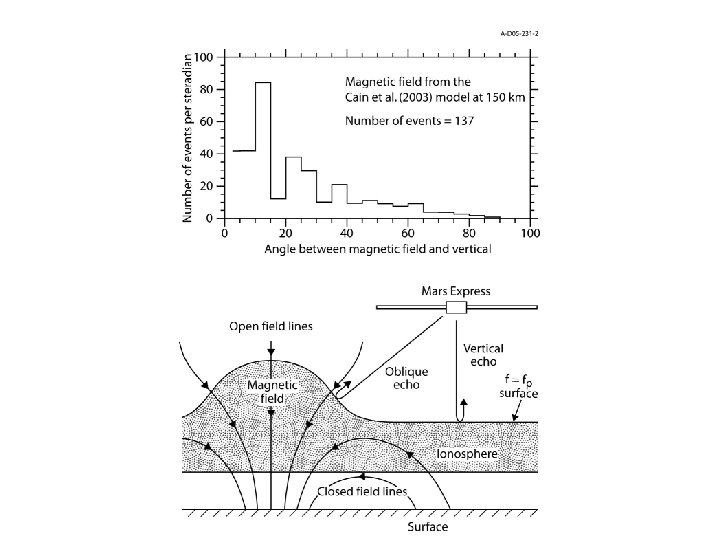
Oblique Echoes
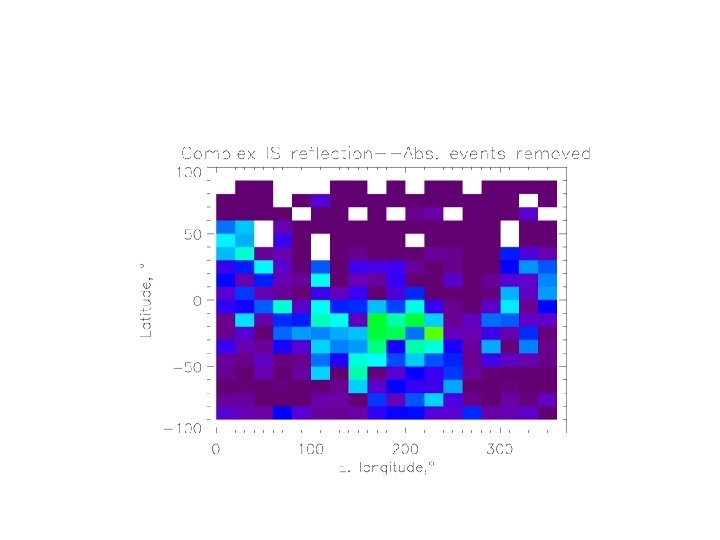
Comparison of Oblique Echoes to Crustal Magnetic Fields
Oblique Echoes and Crustal Magnetic Fields
Best Fit Range to a Fixed Target
Surface reflection and ionospheric absorption
Surface reflection visibility statistic • V = 0 for “not visible” or 1 for “visible”, tabulated for each ionogram. • We select ionograms at 850 km ± 10 km altitude (10 ionograms) and average v.
Comparison with other data sets 1. Averaged surface reflection visibility. 2. Background of Mars Global Surveyor Electron Reflectometer (>10 Me. V) with two hour smoothing to remove orbit signature. 3. Background of Mars Odyssey Gamma Ray Spectrometer (> 10 Me. V). 4. GOES-12 Solar Environment Monitor soft x-ray flux (Earth). 5. NOAA daily X and M class flare counts.
Overview of data
Table 1: Absorption Events Event # Start 1 20050710 -09: 31 2 20050801 -06: 33 3 20050823 -03: 10 4 20050901 -02: 23 5 20050905 -13: 53 End ΔT, days 20050725 -08: 33 15. 0 20050808 -14: 06 7. 3 20050827 -07: 51 4. 2 20050904 -11: 12 3. 4 20050923 -18: 16 18. 2 ?
Event 1 Start: 20050710 -09: 31 End: 20050725 -08: 33 Duration: 15. 0 d
Event 2 Start: 20050801 -06: 33 End: 20050808 -14: 06 Duration: 7. 3 d
Event 3 Start: 20050823 -03: 10 End: 20050827 -07: 51 Duration: 4. 2 d
Event 4 Start: 20050901 -02: 23 End: 20050904 -11: 12 Duration: 3. 4 d
Event 5 Start: 20050905 -13: 53 End: 20050923 -18: 16 Duration: 18. 2 d (? )
Surface reflection visibility variation with Mars geodetic longitude and latitude • Why? We’d like to see if the crustal fields affect the surface reflection. • Bins are 10° in latitude and 20° in longitude. • Altitudes < 1000 km are selected. • Absorption events are removed.
Surface reflection visibility as a function of Mars latitude and longitude Data from July 4 – December 14, 2005
Surface reflection visibility (absorption events removed) as a function of solar zenith angle
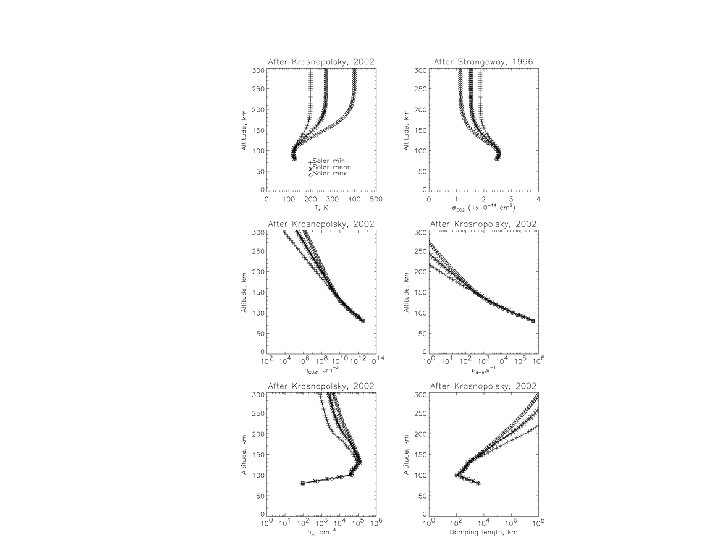
Appendix: Electron-neutral collision damping at Mars Full dispersion relation Real part Group velocity Imaginary part: f» fpe Thermal speed Electron-neutral collision frequency e—neutral cross section (Strangeway, 1996)
Conclusion • Absorption of the surface reflection corresponds extremely well and in detail with enhancements in solar energetic particle flux. • Energetic ions can penetrate the night side of Mars due to their cyclotron radius > 0. 10 R♂ • Surface reflection visibility is an increasing function of solar zenith angle, with near 100% visibility on the night side.