Results Based Management Developing regional development plans Professor

Results Based Management. Developing regional development plans Professor S. P. Premaratna Department of Economics, University of Colombo spp@econ. cmb. ac. lk 077 339323

Road map…… • Planning tools: RBM approach understanding • RBM tools • Case study • Group work

Road map…… Content Responsibility Time Planning tools: RBM approach understanding SPP 9. 00 - 9. 30 RBM tools- stakeholder analysis, SWOT, Problem tree, objective tree, Log-farm SPP 9. 30 – 10. 15 Case study SPP 10. 15 -10. 30 Group work preparation- stage I Participants 10. 30 -12. 00 Lunch All 12. 00 -12. 30 Group work preparation- stage II Participants 12. 30 -2. 00 Group work- presentation Participants 2. 00 - 3. 30
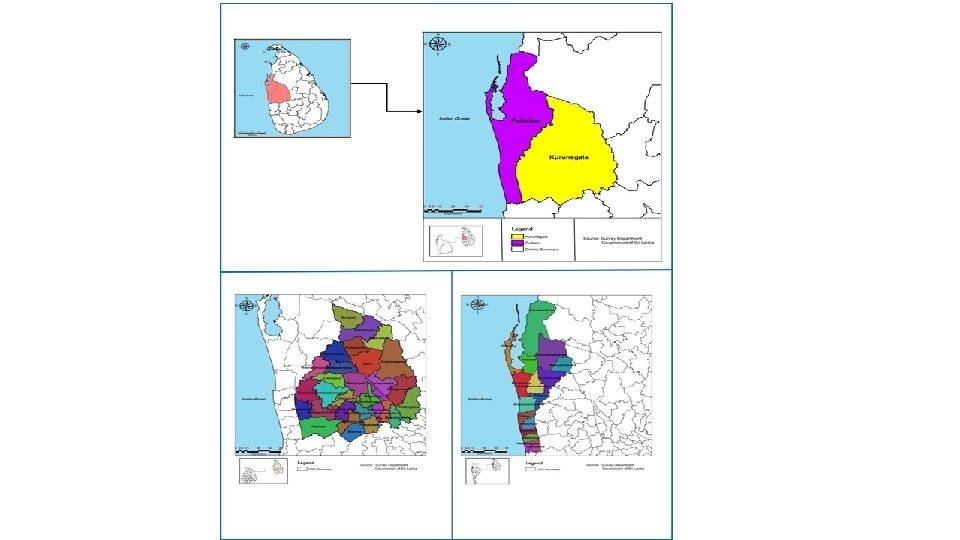

Kurunegala DS divisions Puttlam DS divisions 1. Giribawa 16. Bamunakotuwa 1. Puttlam 2. Galgamuwa 17. Katupotha 2. Mundal 3. Ehetuwewa 18. Panduwasnuwara 3. Wennappuwa 4. Polpithigama 19. Bingiriya 4. Dankotuwa 5. Ambanpola 20. Pannala 5. Mahawewa 6. Maho 21. Udubeddawa 6. Madampe 7. Kotavehera 22. Kuliyapitiya West 7. Chilaw 8. Rasnayakapura 23. Kuliyapitiya East 8. Nattandiya 9. Nikaweratiya 24. Narammala 9. Arachchikattuwa 10. Ganewatta 25. Kurunegala 10. Kalpitiya 11. Wariyapola 26. Mallawapitiya 11. Anamaduwa 12. Kobeigane 13. Ibbagamuwa 27. Mawatagama 28. Polgahawela 12. Karuwalagaswewa 13. Mahakumbukkadawala 14. Rideegama 29. Weerambugedara 14. Pallama 15. Maspotha 30. Alawwa 15. Vanathawilluwa 16. Nawagaththegama

Mf. RD – Managing for Development Results • An approach focusing on performance management and effective and efficient results delivery • It focuses on achievement of outputs, outcomes and impacts
 is the tool to")
RBM – Results Based Management • RBM (Results Based Management) is the tool to achieve Mf. DR • RBM is a management approach aimed to improve management effectiveness and accountability in achieving results Mf. RD RBM

RBM Life-Cycle Approach Need assessment Stakeholder analysis Problem tree Objective tree Log-frame M&E plan Baseline study Monitoring Mid-term review Mid-term evaluation Final evaluation Use of evaluation Source: UNDP. (2009). Handbook on Planning, Monitoring and Evaluating for Development Results. 8

RBM focuses achieving defined and measurable results and impact • • • A management strategy focused on achieving RESULTS With processes and inputs for desired RESULTS Ensure accountability for RESULTS Monitoring the progress towards RESULTS Assessment and reporting on the performance of the expected RESULTS

Why need RBM? • Competition for Limited Public Resources • Maximum Utilization • Maximum value for money spent on development projects Source: Greg Armstrong. RBM Training (http: //www. rbmtraining. com) 10

• RBM represents a shift in focus: • From INPUTS and ACTIVITIES to OUTPUTS and OUTCOMES (and IMPACTS) • It is a shift from Compliance to Results How much money was spent on road building? To what extent were the roads used What effect did the increased number of roads have on the local economy?
 • The core of RBM is the results")
RBM Results Ladder (or Results Chain) • The core of RBM is the results ladder or the results chain Impact Outcomes Outputs Activities Inputs Activities Outputs Outcomes Impacts

What is RBM Results Chain n The levels of results: n Short-term results or outputs; outcomes; and, n Longer-term results or impact. n n Medium-term results or Linked together: Results Chain. Source: Support to the Implementation of the Action Plan (SIAP) -2007: Results-Based Management: Logical Framework Approach 13
 • Activity: Actions")
Activities & Inputs • Inputs: Resources (human, material, financial and other) • Activity: Actions (or a set of tasks) that need to be carried out to produce an output (e. g. training, counseling, treatment etc. ) by mobilizing inputs • Task: A sub-set of an activity. (e. g. curriculum preparation, patient registration)

Definitions & Relanships Impact Outcome Output q Positive or negative or Both, q Primary or secondary or both q Long-term effects produced by a development intervention o Directly or Indirectly or both , o Intended or Unintended or both. The likely or achieved short-term and medium-term effects of an intervention’s outputs. The products and services resulted from the completion of activities within a development intervention.

OUTPUTS: Within control • Outputs are generally regarded as the goods and services produced by a program towards achieving one or more outcomes Example: • Knowledge and skills gained by farmers These are immediate results as a consequence of activities

OUTCOME: Uncontrollable • The changes or effects of the outputs produced by a program. • Outcomes are typically associated with each program/project. • Each program/project is expected to produce one or more outcomes that are directly linked with the needs/ problems of its beneficiary group/s. Example: • Improved income for farmers • Improved pass rates in education system • Increased trade or economic activities

IMPACT: Long term macro level • The changes or effects that take place as a consequence of one or more outcomes. • Impact is typically a shared result contributed to by one or more outcomes arising from one or more programs. • Impact may be long or medium term but not necessarily. • It is more of a follow-through consequence of one or more outcomes rather than strictly timebound Example: • Improved quality of life of farmers • Improved GDP Long term effects that are the logical consequence of the achievement of the outcomes

Hierarchy of RBM Terms Impact Sustainable improvements in society or well-being of people Outcome Output Activities Input Source: SIAP. (2007). Results-Based Management: Logical Framework Approach Changes in behavior or improvements in access or quality of services/resources Products of the project/ program activities Activities done by a project/program Resources needed to undertake activities 19

THE RESULTS CHAIN Source: Results Framework and M&E Guidance Note, World Bank, 2013

21

Types of Change along with Results Impact Changes in the lives of people Institutional Change: Outcomes values, laws – associated with institutional performance, new institutions Behavioural change: new attitudes, practices Outputs Operational Change: Products and services – knowledge, skills

Results-Chain Inputs Activities Outputs Outcomes Indicators Assumptions/Risks Impact

RBM &RESULTS Inputs Activities RESULTS Results Outputs Outcomes Impacts Inputs Activities How What we want Why

Key RBM Terms in Results Chain Activities Inputs Medium-term Outcomes Short-term Outputs Intermediate users Long-term Impact Society End users Results-chain in accordance with Results-Based Management (RBM) Inputs Activities Expected outputs Short-term outcomes Medium term outcomes Source: SIAP. (2007). Results-Based Management: Logical Framework Approach Impacts 25

RBM differs from the traditional management approach with regard to perception of results Traditional Management Managing for development results Impact ? Outcome √ Output ? Activity √ Input √ Activity Input
 Development Project Traditional Focus Performance Focus under RBM Schools")
RMB Approach & Focus (Example) Development Project Traditional Focus Performance Focus under RBM Schools Construction Vaccination Program Training on MFDR Number of Schools Completed Increased enrolment Timeliness of Construction Reduced dropout rate Expenditure against budget Improved academic performance Number of persons vaccinated Reduced disease incidence Area/regions covered Reduced mortality rate from Expenditure against budget disease Reduced social costs Number of officials trained Increase knowledge on RBM Number of RBM workshops Improved dev. planning and held results

• RBM can be carried out using various tools such as: • Results framework • Stakeholder Analysis • Problem Tree • Objective Tree Analysis

Results framework

Results Framework – Internal Logic Impact Outcome Output Activities Inputs

Result-Based Strategic Planning : “Designing from Right to Left” Strategic Planning 4 3 2 1 Resources/ Inputs Means/ Processes/ Activities Objectives/ Outputs Goals/ Outcomes Indicators, Time Frame, Quantitative, Qualitative Human Resource System, Capital System and Implementation Factors, IT System Implementation Planning Steps, Time Frame, Budget, Rules and Regulation

Examples for Results Framework: Health & Water Organization Domain Health Ministry Purpose Quality of life Wellness Thrust areas Key results area Outcome Preventive health Dengue Prevention Sustained Increased reduction in access to dengue nets STD/AIDS control NWSDB Wellness Free from water borne disease Safe drinking Construction Sustained water reduction in Maintenance water borne diseases Output Increased access to safe water supply

Stakeholder analysis
 • Those directly benefiting from the program or")
• Primary stakeholders (Target group) • Those directly benefiting from the program or project • Secondary stakeholders • Those having an interest or influence on what has been achieved (results)
 Power High power Low")
In RBM we focus on Stakeholder Analysis (using stakeholder matrix) Power High power Low Interest High interest Low Power Low power Low Interest High interest Interest

Problem Analysis & Objective Analysis through Problem Tree And Objective Tree

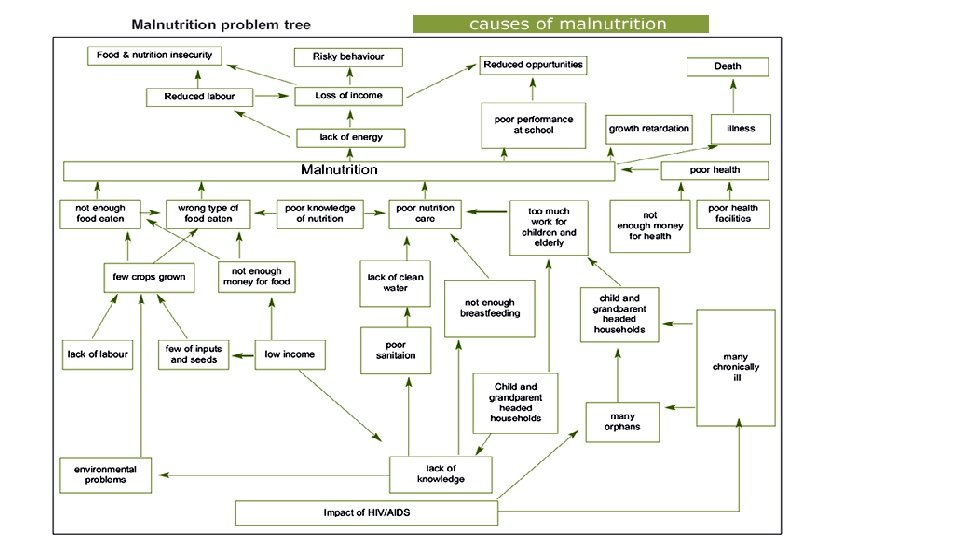
Problem Tree Purpose: • To find out major problems and their main causal relationships Output • Problem tree with cause and effect

PROBLEM TREE ANALYSIS
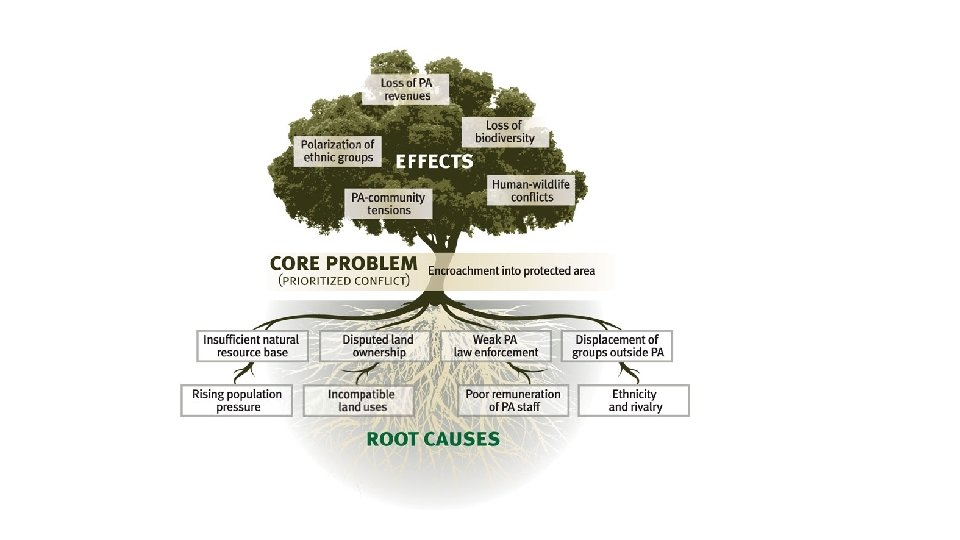

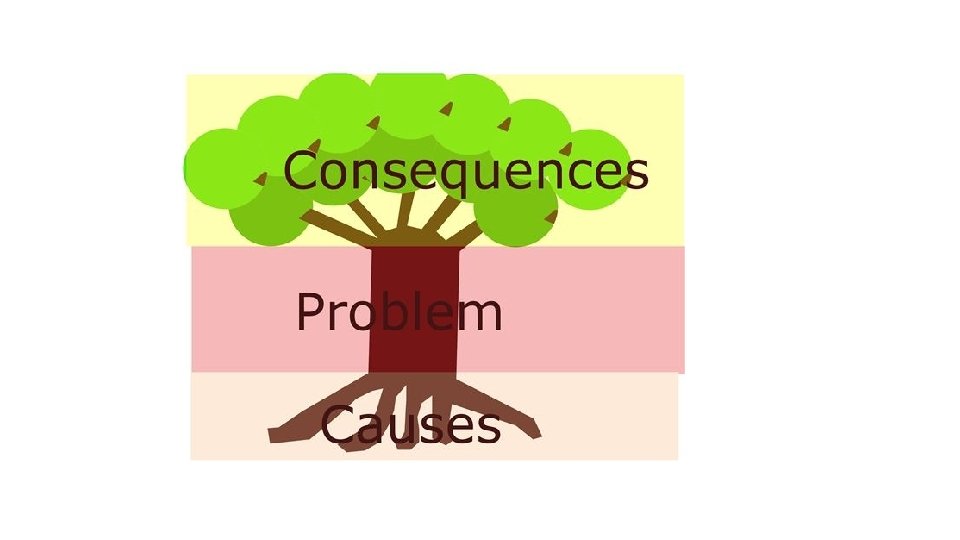
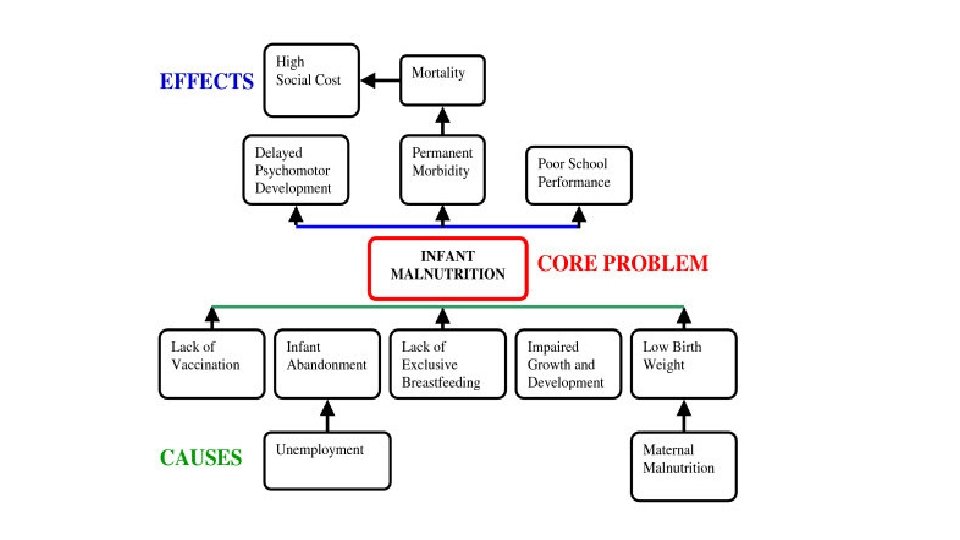
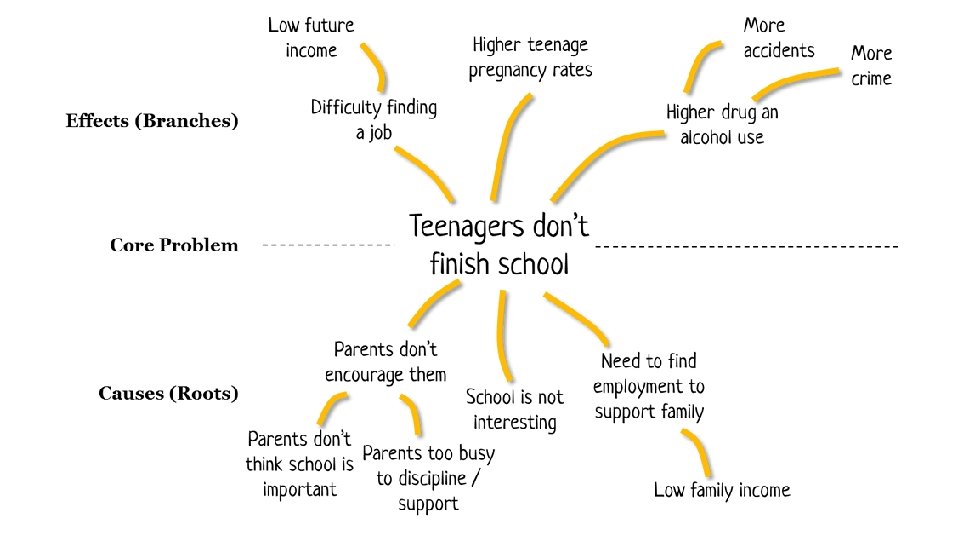
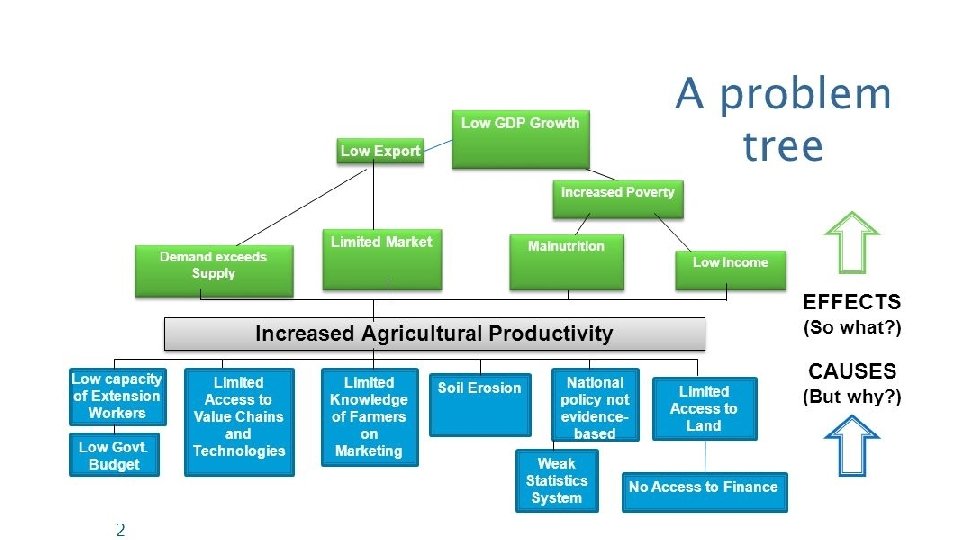
PROBLEM TREE Effekr Effects Focal Problem Causes

EXAMPLE on a PROBLEM TREE Bus company gets a bad reputation Effekr Disabled people High cost for hospital care People die and get injured Buses are delayed High number of bus accidents Careless busdrivers Stress Bad traffic situation Buses in poor condition Alcohol abuse Tight schedule Poor maintenance Old buses No maintenance routines Too few drivers and buses Weak management capacity at the bus company Roads in poor condition Poor maintenace Weak knowledge on manintenace Corruption

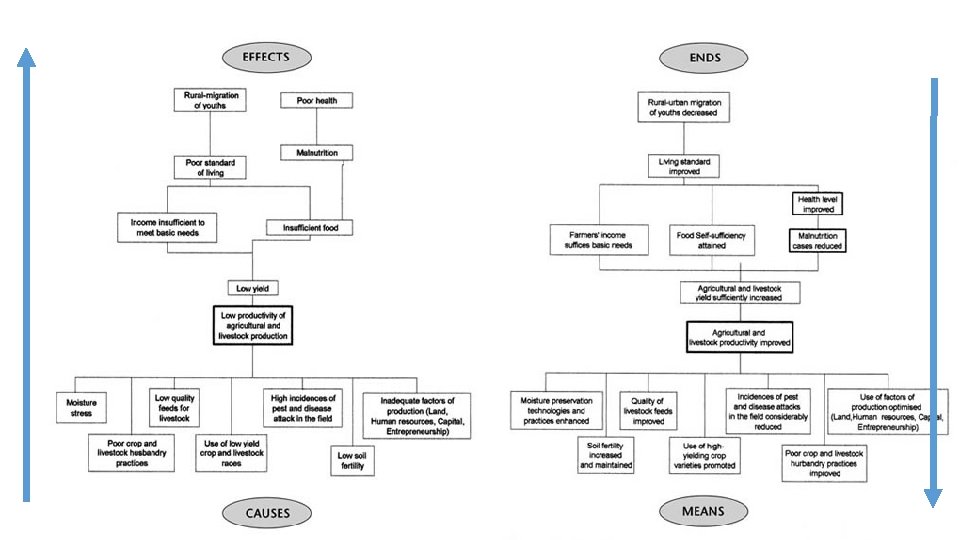
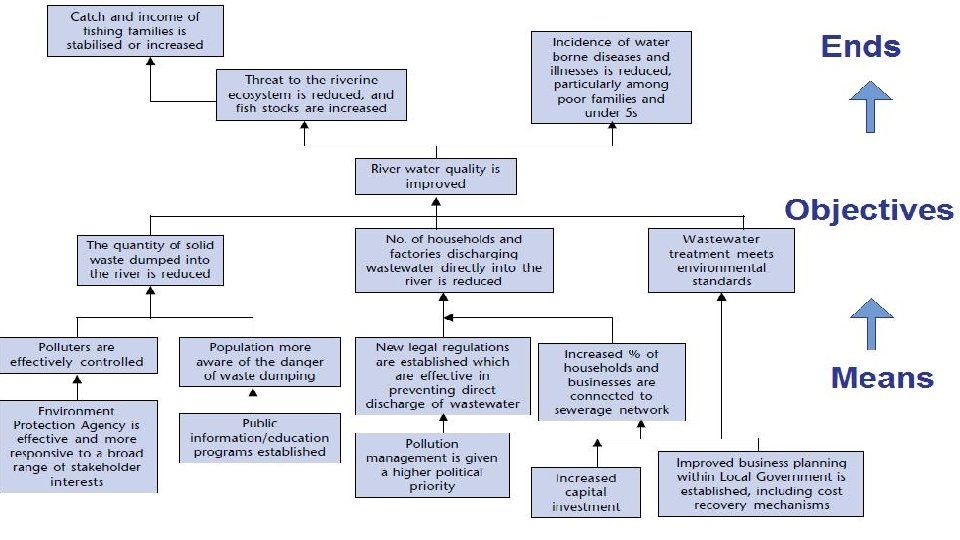
Objective tree • The objective tree is the opposite of a problem tree • Here the causes in the problem tree becomes means and the effects become ends

Outcomes Effects Core problems Causes Focal Problem Objective Outputs Objective

THE PROBLEM TREE THE OBJECTIVE TREE THE CONNECTION PROBLEM OBJECTIVE LEVELS ANALYSIS EFFECTS Goal FOCAL PROBLEM PROJECT PURPOSE/ OBJECTIVE CAUSES INTERMEDIATE OBJECTIVES ACTIVITIES

Ex. Problem tree of a key area of health sector Poor heath status of the community Poor health status of women Increased maternal mortality Difficult access to clinics situated in town areas Untrained traditional birth attendants

Ex. Objective tree of a key area of health sector Improved heath status of the community Improved health status of women Reduced maternal mortality Improved access to clinics situated in town areas Competent traditional birth attendants

DIFFERENT TERMS FOR OBJECTIVES AND RESULTS WITHIN RESULTS-BASED MANAGEMENT PROBLEM OBJECTIVE LEVELS RESULTS LEVELS ANALYSIS (when planning) (when monitoring) EFFECTS MAIN PROBLEM CAUSES ACTIVITIES Goal PROJECT PURPOSE/ OBJECTIVE INTERMEDIATE OBJECTIVES EXPECTED OUTPUTS IMPACTS MEDIUM TERM OUTCOMES SHORT TERM OUTCOMES OUTPUTS

Make it logic when planning, Example Overall objectives: The project will contribute to increased trade and increased GDP in country X Project objective: Increased efficiency in the customs service in country X Expected results: 1. Enhanced competence on custom related trade facilitation mesures among customs service staff 2. Strengthened management capacity in the Customs service 3. Improved customs clearence routines Expected Outputs: 1. 500 staff members trained on trade facilitation 3. New manuals for customs clearance developed Activities: Ex. some activities 1. 1 Develop a training , 1. 2 Implemeted a pilot training for 20 staff , 1. 3 Evaluate the training

Writing objective statements Objective hierachy Overall objectives Example of how to write objectives n To contribute to increased GDP in country X ----------------Project objective (mid-term): -----------------Expected Results: ------------n Improved service from the state sector to exporting companies in country X --------------------n 1. Enhanced knowledge among officials on Trade facilitation and Rules of Origin 2. Improved trade standards established and effectively enforced in the country. ------------------- (long term) (Short term objectives) ---------------Activities: Activities for expected result 1: 1 Conduct a baseline survey of the vocational training and a need assessment (knowledge gaps) 1: 2 Analyse the findings of the study 1: 3 Make a curriculum for trainings based on the findings 1: 3 Prepare tender documents for new training programs 1. 4 Select trainers /providers of the vocational trainings 1: 5 Implement pilot trainings 1. 6 Follow-up /monitor of the trainings , analyze results and if needed change the trainings 1: 7 Run a full scale training program for health care staff 1: 8 Evaluate the program after 3 years, and analyze, if needd repeat part of the training program

57
: Results, Outcomes and Outputs Eg: Sector: Teaching Sub Sector: Post garduate")
Results Framework (RFW): Results, Outcomes and Outputs Eg: Sector: Teaching Sub Sector: Post garduate Teaching Thrusted Area 1: Quality Key Result Area 1: RISKS & ASSUMPTION RESPONSIBILITY DATA SOURCE OUTCOME 1 OUTPUT 1. 2 OUTCOME 2 OUTOUT 2. 1 OUTPUT 2. 2 OUTOUT 2. 3 2023 2022 STATUS OF THE BASE YEAR 2018 2021 (Y 3) UNIT OF MEASURE 2020 (Y 2) KEY PERFOMANCE INDICATORS (KPI) OUTCOMES OUTCOME 1 OUTCOME 2 OUTCOME 3 2019 (Y 1) STRATEGIC OUTCOMES/ GOALS ANNUAL TARGETS OUTPUTS
 Results Framework (RFW): Results, Outcomes and")
1. 9. Activity plan (activities under each outout) Results Framework (RFW): Results, Outcomes and Outputs Sector: Teaching Sub Sector: Post-graduate Thrusted Area 1: Quality Key Result Area 1: UNIT OF MEASURE STATUS OF THE BASE YEAR 2018 2019 (Y 1) 2020 (Y 2) 2021 (Y 3) 2022 2023 TOTAL BUDGET DATA SOURCE RISKS & ASSUMPTION RESPONSIBILITY Activity 1. 1. 1 Budget (input) Activity 1. 1. 2 Budget (input) Activity 1. 2. 1 Activity 1. 2. 2 Activity 1. 2. 3 OUTCOME 2 OUTPUT 2. 1 Activity 2. 1. 1 Activty 2. 1. 2 ACTIVITIES DURATIONS (YEARS) ANNUAL TARGETS OUTCOMES 1 OUTPUT 1. 2

Different terminology for objectives used by different projects and donors, choose what’s best for you Objectives Think of the time – line, the logic DFID Long-term objectives Goals Overall Objectives Medium-term objective Project Purpose Project Objective Outcome Project Outcome Short-term Objectives Immediate objectives Expected Results Intermediate Outcomes EU (Great Britain) RBM World Bank (Results. Based Management) Impact Outputs Impacts/ Development Objectives Terminology differs, depends on the project owners

Implementation & Evaluation • During the implementation phase, there are things we must do: • Update the stakeholder analysis to check that there are no new stakeholders who might influence project success or who should be invited to participate. Also, the circumstances of stakeholders identified at the beginning of the project may change. • Reassess the risks to the project. • Monitor and review the progress the project is making towards its objectives. • Feed the learning from monitoring and reviewing back into the project design. • Go back to the log frame and make adjustments or improvements where appropriate. 61

• To measure performance, we need to address: • RELEVANCE Does the project address needs? • EFFICIENCY Are we using the available resources wisely? • EFFECTIVENESS Are the desired outputs being achieved? • IMPACT Has the wider goal been achieved? What changes have occurred that help beneficiaries? • SUSTAINABILITY Will the impact be sustainable? 62

• MONITORING is done continuously to make sure the project is on track, for example, every month. • REVIEWING is done occasionally to see whether each level of objectives leads to the next one and whether any changes need to be made to the project plans, for example, every six months. • EVALUATION is usually done at the end of the project to assess its impact. 63
 Occasionally (Middle")
Monitoring Reviewing Evaluation When is it done? Continuously (life of the project) Occasionally (Middle or et the end) Occasionally (At the end or beyond) What is measured? Efficiency (Use of activities, output, assumption) Effectiveness & relevance (Achievement of purpose) Impact & sustainability (Achievement of purpose & goal) Who is involved? Staff within the organization Staff outside consultants People from outside, consultants Internal & external documents (annual reports & consultants reports) Internal & external documents (assessment reports & consultants reports) What sources of Internal documents information are needed? Who use the results? Managers & project Managers, staff, donors, staff donors, beneficiaries, others Who are the results used? To make project level minor changes Change in policies, strategies, future works Major change in policies, strategies, future works 64

Monitoring Summary Indicators Evidence Assumption Goal Purpose Output Activity 65

Where possible, primary stakeholders should take part in monitoring, reviewing and evaluation. This is to ensure that they have strong ownership of the project so that benefits are achieved and sustained. Reviewing Summary Indicators Evidence Assumption Goal Purpose Output Activity 66

Evaluation Summary Indicators Evidence Assumption Goal Purpose Output Activity 67

Monitoring: Summary Reports Project Title: ----- Location ----, Period Covered: ----- , date prepared, ……. . Project Structure Indicators Achievements of Progress Prepared by …. . Comments & Recommendation Rating Activity Output Reviewing: Summary Reports Location ----, Period Covered: ----- , date prepared, ……. . Project Structure Indicators Achievements of Progress Prepared by …. . Comments & Recommendation Rating Output Purpose Evaluation: Summary Reports Location ----, Period Covered: ----- , date prepared, ……. . Project Structure Indicators Achievements of Progress Prepared by …. . Comments & Recommendation Rating Purpose Goal 68

Financial reporting Description Budget Actual Spending Variance Remarks Adm. Cost Transport cots Etc Variance could be + or -, then explain why (remarks) 69
, or DSD then possible sectors")
GROUP ACTIVITY 1. Select a sector (of a DSD), or DSD then possible sectors 2. Design a vision, goals 3. PROBLEM: Identify one focal problem, e. g. You decided, but some 4. STAKEHOLDER ANALYSIS: Identify stakeholders in the sector proposals (Beneficiaries/target group, Implementers, local financing agents, decision makers) List them. 5. PROBLEM ANALYSIS: Identify reasons/causes to the focal problem and effects. Make a brief problem tree, write notes. 6. OBJECTIVES: Set at least two expected results (short-term objectives), one project objective and two overall objectives. Formulate them “SMART”. 7. ACTIVITIES: Find solutions/activities to achieve result 1 -3. Number the activities (1: 1, 1: 2, 1; 3 etc. ) and connect them to each expected result.
 Industrial Sector Professor S. P. Premaratna")
NWDP (5 year) Industrial Sector Professor S. P. Premaratna
 • Population • 95. 5% rural sector • 4. 1% Urban")
Industrial Sector (NWP) • Population • 95. 5% rural sector • 4. 1% Urban • 0. 4 % Estate • Employment • 42% Services sector • 29 % industrial sector • 28. 7 Agriculture Sector.

Industrial Division No. of persons establishments engaged Other mining and quarrying 156 1093 Manufacture of food products 386 15156 Manufacture of textiles 1533 1866 Manufacture of wearing apparel 210 22115 Manufacture of leather and related products 26 46857 Manufacture of paper and paper products 8 1346 Manufacture of basic pharmaceutical products and pharmaceutical preparations 5 5202 Manufacture of other non-metallic mineral products 388 5822 Manufacture of fabricated metal products (except machinery and equipment) 55 2201 Manufacture of furniture 62 346 Other manufacturing 47 1020 Total 3215 106340

District Number of Establishments Total Micro Small Medium Large Kurunegala 86, 788 93. 30% 6. 00% 0. 60% 0. 10% Puttalam 44, 894 92. 60% 6. 70% 0. 60% 0. 10% District Kurunegala Puttalam Total Number of Persons Engaged Micro Small Medium Large 211, 613 55. 30% 18. 00% 9. 90% 16. 80% 106, 288 57. 70% 20. 90% 10. 80% 10. 60%

Industrial Development Areas v Coconut & coconut based industries v Tile industry revitalization v Rice industry v Dairy processing v MSME development v Handloom Industry v Several natural industrial estate

Problem, Issues, and Root Causes Area Inputs Enabling environment Use of new technolgy Marketing Production process Major problem High import dependency Lack of required labour Lack of utility services Hugh input cost High transaction cost High production cost Poor coordination Many red-tape Less adoption of new technologey Low Exports Low value creation
 quality")
Root Causes A A. Issues relating to competitiveness of the industrial Sector: (1) quality of products, (2) high cost of production, (3) small domestic markets, (4) limited industrial linkages (5) lack of basic operational management knowledge/expertise, (6) lack of support in funding and research and development (market and technical), (7) complicated export market procedures, (8) limited economic activities at the local level.
 less productive operational assets/methods, (2)")
Root Causes B B. Productivity and structural limitations: (1) less productive operational assets/methods, (2) insufficient use of new technology, (3) limited room for efficient operational levels, (4) insufficient management and professional know-how, (5) inadequate professional services (6) inefficacy labor (7) insufficient access to information
 Most industries particularly SMIs")
Root Causes C C. Issues on Access to Markets: (1) Most industries particularly SMIs in the province sell locally, to final consumers. , (2) Individuals and households are the main users of the industries’ products, mostly from the poor and middle classes; only few cater to volume buyers or can reach foreign markets, (3) sub-contracting and business networking is not exploited, (4) e-businesses can be hardly seen, (5) some marketing problems are linked to other weak points including scarcity of funding and low-technology levels, and unavailable market information and services, especially on good packaging, distribution and shipping.
 high transaction costs, (2) unfaviourabe")
Root Causes D D. Issues related enabling environment: (1) high transaction costs, (2) unfaviourabe rules and regulations, (3) lack of coordination amoung supporting institutions, (4) unnecessary burucarcy (5) lack of quality infrastructure, (6) negative attitudes, and (7) Long and many procedures.

1. Sector Vision, mission and sector objectives- Industrial Sector Vision: Globally competitive and sustainable industrial, enterprise and SME sector Mission: To create an enabling environment for a globally competitive, sustainable Industrial, enterprise and SME sector through improve productivity, efficiency and collaboration Strategic Objectives 1. To increase Job opportunities 2. To increase the contribution of the industrial sector to regional development 3. To promote regional entrepreneurship 4. To create a technologically advanced vibrant SME sector 5. To promote the competitive industries by facilitating regional wide action on collaboration, and commercialization 6. To expand exports

Three- interconnected approach of organizing strategies 1. Focused support to the individual Enterprise 2. Assistance to Identified Priority Industries 3. Evolving an operational and conducive environment for industries to set up, operate and succeed

Proposed Structure of 5 year plan: Purpose, Outcomes, Outputs and Activities Organization (responsible to Name of the organization: do) Domain Purpose Thrust areas Risk/ assumptions Any remarks Key results area s e i t i Outcome v i t c A nd a s t u p t u O , es m o Output c t u O , e os p r u P : n a l p ar e y 1 5 f o e r u ct u r t S d e s o p 2 Pro Activities 1 2

84

85

86

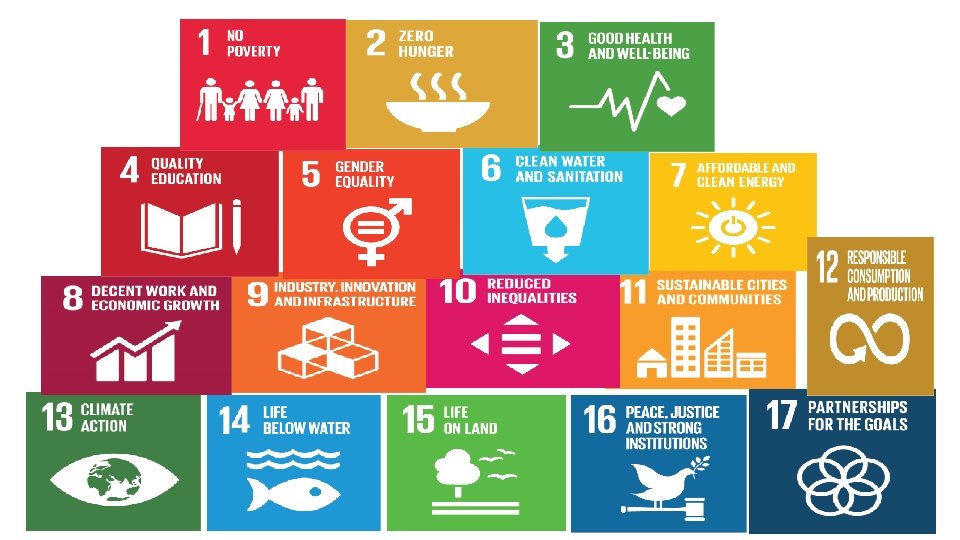
Each goal is important in itself … And they are all connected

r o t c e S t l c a a i p r t s m i u t d c e In r i d n i d n a t c e r i D

r o t c e S l a i r t t s c u a d p n I m i t s e t a e gr

91

92

Enterprise Sri Lanka Programme • 3. 1 SME Development • 3. 2 Promoting Green Energy • 3. 3 Empowering Farmer Community and Poverty Reduction • 3. 4 Empowering Youth • 3. 5 Empowering Women • 3. 6 Promoting Exports and Supply Chain Development • 3. 7 Promoting Tourism Sector: Add a footer 93

94

Trusted areas Impact Key results SDGs targeted Export and export linkages Increased export Export led SMIs 1, 2, 8, 9, 10, earning Investment 12, 14, 16, 17 Increased industrial Improved enabling 1, 2, 3, 5, 8, 9, outputs environment 10, 12, 14, 16, 17 Green (sustainable) Improved green Environment friendly 1, 2, 3, 6, 7, 8, businesses industries 9, 10, 12, 13, 14, 15, 17 Value addition Increased value addition Value creation and 2, 5, 8, 9, 10, from industrial sector 12, 17 innovation Women and youth Empowered women and Strengthening Female 1, 2, 5, 8, 9, 10, entrepreneurship youth through and youth 12, 14, 17 entrepreneurship 95

Sector: Industry Sub Sector: MSMI Trusted Area 1: Exporting and Export linkages Key Result Area A: Export led SMIs 17 SDGs targeted: 1, 2, 8, 9, 10, 12, 16, 17 SDGs targeted RESPONSIBILITY 2023 Y 5) ASSUMPTION 2022 (Y 4) 10 10 12 1, 8, 9, 17 OUTCOME A 2: Enhanced quality of products No of accredited products - 4 8 8 8 2, 8, 9, 16, (KPI) RISKS & 2021 (Y 3) 6 UNIT OF 4 KEY No of export based industries No. OUTCOME A 1: Increased export based MSMIs GOALS 2020 (Y 2) DATA SOURCE ANNUAL TARGETS 2019 (Y 1) BASE YEAR 2018 STATUS OF THE MEASURE INDICATORS PERFOMANCE OUTCOMES/ STRATEGIC Strategic Objectives covered: OUTCOMES No 17 OUTCOME A 3: Increased use of E-business No of industries in e-business % 20% 30% 45% 50% 8, 9, 12, 16, (exports) 17 OUTPUTS OUTCOME A 1: Increased export based MSMIs OUTPUT A 1. 1: increased business links with exporters No of firms link to export firms No. OUTPUT A 1. 2: Increased awareness on potential export Level of awareness among business areas % 4 6 8 8 10 30% 50% 70% 95% SMIs OUTCOME A 2: Enhanced quality of products OUTOUT A 2. 1: increase awareness among producers No of producers No 30 30 30 OUTPUT A 2. 2: Improve certified producers No of producers No 10 20 30 30 30 OUTCOME A 3: Increased use of E-business OUTOUT A 3. 1: Improve awareness of E-business No of producers No 30 96
 97")
Activity plan (activities under each output) 97

Sector: Industry Sub Sector: Export and SMIs Trusted Area 1: Exporting and Export linkages Key Result Area 1: Export led SMIs 17 SDGs targeted: 1, 2, 8, 9, 10, 12, 14, 16, 17 RESPONSIBILITY 2023 Y 5) ASSUMPTION 2022 (Y 4) 1 1 No of fairs No 1 1 1 Activity 1. 1. 3: link SMEs to exporter firms No of links No 1 5 5 Activity 1. 1. 4: Establish one-stop shop for No of establishment No 0 1 1 - - - RISKS & 2021 (Y 3) 1 UNIT OF 0 KEY No No of forums 2020 (Y 2) DATA SOURCE TOTAL BUDGET ANNUAL TARGETS 2019 (Y 1) BASE YEAR 2018 STATUS OF THE MEASURE INDICATORS (KPI) PERFOMANCE ACTIVITIES Strategic Objectives covered: OUTCOMES 1: Increased export based SMIs OUTPUT 1. 1: Increased business links with exporters Activity 1. 1. 1: Conduct export promotion forums Activity 1. 1. 2: Organize export fairs /exhibitions export market support OUTPUT 1. 2: Increased awareness on potential export business areas Activity 1. 2. 1: conduct market studies No of studies No 0 1 Uo. W Activity 1. 2. 2: Export awareness programs No of programs No 0 1 1 1 EDB Activity 1. 2. 3: Training programs related export No of programs No 0 2 2 2 98 EDB

OUTCOME A 2: Enhanced quality of products OUTPUT 2. 1: increase awareness among producers Activity 2. 1. 1: Develop a study methods and No of methods No 0 1 - - No of workshops No 0 0 4 4 Activity 2. 2. 1: Prepare a template for SMEs No of template No 0 1 Activity 2. 2. 2: Establish a system to award No of system No 0 1 - - Activity 2. 2. 3: Establish quality testing centres No of centres No 0 1 1 - - - Activity 2. 2. 4: Award quality certificate No of products No 0 - 10 20 30 30 No of programs No 0 2 4 4 4 4 tools Activity 2. 1. 2: Conduct awareness workshop OUTPUT 2. 2: Improve certified producers certificates OUTCOME A 3: Increased use of E-business OUTOUT A 3. 1: Improve awareness of E-business Activity 3. 3. 1: Awareness programs on ebusinesses Activity 3. 3. 2: Training on e-business OUTPUT A 3. 2: Increase E-business focused websites Activity 3. 3. 1: Training on web maintenance No of programs No 0 5 5 5 Activity 3. 3. 2: Set up e-centres for MSM firms No of centres No 0 2 2 2 No 0 1 1 1 Activity 3. 3. 2: Exposure visits (maybe to India) No of visits 99
 Sector:")
Other Trusted and Key result Areas (similar t n e m n tables) Sector: Industry viro Sub Sector: Investment n e g n i l b na E : 1 ea Trusted Area 1: Enabling environment r A d Key Result Area B: Improve enabling environment e t s u r 17 SDGs targeted: 1, 2, 3, 5, 8, 9, 10, 12, 14, 16, 17 B. T Strategic Objectives covered: Sector: Industry Sub Sector: Sustainable Industries a e r A Trusted Area 1: Green Businesses d e t Key Result Area C: Environment friendly enterprises s u r T . C 17 SDGs targeted: 1, 2, 3, 6, 7, 8, 9, 10, 12, 13, 14, 15, 17 Add a footer e n i us B n ee r G 1: s e ss 100
 Sector: Industry t a re c")
Other Trusted and Key result Areas (similar tables) Sector: Industry t a re c e alu Sub Sector: Trusted Area D: Value creation Key Result Area D: Improve value addition 17 SDGs targeted: Strategic Objectives covered: n io T . D d e t s ru Sector: Industry a e Ar V : D o p Em h t u yo Sub Sector: Women and youth d n a n e Trusted Area E: Women and youth Empowerment m o W : E a e Key Result Area E: Increased women and youth entrepreneurs r A d e t s u r 17 SDGs targeted: 1, 2, 5, 8, 9, 10, 12, 14, 17 E. T Add a footer t n e m r we 101

Thanks
- Slides: 102


