Results Based Accountability Population and Performance Accountability Population

Results Based Accountability Population and Performance Accountability

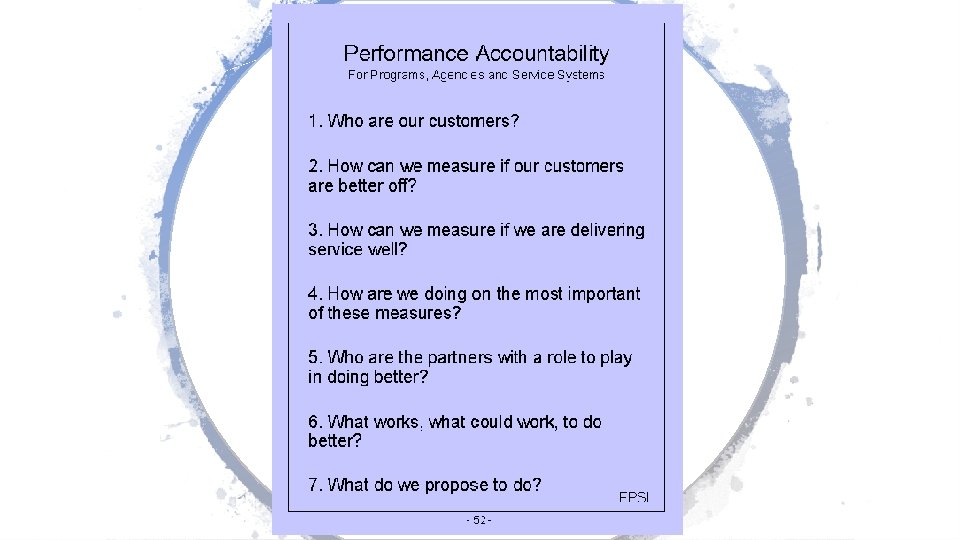
Population Accountability Performance Accountability • About the well-being of WHOLE POPULATIONS • About the well-being of CLIENT POPULATIONS • Requires broad partnerships that take collective responsibility for progress • Identifies how well did we run our program DEFINITIONS • Performance MEASURES (aka Performance Indicators) = How we know if programs and agencies are working • (Population-level) RESULTS = the conditions of well-being we want for our children, families, and communities • INDICATORS = How we measure these conditions; helps quantify achievement of a result [this is the population-level version of a performance measure] • Example: Are all of our children succeeding in life? DEFINITIONS • Example: Is our school performing well?

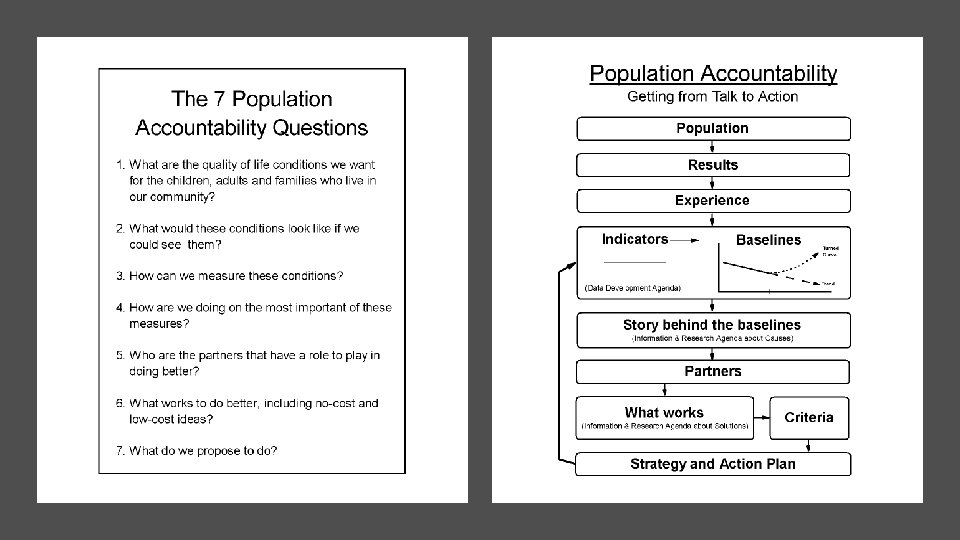
DEFINITIONS RESULT or OUTCOME Population A condition of well-being for children, adults, families or communities. healthy, Children ready for school, Children born healthy school Safe communities, Environment, Prosperous Economy communities Clean Environment INDICATOR or BENCHMARK A measure which helps quantify the achievement of a result. Performance babies, Percent ready at K entry, Rate of low-birthweight babies entry rate air quality index, index unemployment rate crime rate, PERFORMANCE MEASURE A measure of how well a program, agency or service system is working. 1. How much did we do? Three types: 2. How well did we do it? 3. Is anyone better off? = Customer
 Experience : Measure: Inches of Water Not")
Leaking Roof (Results thinking in everyday life) Experience : Measure: Inches of Water Not OK ? Fixed Turning the Curve Story behind the baseline (causes): Partners: What Works: Action Plan:

POPULATION ACCOUNTABILITY

PERFORMANCE ACCOUNTABILITY

Output Input. Effect Effort Performance Measures Quantity Quality How much service did we deliver? How well did we deliver it? How much change / effect did we produce? What quality of change / effect did we produce?

Education Quantity Quality How much did we do? How well did we do it? Number of students Studentteacher ratio Effort Effect Is anyone better off? Number of high school graduates Percent of high school graduates

Not All Performance Measures Are Created Equal Quality Quantity How much did we do? Least How well did we do it? Also Very Important Effort Effect Is anyone better off? Most Important

The Matter of Control Quantity Quality How much did we do? How well did we do it? Most Control Effort Effect Is anyone better off? Least Control PARTNERSH

Types of Measures Found in Each Quadrant How much did we do? # Clients/custom ers # Activities (by served type of activity) # # How well did we do it? % Common e. g. client staff ratio, workload ratio, staff measures turnover rate, staff morale, % staff fully trained, % clients seen in their own language, worker safety, unit cost % Activityspecific e. g. % timely, % clients completing activity, % correct and complete, measures % meeting standard Is anyone better off? % Skills / Point in Time vs. Point to Point Improvement Knowledge % Attitude / (e. g. parenting skills) Opinion % Behavior (e. g. toward drugs) (e. g. school attendance) % Circumstance housing) (e. g. working, in stable

HOW POPULATION & PERFORMANCE ACCOUNTABILITY FIT TOGETHER

THE LINKAGE Between POPULATION and PERFORMANCE POPULATION ACCOUNTABILITY Healthy Births POPULATION RESULTS Rate of low birth-weight babies Stable Families Rate of child abuse and neglect Children Succeeding in School Percent graduating from high school on time PERFORMANCE ACCOUNTABILITY Child Welfare Program # of investigatio ns completed # repeat Abuse/Negl ect % completed within 24 hrs of report % repeat Abuse/Negl ect CUSTOMER RESULTS Contributi on relationshi p Alignment of measures Appropriat e responsibil ity
- Slides: 15