Respiratory Physiology During Sleep BY AHMAD YOUNES PROFESSOR


Respiratory Physiology During Sleep BY AHMAD YOUNES PROFESSOR OF THORACIC MEDICINE Mansoura Faculty of Medicine

The respiratory system provides continuous homeostasis of Pa. O 2, Pa. CO 2, and p. H levels during constantly changing physiologic conditions. • This elegant system responds promptly to subtle variations in metabolism occurring in both health and disease. • During wakefulness, volitional influences can override this automatic control. • Modifications occur in the regulation and control of respiration with the onset of sleep. Furthermore, these changes differ significantly with specific sleep stages. • Consequences of these alterations of respiratory control can result in the pathogenesis of sleep-related breathing disorders and limit the usual respiratory compensatory changes to specific disease states.

Most patients who have arterial oxygen desaturation in the sleep center do so from apnea or hypopnea. • Patients with respiratory disorders may have sleeprelated arterial oxygen desaturation and/or hypoventilation without a significant number of discrete apnea or hypopnea events • These abnormalities in gas exchange can occur because the normal effects of sleep on ventilation and oxygenation are magnified by abnormal function of the lung, chest wall, respiratory muscles, or ventilatory control centers.

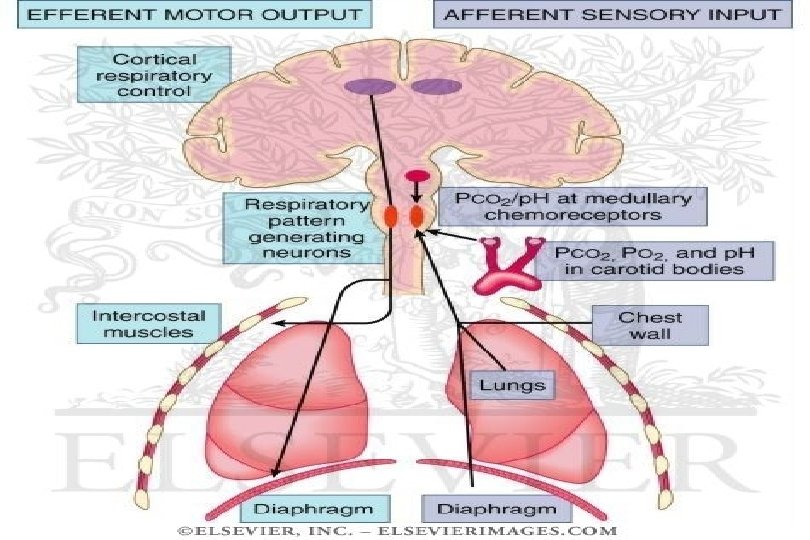
NORMAL CHANGES IN VENTILATION DURING SLEEP Sensors primarily include central and peripheral chemoreceptors, vagal pulmonary sensors, and chest wall and respiratory muscle afferents. Data from these sensors regarding dynamic oxygen and CO 2 levels, lung volumes, and respiratory muscle activity are continuously transmitted to the central controller. Within the medulla, the central controller generates an automated rhythm of respiration that is constantly modified in response to an integrated input from the various receptors. The controller modulates motor output from the brainstem to influence the activity of the effectors, namely respiratory motoneurons and muscles. These effectors then alter minute ventilation and gas exchange accordingly.

The central pattern generator is composed of predominately three neuronal groups 1 - Drsal respiratory group 2 - Ventral respiratory group 3 - Pontine respiratory group. – The dorsal respiratory group is in the ventrolateral subnucleus of the nucleus tractus solitarius. This neuronal group is primarily active during inspiration receiving input from pulmonary vagal afferents. Many of these neurons excite lower motor cranial nerves that dilate the upper airway prior to excitation of the contralateral phrenic and intercostal neurons in the spinal cord. This coordinated output must occur in the correct timed sequence to permit the movement of air through a patent airway.
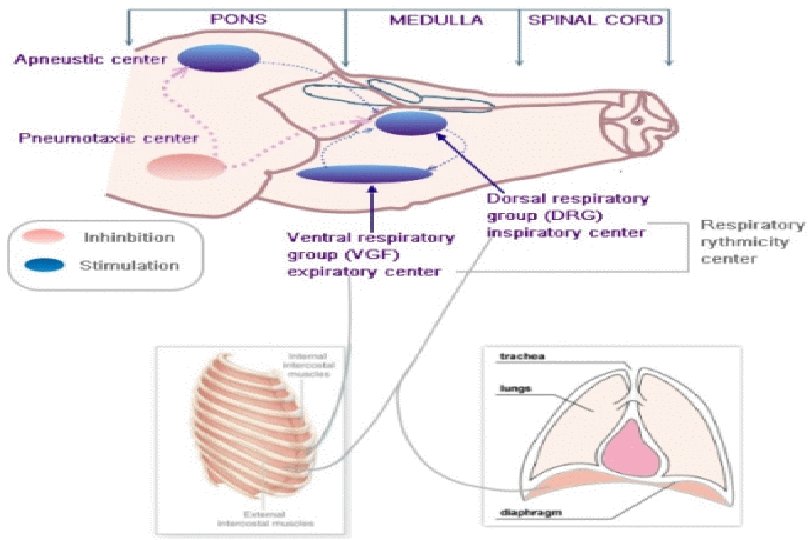

Ventral respiratory group • The ventral respiratory group is located in the ventral lateral medulla from the top of the cervical cord to the level of the facial nerve. • This group contains the Botzinger complex, the pre. Botzinger neurons, the rostral portion of nucleus ambiguous, and nucleus retroambigualis. • The Botzinger complex contains neurons that are active during expiration and inhibit inspiration. • The pre. Botzinger complex contains propriobulbar neurons that participate in generating the rhythm of respiration. • The caudal portion of this group is primarily composed of expiratory neurons that project to intercostal, abdominal, and external sphincter motor neurons.


Ventilatory control • The medullary centers respond to direct influences from the upper airways, intra-arterial chemoreceptors, and lung afferents by the 5 th, 9 th, and 10 th cranial nerves, respectively. • The dorsal respiratory group seems to be active primarily during inspiration. • The ventral respiratory group, contains both inspiratory and expiratory neurons. Ventral respiratory group output increases in response to the need forced expiration occurring during exercise or with increased airways resistance. • Respiratory effector muscles are innervated from the ventral respiratory group by phrenic, intercostal, and abdominal motoneurons.

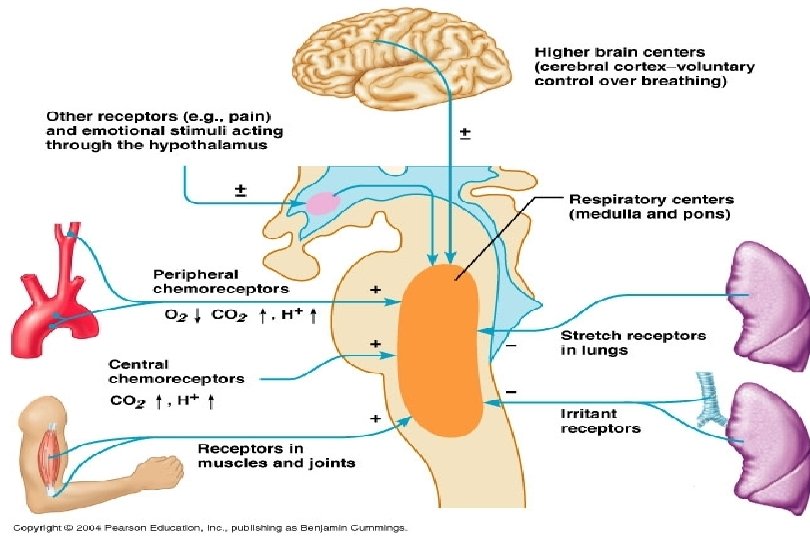
Pontine respiratory centers • The pneumotaxic center in the rostral pons consists of the nucleus parabrachialis and the Kolliker-Fuse nucleus. • This area seems primarily to influence the duration of inspiration and provide tonic input to respiratory pattern generators. • The apneustic center, located in the lower pons, functions to provide signals that terminate smoothly inspiratory efforts. • The pontine input serves to fine tune respiratory patterns and may additionally modulate responses to hypercapnia, hypoxia, and lung inflation. • The automatic central control of respiration may be influenced and temporarily overridden by volitional control from the cerebral cortex for a variety of activities, such as speech, singing, laughing, intentional and psychogenic alterations of respiration, and breath holding.


Central chemoreceptors • Central chemoreceptors, located primarily within the ventrolateral surface of medulla, respond to changes in brain extracellular fluid [H 1] concentration. • Other receptors have been recently identified in the brainstem, hypothalamus, and the cerebellum. • These receptors are effectively CO 2 receptors because central [H 1] concentrations are directly dependent on central PCO 2 levels. • Central [H 1] may differ significantly from arterial [H 1] because the blood-brain barrier prevents polar solute diffusion into the cerebrospinal fluid. This isolation results in an indirect central response to most peripheral acidbase disturbances mediated through changes in Pa. CO 2. • Central responses to changes in PCO 2 levels are also slightly delayed for a few minutes by the location of receptors in the brain only, rather than in peripheral vascular tissues.

Peripheral chemoreceptors • Peripheral chemoreceptors include the carotid bodies and the aortic bodies. • The carotid bodies, located bilaterally at the bifurcation of the internal and external carotid arteries, are the primary peripheral monitors. • They are highly vascular structures that monitor the status of blood about to be delivered to the brain and provide afferent input to the medulla through the 9 th cranial nerve. • The carotid bodies respond mainly to Pa. O 2, but also to changes in Pa. CO 2 and p. H. • They do not respond to lowered oxygen content from anemia or carbon monoxide toxicity.

Other afferent pathways • Pulmonary stretch receptors are located in proximal airway smooth muscles, and respond to inflation, especially in the setting of hyperinflation. Pulmonary stretch receptors mediate a shortened inspiratory and prolonged expiratory duration. • Additional input is also provided by rapidly adapting receptors that sense flow and irritation. J receptors are located in the juxtacapillary area and seem to mediate dyspnea in the setting of pulmonary vascular congestion. • Bronchial c-fibers also affect bronchomotor tone and respond to pulmonary inflammation.

Other afferent pathways • Afferent activity from chest wall and respiratory muscles additionally influences central controller activity. • Feedback information regarding muscle stretch, loading, and fatigue may impact both regulatory and somato-sensory responses. • Upper airway receptors promote airway patency by activation of local muscles including the genioglossus.

,")
During sleep • During sleep, the metabolic rate falls (hence, decreased CO 2 production), but this is offset by a proportionately greater fall in minute ventilation with the result that the Pa. CO 2 increases slightly. • The fall in ventilation is due to increased upper airway resistance and decreased chemosensitivity as well as the loss of the wakefulness stimulus to breathe. • The result is that the Pa. CO 2 rises and the Pa. O 2 falls slightly


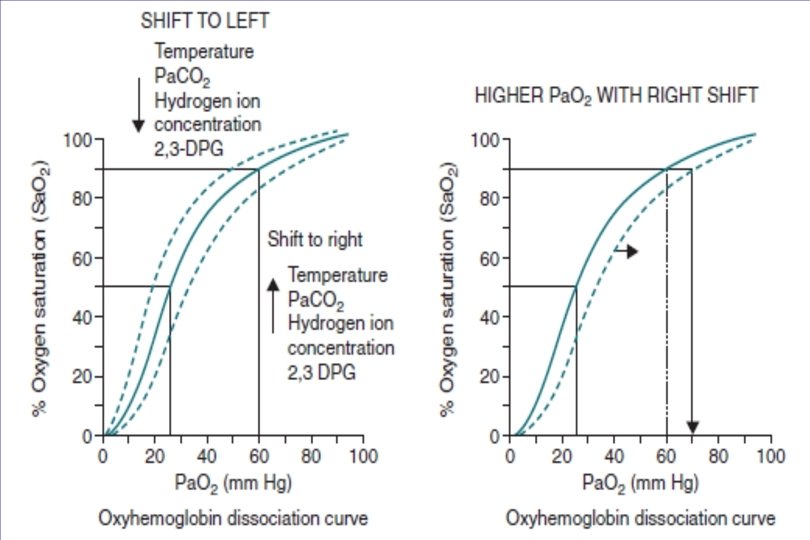
Because of the normal position on the flat portion of the O 2 Hb dissociation curve, there is little change in the Sa. O 2 as a result of the fall in PO 2 associated with sleep. If the baseline awake Pa. O 2 is lower, the fall in Sa. O 2 will be greater for the same drop in Pa. O 2. • In patients with lung disease and a lower awake PO 2, even a normal sleep-related drop in PO 2 will be associated with a larger decrease in the Sa. O 2. • The change in ventilation with sleep is due to a fall in Vt with minimal change in the RR. • During the transition from wake to stage N 1 and early stage N 2, the ventilation can be slightly irregular. However, in stable stage N 2 and stage N 3, the Vt and RR are nearly constant. • During REM sleep, ventilation is irregular with periods of decreased Vt associated with bursts of eye movements. • The FRC decreases from wake to sleep.

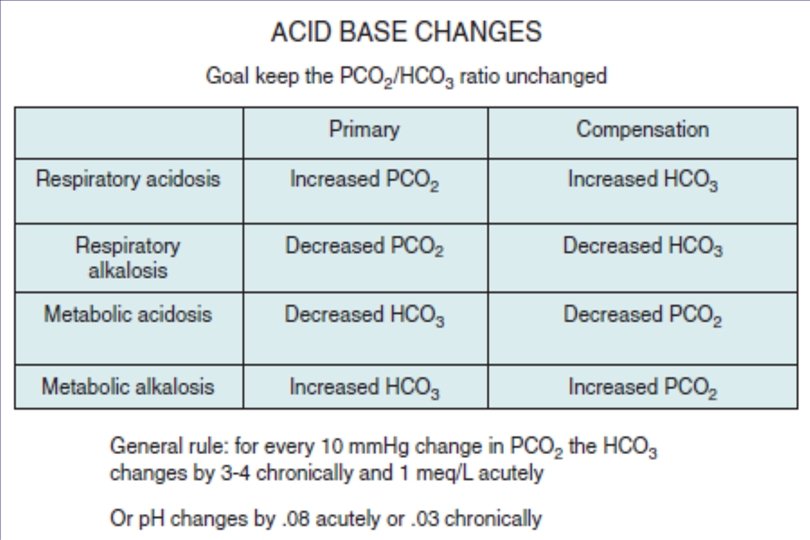
• During sleep, the hypercapnic ventilatory response and hypoxic ventilatory response are reduced during NREM compared with wake and decreased in REM sleep compared with NREM sleep. • Both hypoxia and hypercapnea may trigger arousals from sleep, resulting in a return to the more tightly regulated ventilatory control associated with wakefulness. • Arousal thresholds for hypercapnia range between 65 and 66 mm. Hg and do not vary consistently among the different sleep stages. • The threshold for arousal in response to hypoxia is more variable and seems less reliable. Severe oxygen desaturations in some individuals do not uniformly result in arousals.

Alveolar hypoventilation • Alveolar hypoventilation during wakefulness is defined as an Pa. CO 2 of 45 mm Hg or higher. • If the sleeping Pa. CO 2 is ≥ 10 mm Hg above the awake value, Sleep hypoventilation is said to be present. Hypoxemia is defined as a low arterial partial pressure of oxygen (Pa. O 2) relative to predicted values. A Pa. O 2 < 55 mm Hg while breathing room air is considered severe and an indication for chronic 24 -hour supplemental oxygen therapy. Milder degree of hypoxemia can be identified by comparing a Pa. O 2 with a predicted value for age. • A simple estimate of a normal predicted Pa. O 2 Pao 2=105 – 1/2 age (yr).

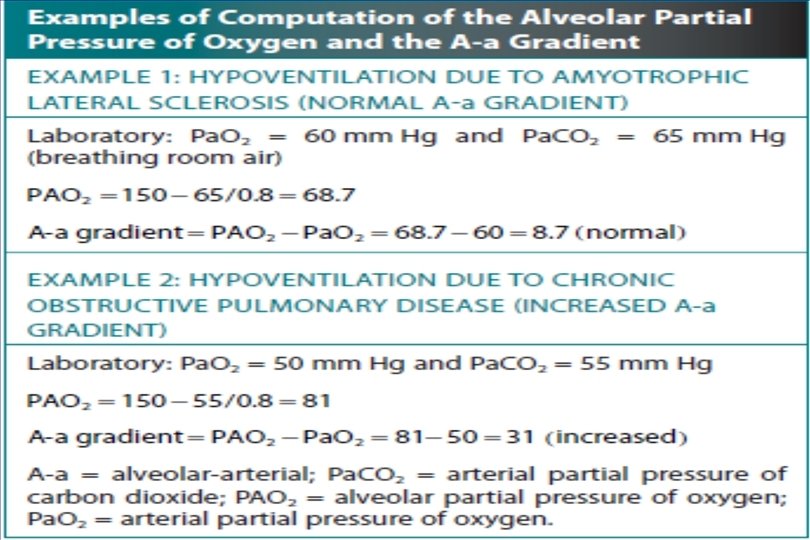
Alveolar gas equation • The alveolar gas equation allows one to compute the alveolar (ideal) partial pressure of oxygen (PAO 2) from the fractional concentration of oxygen in inspired gas (FIO 2), which is 0. 21 when breathing room air , and the Pa. CO 2. • The respiratory exchange ratio (R) is the CO 2 elimination divided by the O 2 uptake. At steady state, R is equal to 0. 8. • Computation of the PAO 2 and the A-a gradient PAO 2 = FIO 2(PB - PH 2 O) - Pa. CO 2/R R=VCO 2/VO 2 ( assumed to be 0. 8) VCO 2= CO 2 elimination. VO 2 = O 2 uptake • FIO 2 = 0. 21 (breathing room air), PB is the barometric pressure (760 mm Hg at sea level), and PH 2 O is the partial pressure of water vapor (47 mm Hg at 37°C).

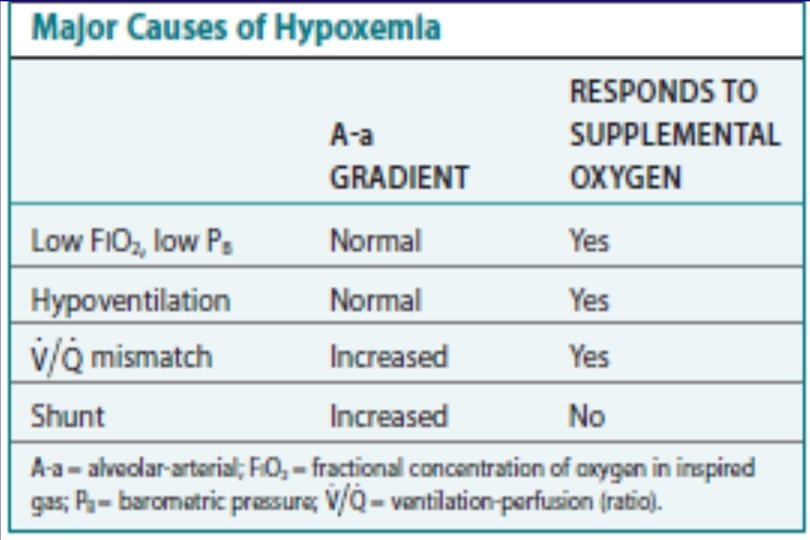
Alveolar gas equation • The A-a gradient is the difference between the ideal PAO 2 and the actual (measured) Pa. O 2. (usually <20 mm Hg). PAO 2 = 0. 21 (760 -47) – Pa. CO 2/0. 8 = 150 - Pa. CO 2/0. 8 A-a gradient = PAO 2 -Pa. O 2 In patients with hypoventilation of unclear etiology, calculating an A-a gradient can provide an important clue as to whether the hypoventilation is due to lung disease or due totally to hypoventilation. A normal A-a gradient in a patient with hypoventilation would suggest a disorder of ventilatory control or muscle weakness. In a patient with COPD with evidence of both hypoxemia and hypercapnia , the A-a gradient is increased. The hypoxemia is due to both V/Q mismatch and hypoventilation.


 will have a higher arterial partial pressure of")
patient with sickle hemoglobin (Hb S) will have a higher arterial partial pressure of oxygen (Pa. O 2) associated with a given Sa. O 2. Hb A = hemoglobin A.

FO 2 Hb = O 2 Hb X 100 /(O 2 Hb+RHb +COHb + Met. Hb) FO 2 Hb=O 2 Hb X 100 /Hbt • where O 2 Hb, RHb, COHb, and Met. Hb are the concentrations of the types of Hb and equal the total Hb concentration (Hbt). • For example, if the FO 2 Hb = 85%, FCOHb = 8%, Fmet. Hb = 1%, then the FRHb is 6%. • Using these numbers the Sa. O 2 equals 85 × 100/(85 + 6) or 93%, which is considerably higher than FO 2 Hb of 85%.

The FO 2 Hb is sometimes called the fractional saturation and the Sa. O 2 the functional or effective saturation. • The Pa. O 2 depends on the Sa. O 2, not the FO 2 Hb. That is, the oxyhemoglobin saturation curve expresses the ratio of oxygenated Hb to the total Hb available for oxygen binding. • Neither COHb nor Met. Hb binds oxygen. • The position of the oxyhemoglobin saturation curve is shifted to the left by the presence of COHb or Met. Hb.

The previous four fractions of Hb can be accurately measured by co-oximeters that measure the absorption of 4 or more wavelengths of electromagnetic radiation by blood. • This is possible because the four forms of Hb differ in their absorption for the different wavelengths of radiation. • In contrast, pulse oximetry uses only two wavelengths: 660 nm (red) and 940 nm (infrared) to measure the O 2 Hb and RHb. • COHb has about the same absorbance at 660 as O 2 Hb and, if present, increases the measured Sp. O 2 value.

In normal individuals, FCOHb is 2% or less but can be 8% or more in cigarette smokers. • Patients with SCD often have FCOHb values of 4% or more due to production of CO from chronic hemolysis. • In patients who are heavy smokers, it is important to remember that the Sp. O 2 may overestimate the FO 2 Hb.

If a patient has a lower than expected Sp. O 2 while awake in the sleep center, a number of possibilities should be considered including a faulty oximetry probe, poor signal quality due to poor perfusion, a shift in the O 2 Hb saturation curve or an abnormal Hb. • If oximetry issues are ruled out, an arterial blood gas is needed to determine whether hypoxemia is really present. • In this situation, co-oximetry analysis could also determine whether significant COHb or Met. Hb is present and determine a true Sa. O 2 and the fraction of Hb that is oxygenated.


PULMONARY FUNCTION TESTING • Pulmonary function testing is often needed to evaluate patients with a low awake Pa. O 2 (or Sa. O 2) or to determine the etiology of unexpected daytime hypoventilation or dyspnea on exertion. • Sometimes pulmonary function testing is ordered after a sleep study reveals an unexplained low sleeping baseline Sa. O 2 without discrete apneas or hypopneas. Therefore, some knowledge of pulmonary function testing can be very useful for the sleep clinician.

Cleaning Your Humidifier

Cleaning Your Equipment

OVD versus RVD OVD is associated with a reduced FEV 1/FVC ratio, whereas the ratio is normal or increased in RVD. In very mild disease, the FEV 1 may be normal but the FEV 1/FVC reduced. The RVD pattern of spirometry is characterized by a normal FEV 1/FVC ratio and a reduced FVC. American Thoracic Society criteria for a significant bronchodilator response include an increase in the FEV 1 or FVC by 12% AND an absolute increase of at least 200 m. L. A large improvement of 15% to 40% is suggestive of asthma. Patients with COPD typically have no response (predominant emphysema) or a modest response of 10% to 12% (predominant chronic bronchitis).

Cleaning Your Equipment

Cleaning Your Equipment

Obesity In obesity, the FRC is either reduced or reduced in relation to the RV. Therefore, in simple obesity, the most common pulmonary function finding is a reduced ERV. Usually, the TLC and RV are normal, as is the VC. In contrast, the obesity hypoventilation syndrome may be associated with reductions in the TLC and VC. The finding of a reduced TLC in a patient with severe obesity and OSA could be a clue that the obesity hypoventilation syndrome might be present.

Filter Maintenance


MUSCLE STRENGTH • Inspiratory muscle weakness causes a low TLC. Expiratory muscle weakness causes an increased RV. • Typically, muscle weakness affects both the inspiratory muscles (diaphragm and intercostal muscles) and the expiratory muscles (abdominal muscles) at the same time. • This results in a pattern of low TLC, high RV, and low VC

Maximum Inspiratory Pressure and Maximum Expiratory Pressure • The MIP is usually performed at RV, and the MEP is performed at TLC. • The published normal ranges are wide and vary considerably between studies. • For clinically significant changes in the FVC to begin to occur, the MIP is usually < 60 cm H 2 O. • An MEP less than 60 cm H 2 O is associated with a reduced ability to cough and clear secretions. • An American College of Chest Physicians (ACCP) Consensus group recommended NPPV for progressive neuromuscular disorders when the MIP was < 60 cm H 2 O (or FVC < 50% of predicted).
")
Respiratory Pressure Meter for measurements of (MIP/MEP)

- Slides: 54