
RESPIRATORY COMPROMISE Prevent the Preventable Brian D Berry
RESPIRATORY COMPROMISE: Prevent the Preventable Brian D. Berry Jr. , RN, BSN, CRNA, MS, MBA System Chief Nurse Anesthetist & Director of Perioperative Services Excela Health Adjunct Faculty University of Pittsburgh, PA
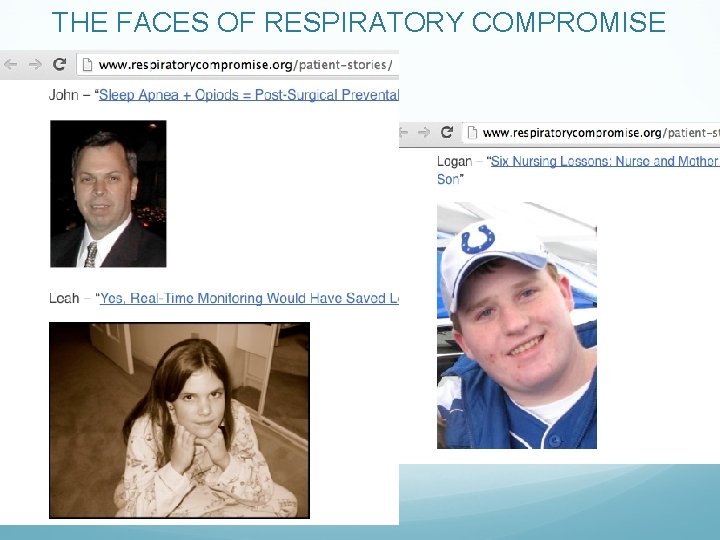
THE FACES OF RESPIRATORY COMPROMISE
Lecture Objectives Describe the impact of respiratory compromise from a cost as well as a morbidity and mortality perspective Explain the difference between monitoring oxygenation and ventilation Compare and contrast currently available monitoring techniques Review evidence-based recommendations on the use of respiratory monitoring and the impact on preventing postoperative respiratory compromise

THE PROBLEM
What is Respiratory Compromise? Respiratory Compromise is a state in which there is a high likelihood of decompensation into respiratory insufficiency, respiratory failure or death. - The respiratory compromise institute 1 “I define respiratory compromise as a state of pre-respiratory failure…It's something that’s subtle. It's an early stage along a pathway of decline. ” - Peter Marshall, MD Assistant Professor Yale University School of Medicine 1. http: //www. respiratorycompromise. org/
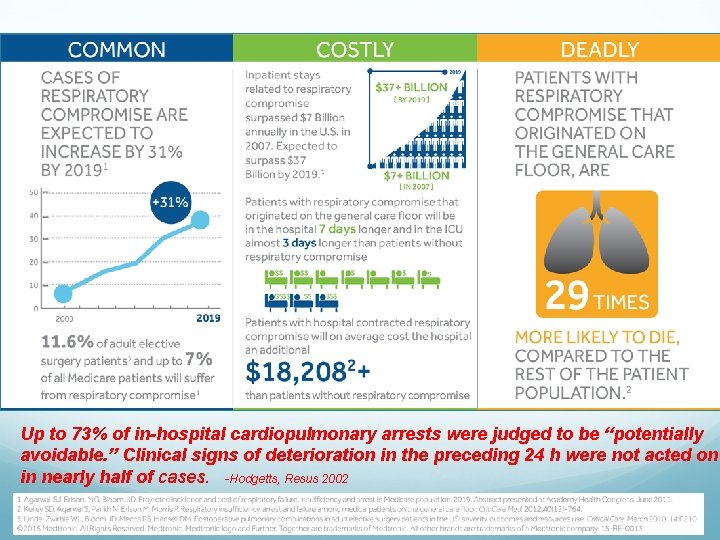
Up to 73% of in-hospital cardiopulmonary arrests were judged to be “potentially avoidable. ” Clinical signs of deterioration in the preceding 24 h were not acted on in nearly half of cases. -Hodgetts, Resus 2002
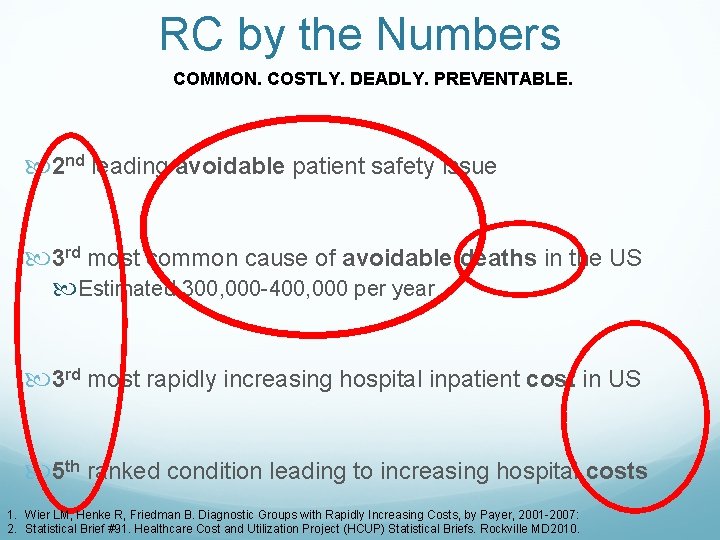
RC by the Numbers COMMON. COSTLY. DEADLY. PREVENTABLE. 2 nd leading avoidable patient safety issue 3 rd most common cause of avoidable deaths in the US Estimated 300, 000 -400, 000 per year 3 rd most rapidly increasing hospital inpatient cost in US 5 th ranked condition leading to increasing hospital costs 1. Wier LM, Henke R, Friedman B. Diagnostic Groups with Rapidly Increasing Costs, by Payer, 2001 -2007: 2. Statistical Brief #91. Healthcare Cost and Utilization Project (HCUP) Statistical Briefs. Rockville MD 2010.

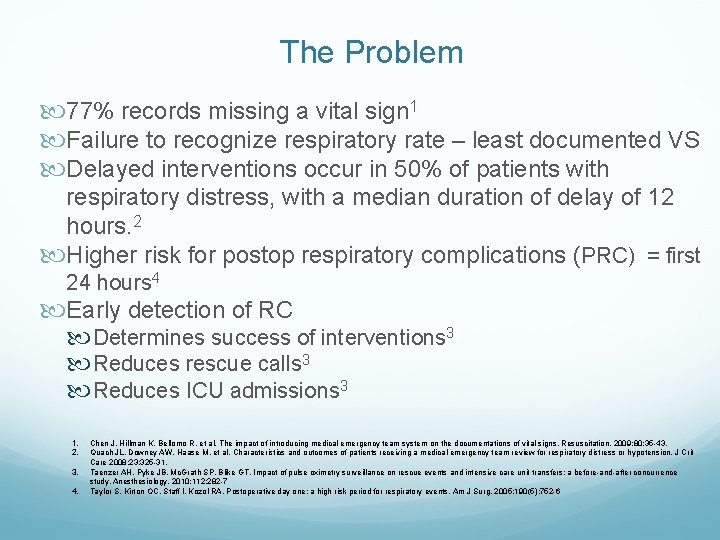
The Problem 77% records missing a vital sign 11 Failure to recognize respiratory rate – least documented VS Delayed interventions occur in 50% of patients with respiratory distress, with a median duration of delay of 12 hours. 2 Higher risk for postop respiratory complications (PRC) = first 24 hours 4 Early detection of RC Determines success of interventions 32 Reduces rescue calls 3 Reduces ICU admissions 3 1. 2. 3. 4. Chen J, Hillman K, Bellomo R, et al. The impact of introducing medical emergency team system on the documentations of vital signs. Resuscitation. 2009; 80: 35 -43. Quach JL, Downey AW, Haase M, et al. Characteristics and outcomes of patients receiving a medical emergency team review for respiratory distress or hypotension. J Crit Care 2008; 23: 325 -31. Taenzer AH, Pyke JB, Mc. Grath SP, Blike GT. Impact of pulse oximetry surveillance on rescue events and intensive care unit transfers: a before-and-after concurrence study. Anesthesiology. 2010; 112: 282 -7 Taylor S, Kirton OC, Staff I, Kozol RA. Postoperative day one: a high risk period for respiratory events. Am J Surg. 2005; 190(5): 752 -6

ETIOLOGY
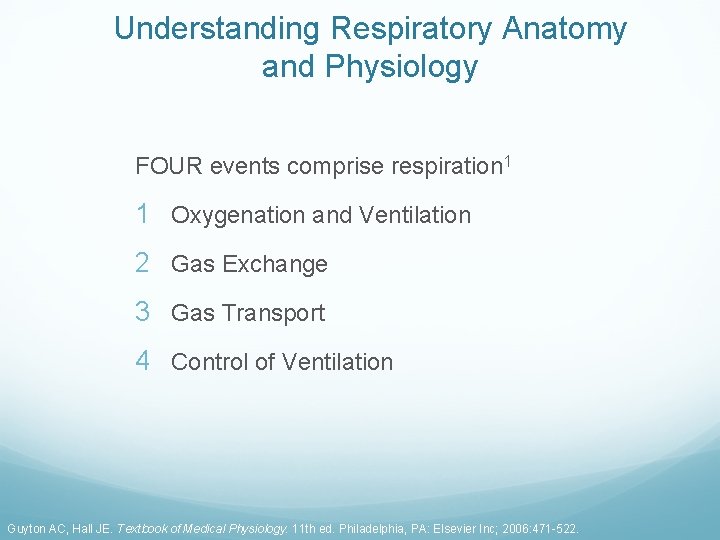
Understanding Respiratory Anatomy and Physiology FOUR events comprise respiration 1 1 Oxygenation and Ventilation 2 Gas Exchange 3 Gas Transport 4 Control of Ventilation Guyton AC, Hall JE. Textbook of Medical Physiology. 11 th ed. Philadelphia, PA: Elsevier Inc; 2006: 471 -522.
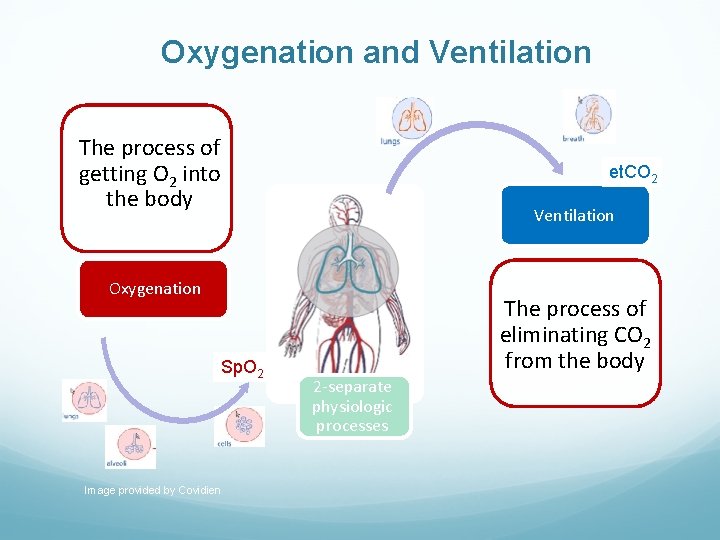
Oxygenation and Ventilation The process of getting O 2 into the body et. CO 2 Ventilation Oxygenation Sp. O 2 Image provided by Covidien The process of eliminating CO 2 from the body 2 -separate physiologic processes
Physiology of Oxygenation 98%– 99% of O 2 total content is bound to Hb (Sa. O 2) 1%– 2% of O 2 is dissolved in plasma (Pa. O 2) O 2 enters the tissues (Pa. O 2 gradient) Balance between Sa. O 2 and Pa. O 2 Hb in arterial blood remains 98% saturated (Pa. O 2 95 mm Hg) Oxygen at tissues decline to 40 mm Hg (70%– 75% Hb sat) Normal Pa. O 2 = 80– 100 mm Hg Assessed by sampling of arterial blood gases (ABG) Indirectly by noninvasive pulse oximetry (Sp. O 2) Guyton AC, Hall JE. Textbook of Medical Physiology. 11 th ed. Philadelphia, PA: Elsevier Inc; 2006: 471 -522.
Physiology of Ventilation Carbon Dioxide provides direct measurement of ventilation 70% transported as bicarbonate ion 23% bound to Hb (Hb. CO 2) 7% dissolved in blood (Pa. CO 2 40 mm Hg) Measure by invasively by ABG (Pa. CO 2) CO 2 + H 20 <> H 2 CO 3 - <> H+ + HC 03 While oxygenation may be normal, ventilation can be inadequate John Hall, Guyton and Hall Textbook of Medical Physiology. 12 ed. 2010
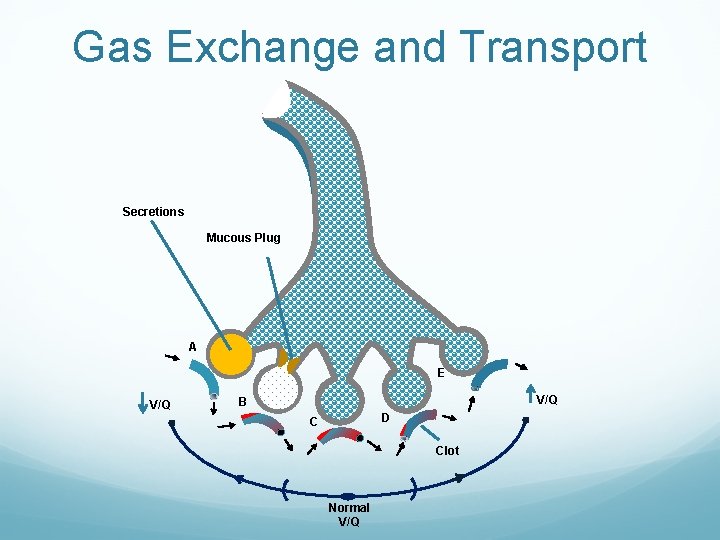
Gas Exchange and Transport Secretions Mucous Plug A E V/Q B D C Clot Normal V/Q
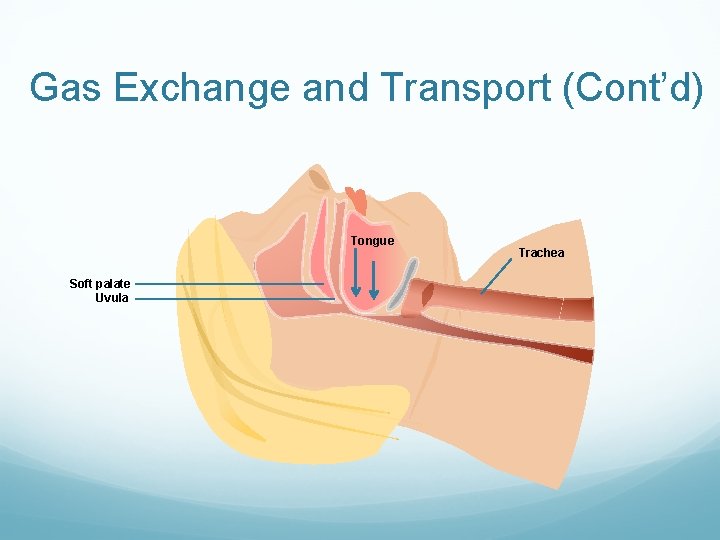
Gas Exchange and Transport (Cont’d) Tongue Soft palate Uvula Trachea
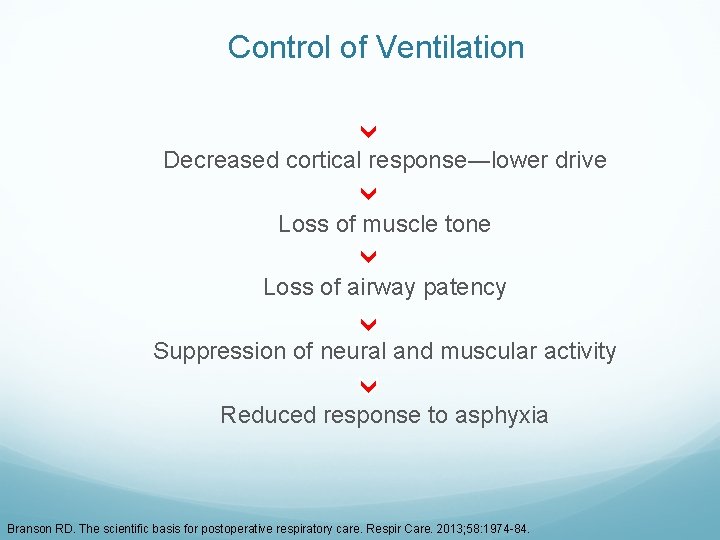
Control of Ventilation Decreased cortical response―lower drive Loss of muscle tone Loss of airway patency Suppression of neural and muscular activity Reduced response to asphyxia Branson RD. The scientific basis for postoperative respiratory care. Respir Care. 2013; 58: 1974 -84.
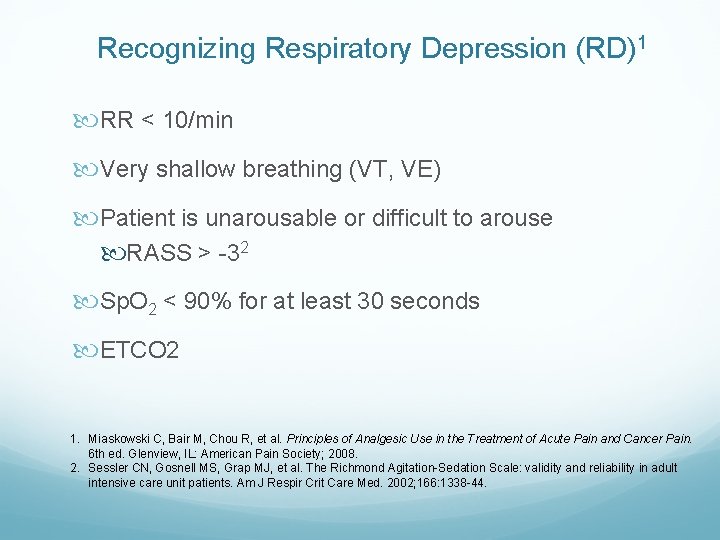
Recognizing Respiratory Depression (RD)1 RR < 10/min Very shallow breathing (VT, VE) Patient is unarousable or difficult to arouse RASS > -32 Sp. O 2 < 90% for at least 30 seconds ETCO 2 1. Miaskowski C, Bair M, Chou R, et al. Principles of Analgesic Use in the Treatment of Acute Pain and Cancer Pain. 6 th ed. Glenview, IL: American Pain Society; 2008. 2. Sessler CN, Gosnell MS, Grap MJ, et al. The Richmond Agitation-Sedation Scale: validity and reliability in adult intensive care unit patients. Am J Respir Crit Care Med. 2002; 166: 1338 -44.
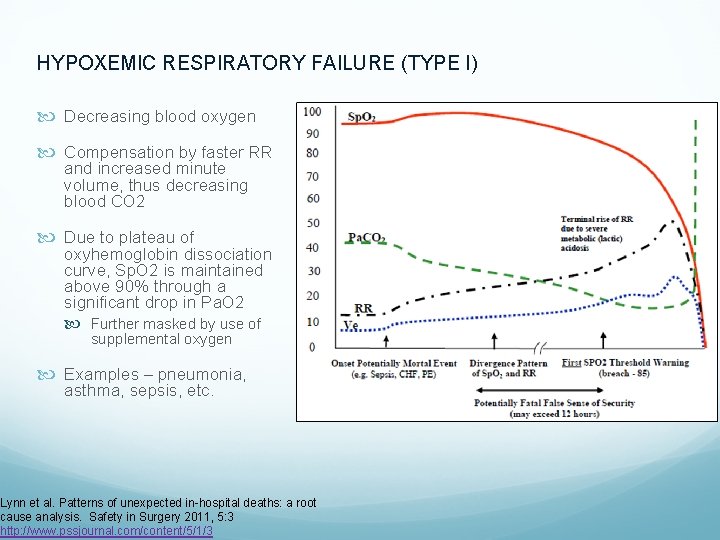
HYPOXEMIC RESPIRATORY FAILURE (TYPE I) Decreasing blood oxygen Compensation by faster RR and increased minute volume, thus decreasing blood CO 2 Due to plateau of oxyhemoglobin dissociation curve, Sp. O 2 is maintained above 90% through a significant drop in Pa. O 2 Further masked by use of supplemental oxygen Examples – pneumonia, asthma, sepsis, etc. Lynn et al. Patterns of unexpected in-hospital deaths: a root cause analysis. Safety in Surgery 2011, 5: 3 http: //www. pssjournal. com/content/5/1/3
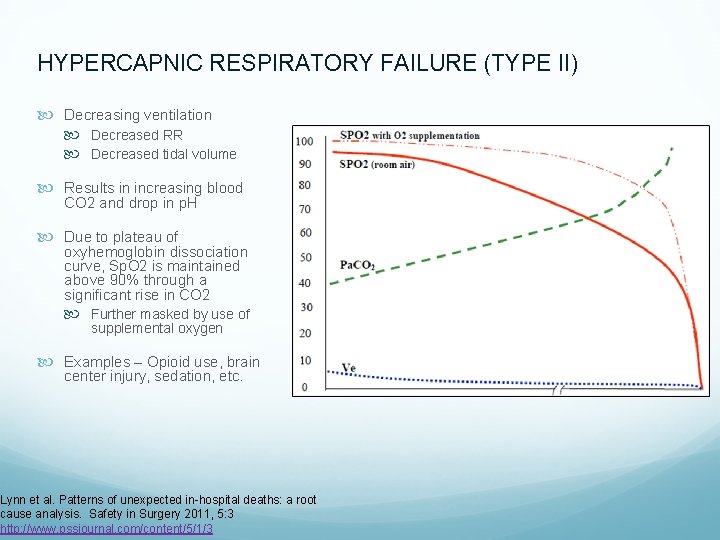
HYPERCAPNIC RESPIRATORY FAILURE (TYPE II) Decreasing ventilation Decreased RR Decreased tidal volume Results in increasing blood CO 2 and drop in p. H Due to plateau of oxyhemoglobin dissociation curve, Sp. O 2 is maintained above 90% through a significant rise in CO 2 Further masked by use of supplemental oxygen Examples – Opioid use, brain center injury, sedation, etc. Lynn et al. Patterns of unexpected in-hospital deaths: a root cause analysis. Safety in Surgery 2011, 5: 3 http: //www. pssjournal. com/content/5/1/3
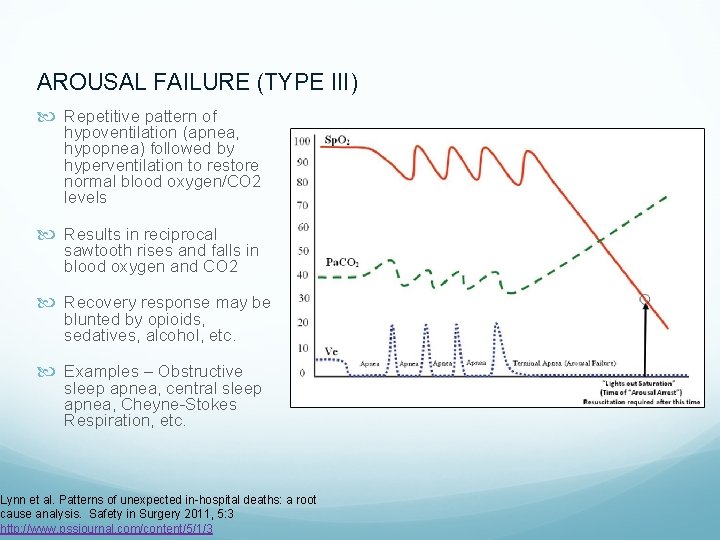
AROUSAL FAILURE (TYPE III) Repetitive pattern of hypoventilation (apnea, hypopnea) followed by hyperventilation to restore normal blood oxygen/CO 2 levels Results in reciprocal sawtooth rises and falls in blood oxygen and CO 2 Recovery response may be blunted by opioids, sedatives, alcohol, etc. Examples – Obstructive sleep apnea, central sleep apnea, Cheyne-Stokes Respiration, etc. Lynn et al. Patterns of unexpected in-hospital deaths: a root cause analysis. Safety in Surgery 2011, 5: 3 http: //www. pssjournal. com/content/5/1/3

SOLUTIONS
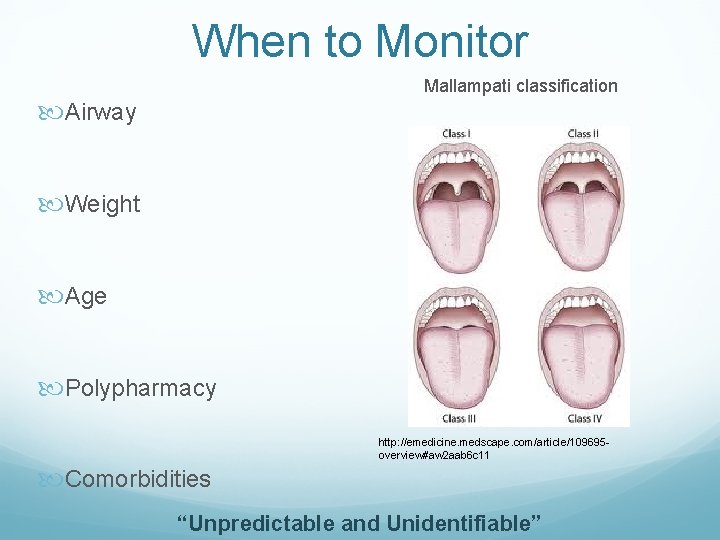
When to Monitor Mallampati classification Airway Weight Age Polypharmacy http: //emedicine. medscape. com/article/109695 overview#aw 2 aab 6 c 11 Comorbidities “Unpredictable and Unidentifiable”
When To Monitor Moderate sedation (conscious sedation) Deep sedation Analgesia General anesthesia Nagelhout et al. , Nurse Anesthesia. 5 th edition, St. Louis, Elsevier, 2014. Compromise of Respiratory Function
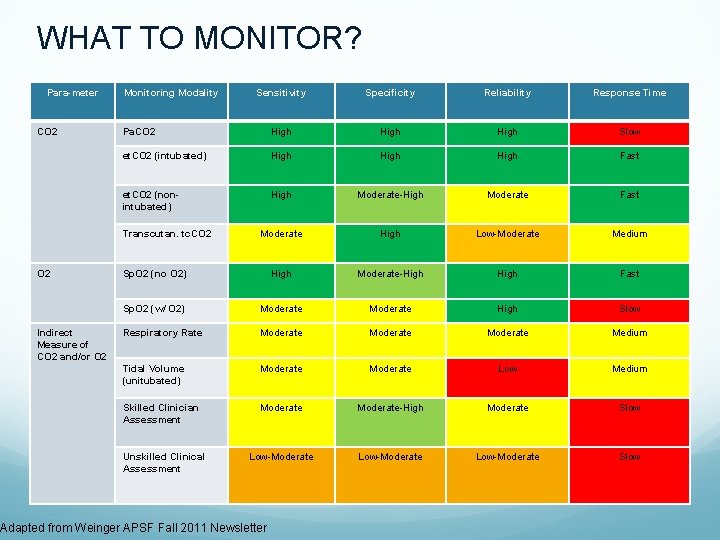
WHAT TO MONITOR? Para-meter CO 2 Monitoring Modality Sensitivity Specificity Reliability Response Time Pa. CO 2 High Slow et. CO 2 (intubated) High Fast et. CO 2 (nonintubated) High Moderate-High Moderate Fast Moderate High Low-Moderate Medium Sp. O 2 (no O 2) High Moderate-High Fast Sp. O 2 (w/ O 2) Moderate High Slow Respiratory Rate Moderate Medium Tidal Volume (unitubated) Moderate Low Medium Skilled Clinician Assessment Moderate-High Moderate Slow Low-Moderate Slow Transcutan. tc. CO 2 Indirect Measure of CO 2 and/or O 2 Unskilled Clinical Assessment Adapted from Weinger APSF Fall 2011 Newsletter
Carbon Dioxide TRUE MEASURE OF VENTILATION Patient may be well oxygenated VT (≈ 500 m. L) vs. FRC (≈ 2400 m. L = O 2 reserve) VT - Tidal Volume FRC - Functional Residual Capacity Apnea : O 2 reserve continues diffusion into pulmonary capillaries : principle behind pre-oxygenation Time from apnea to hypoxemia depends on FRC (age, size, medical condition) John Hall, Guyton and Hall Textbook of Medical Physiology. 12 ed. 2010
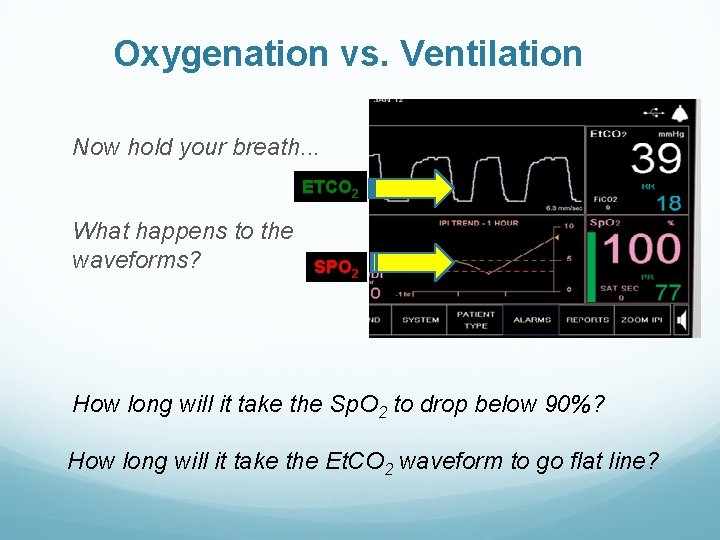
Oxygenation vs. Ventilation Now hold your breath. . . ETCO 2 What happens to the waveforms? SPO 2 How long will it take the Sp. O 2 to drop below 90%? How long will it take the Et. CO 2 waveform to go flat line?
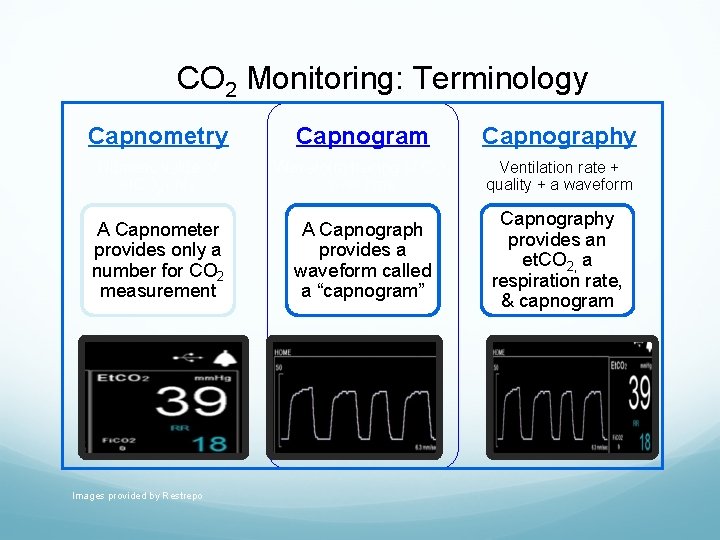
CO 2 Monitoring: Terminology Capnometry Capnogram Capnography Numeric value of et. CO 2 only Waveform tracing of CO 2 over time Ventilation rate + quality + a waveform A Capnometer provides only a number for CO 2 measurement A Capnograph provides a waveform called a “capnogram” Capnography provides an et. CO 2, a respiration rate, & capnogram Images provided by Restrepo
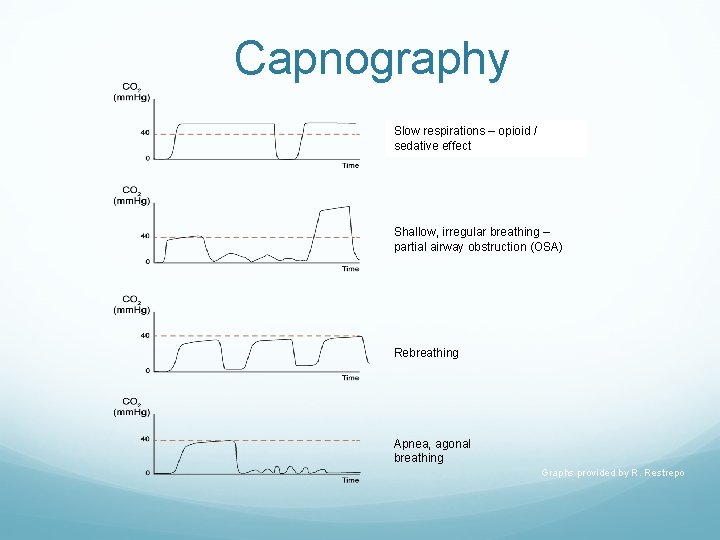
Capnography Slow respirations – opioid / sedative effect Shallow, irregular breathing – partial airway obstruction (OSA) Rebreathing Apnea, agonal breathing Graphs provided by R. Restrepo

THE LITERATURE
Capnographic Monitoring and its Effects on Safety of Sedation • N = 247 undergoing endoscopic retrograde cholangiopancreatography (ERCP) with opioid and benzodiazepine • Randomized • Study arm: team blinded to capnography • Open arm: team was prompted of capnographic changes • Primary endpoint: occurrence of hypoxemia Qadeer MA, Vargo JJ, Dumot JA, et al. Capnographic monitoring of respiratory activity improves safety of sedation for endoscopic cholangiopancreatography and ultrasonography. Gastroenterology. 2009; 136(5): 1568 -76.
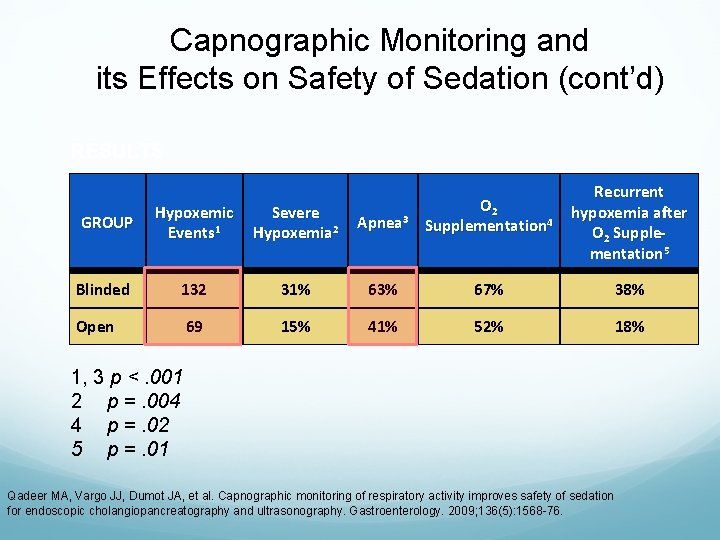
Capnographic Monitoring and its Effects on Safety of Sedation (cont’d) RESULTS Recurrent hypoxemia after O 2 Supplementation 5 GROUP Hypoxemic Events 1 Severe Hypoxemia 2 Apnea 3 O 2 Supplementation 4 Blinded 132 31% 63% 67% 38% Open 69 15% 41% 52% 18% 1, 3 p <. 001 2 p =. 004 4 p =. 02 5 p =. 01 Qadeer MA, Vargo JJ, Dumot JA, et al. Capnographic monitoring of respiratory activity improves safety of sedation for endoscopic cholangiopancreatography and ultrasonography. Gastroenterology. 2009; 136(5): 1568 -76.
Microstream® Capnography and Patient Monitoring During Moderate Sedation Randomized, controlled trial 163 children ― 174 elective GI procedures with moderate sedation in a pediatric endoscopy unit NC 2 LPM Blinded to microstream capnography monitoring Alveolar hypoventilation (AH) signaled Blinded arm: if > 15 sec: trained observers informed clinical staff Open/control arm: If > 60 sec Primary outcome: Sp. O 2 < 95% for > 5 sec Lightdale JR, Goldmann DA, Feldman HA, et al. Microstream capnography improves patient monitoring during moderate sedation: a randomized, controlled trial. Pediatrics. 2006; 117(6): e 1170 -8. ®Microstream is a trademark of a Covidien company. Registered in the US and foreign countries.
Microstream Capnography and Patient Monitoring (cont’d) RESULTS Endoscopy staff documented poor ventilation in 3% of all procedures and no apnea. Intervention arm Less likely to experience low Sp. O 2 Capnography indicated AH during 56% of procedures and apnea during 24% Early detection of desaturation due to AH despite use of routine O 2 Lightdale JR, Goldmann DA, Feldman HA, et al. Microstream capnography improves patient monitoring during
Respiratory Therapists and Pain Management Using End Tidal CO 2 Monitoring In 2007, prior to implementing a postop program including capnography monitoring: 19. 6% of Adverse drug events (ADEs) rated as severe and 16. 7% of moderate/severe ADEs progressed to code blue From Jan – June 2011: 2% of ADEs were categorized as severe and zero moderate/severe ADEs progressed to code blue. Fox D. Integral role of respiratory therapists in a comprehensive pain management program using end tidal CO 2 monitoring. ARC Congress 2011. Open Forum #16. Tampa, FL; November 8, 2011.
ETCO 2 Monitoring in the ED Methods: Treating physicians administering procedural sedation were randomized to have access to capnography monitoring or blinded to the monitored capnography measurements. Results: ETCO 2 Group – 25% of patients had hypoxia Blinded Group – 42% of patients had hypoxia Capnography recognized all cases of hypoxia before onset (100% sensitivity) ETCO 2 triggered intervention 60 sec before onset of hypoxia Deitch et al Ann Emerg Med. 2010 Mar; 55(3): 258 -64. doi: 10. 1016/
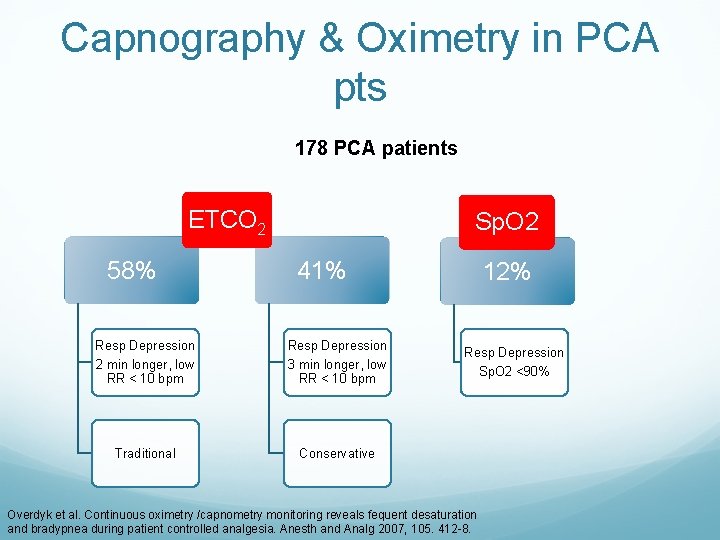
Capnography & Oximetry in PCA pts 178 PCA patients ETCO 2 58% Sp. O 2 41% Resp Depression 2 min longer, low RR < 10 bpm Resp Depression 3 min longer, low RR < 10 bpm Traditional Conservative 12% Resp Depression Sp. O 2 <90% Overdyk et al. Continuous oximetry /capnometry monitoring reveals fequent desaturation and bradypnea during patient controlled analgesia. Anesth and Analg 2007, 105. 412 -8.
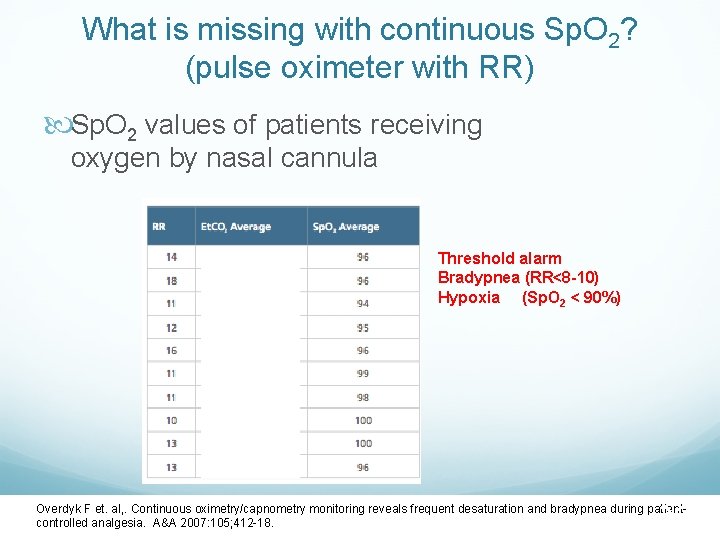
What is missing with continuous Sp. O 2? (pulse oximeter with RR) Sp. O 2 values of patients receiving oxygen by nasal cannula Threshold alarm Bradypnea (RR<8 -10) Hypoxia (Sp. O 2 < 90%) 38 Overdyk F et. al, . Continuous oximetry/capnometry monitoring reveals frequent desaturation and bradypnea during patientcontrolled analgesia. A&A 2007: 105; 412 -18.
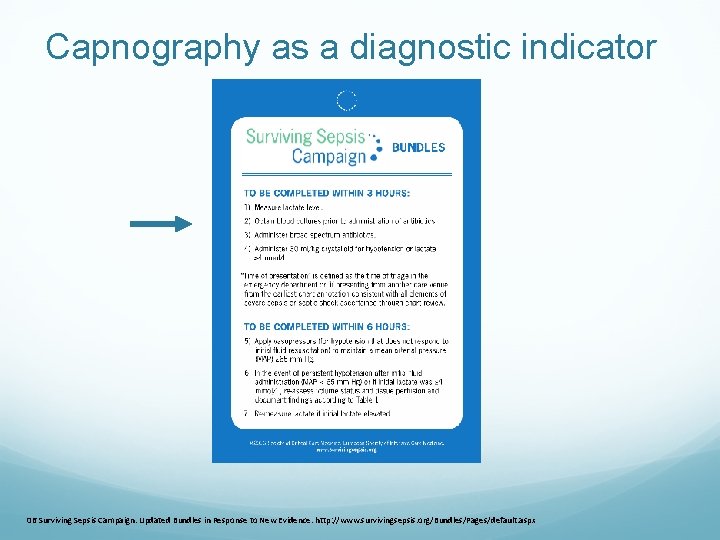
Capnography as a diagnostic indicator 06 Surviving Sepsis Campaign. Updated Bundles in Response to New Evidence. http: //www. survivingsepsis. org/Bundles/Pages/default. aspx
Capnography as a diagnostic indicator for Sepsis • Suggests that et. CO 2 concentration may perform similarly to lactate levels as a • predictor for mortality in patients with suspected sepsis. • ETCO 2 among the 3 (et. CO 2, vasopressors, mechanical ventilation) independent • predictors of mortality. 08 Hunter CL, Silvestri S, Dean M, Falk JL, Papa L. End-tidal carbon dioxide is associated with mortality and lactate in patients with suspected sepsis. The American Journal of Emergency Medicine. 2013; 31(1): 64 -71.
PRODIGY STUDY OIRD common on general care floor No tool to reliably predict OIRD SOLUTION… Create and validate a risk prediction tool for RD on general care floors using continuous respiratory monitoring 1650 patients from 16 centers from 7 different countries Khanna AK, Overdyk FJ, Greening C, Di Stefano P, Buhre WF JOURNAL J of Crit Care 2018,
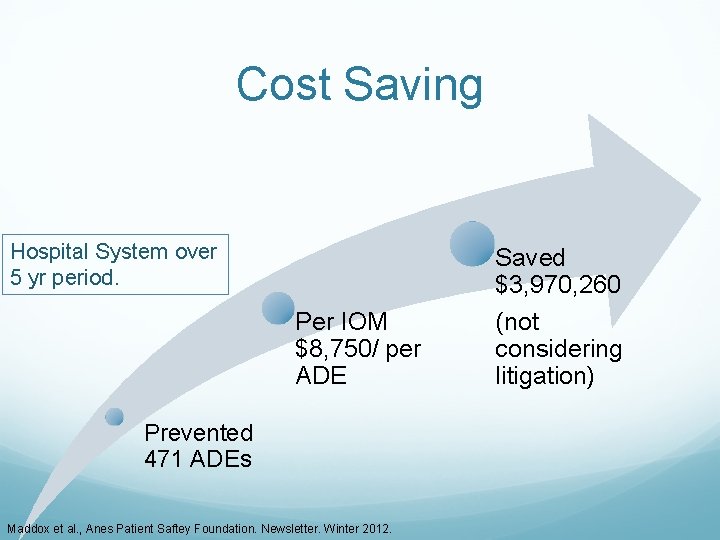
Cost Saving Hospital System over 5 yr period. Per IOM $8, 750/ per ADE Prevented 471 ADEs Maddox et al. , Anes Patient Saftey Foundation. Newsletter. Winter 2012. Saved $3, 970, 260 (not considering litigation)
http: //www. covidien. com
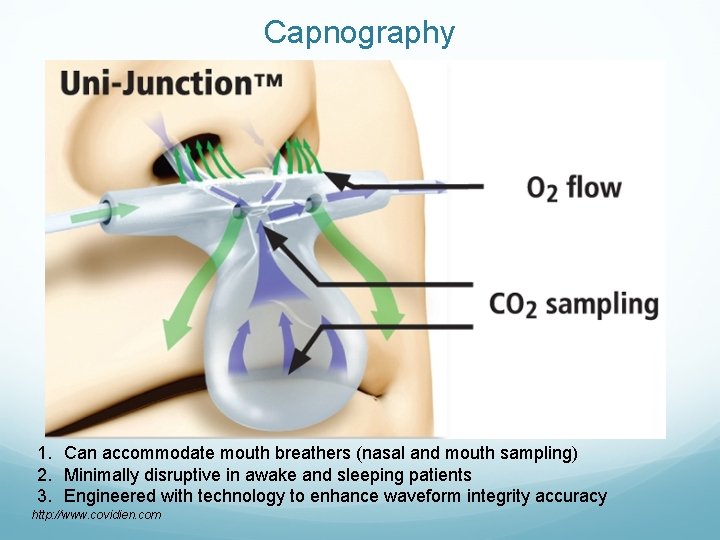
Capnography 1. Can accommodate mouth breathers (nasal and mouth sampling) 2. Minimally disruptive in awake and sleeping patients 3. Engineered with technology to enhance waveform integrity accuracy http: //www. covidien. com
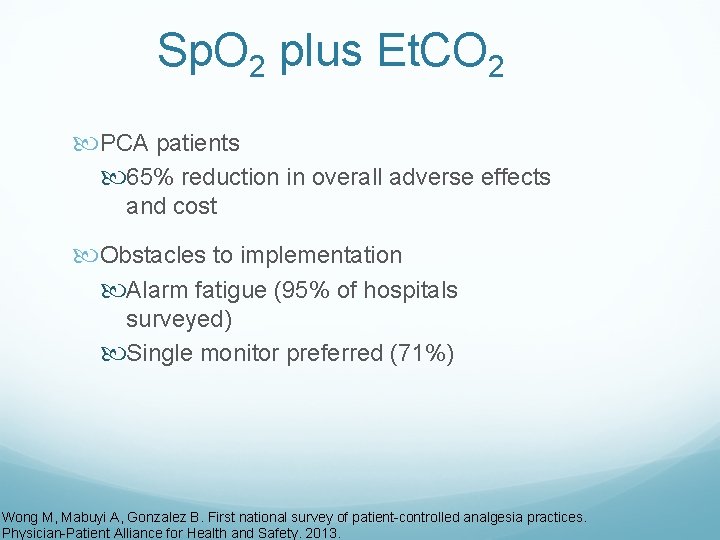
Sp. O 2 plus Et. CO 2 PCA patients 65% reduction in overall adverse effects and cost Obstacles to implementation Alarm fatigue (95% of hospitals surveyed) Single monitor preferred (71%) Wong M, Mabuyi A, Gonzalez B. First national survey of patient-controlled analgesia practices. Physician-Patient Alliance for Health and Safety. 2013.
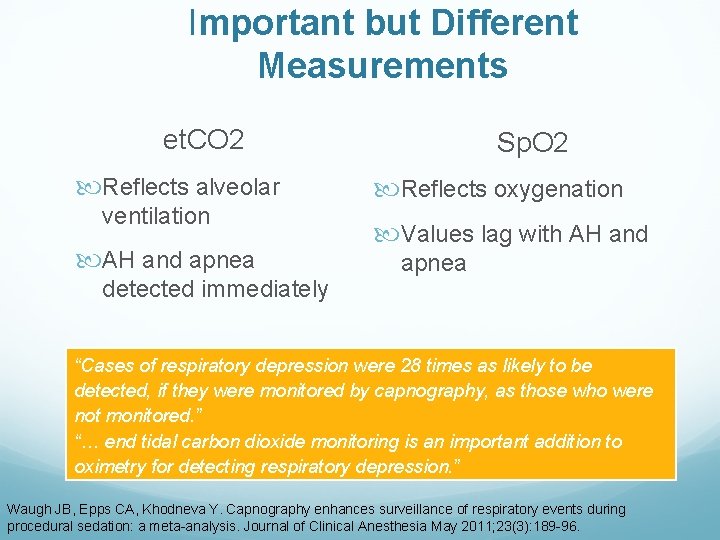
Important but Different Measurements et. CO 2 Reflects alveolar ventilation AH and apnea detected immediately Sp. O 2 Reflects oxygenation Values lag with AH and apnea “Cases of respiratory depression were 28 times as likely to be detected, if they were monitored by capnography, as those who were not monitored. ” “… end tidal carbon dioxide monitoring is an important addition to oximetry for detecting respiratory depression. ” Waugh JB, Epps CA, Khodneva Y. Capnography enhances surveillance of respiratory events during procedural sedation: a meta-analysis. Journal of Clinical Anesthesia May 2011; 23(3): 189 -96.
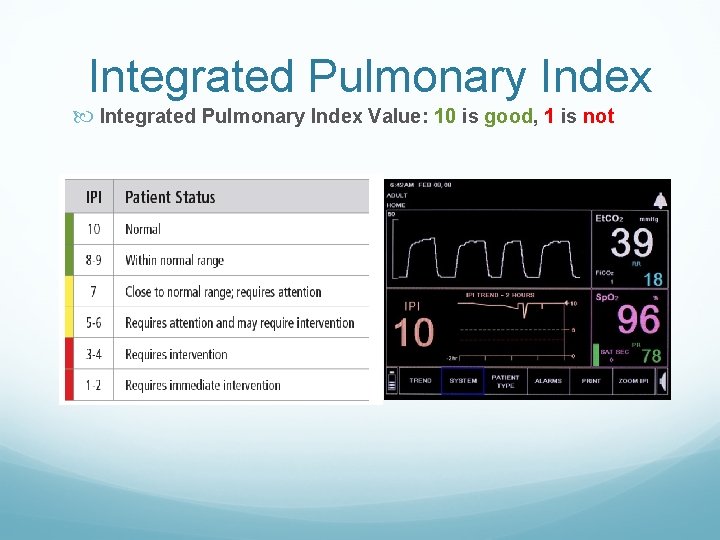
Integrated Pulmonary Index Value: 10 is good, 1 is not
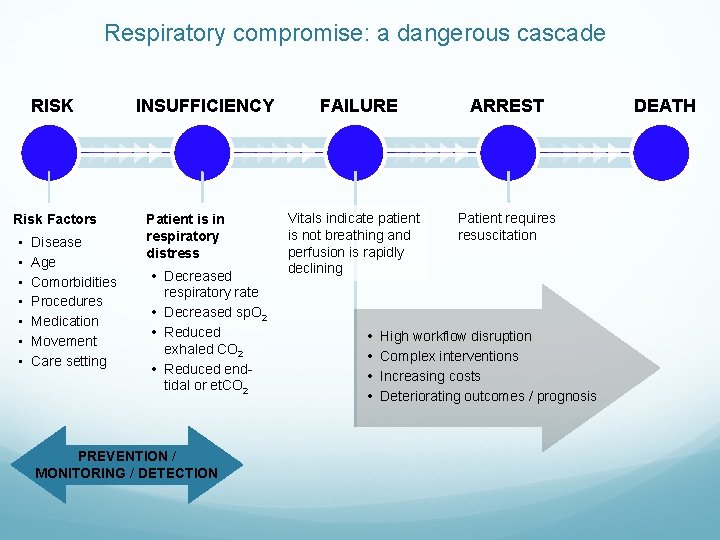
Respiratory compromise: a dangerous cascade RISK Risk Factors • • Disease Age Comorbidities Procedures Medication Movement Care setting INSUFFICIENCY Patient is in respiratory distress • Decreased respiratory rate • Decreased sp. O 2 • Reduced exhaled CO 2 • Reduced endtidal or et. CO 2 PREVENTION / MONITORING / DETECTION FAILURE Vitals indicate patient is not breathing and perfusion is rapidly declining • • ARREST Patient requires resuscitation High workflow disruption Complex interventions Increasing costs Deteriorating outcomes / prognosis DEATH
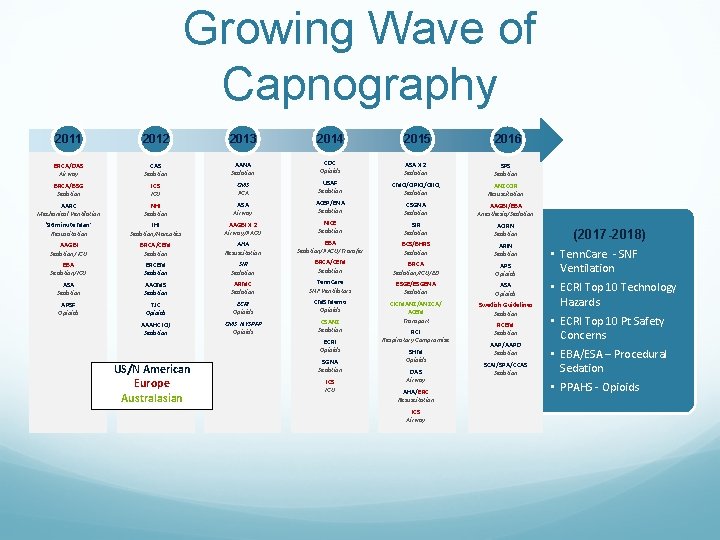
Growing Wave of Capnography 2011 2012 2013 2014 2015 2016 BRCA/DAS Airway CAS Sedation AANA Sedation CDC Opioids ASA X 2 Sedation SPS Sedation BRCA/BSG Sedation ICS ICU CMS PCA USAF Sedation CMQ/OPIQ/OIIQ Sedation ANZCOR Resuscitation AARC Mechanical Ventilation NHI Sedation ASA Airway ACEP/ENA Sedation CSGNA Sedation AAGBI/EBA Anesthesia/Sedation ‘ 96 minute Man’ Resuscitation IHI Sedation/Narcotics AAGBI X 2 Airway/PACU NICE Sedation SIR Sedation AORN Sedation AAGBI Sedation/ ICU BRCA/CEM Sedation AHA Resuscitation EBA Sedation/PACU/Transfer BCS/BHRS Sedation ARIN Sedation EBA Sedation/ICU BRCEM Sedation SIR Sedation BRCA/CEM Sedation BRCA Sedation/ICU/ED APS Opioids ASA Sedation AAOMS Sedation ARMC Sedation Tenn. Care SNF Ventilators ESGE/ESGENA Sedation ASA Opioids APSF Opioids TJC Opioids ECRI Opioids CMS Memo Opioids Swedish Guidelines Sedation AAAHC IQI Sedation CMS NYSPFP Opioids CSANZ Sedation CICMANZ/ANZCA/ ACEM Transport ECRI Opioids US/N American Europe Australasian SGNA Sedation ICS ICU RCI Respiratory Compromise SHM Opioids DAS Airway AHA/ERC Resuscitation ICS Airway RCEM Sedation AAP/AAPD Sedation SCAI/SPA/CCAS Sedation (2017 -2018) • Tenn. Care - SNF Ventilation • ECRI Top 10 Technology Hazards • ECRI Top 10 Pt Safety Concerns • EBA/ESA – Procedural Sedation • PPAHS - Opioids

QUESTIONS?
- Slides: 50