
Resolving Non Revenue Water John Leeuwenburg Global Product
Resolving Non Revenue Water John Leeuwenburg Global Product Manager – Realworld Systems
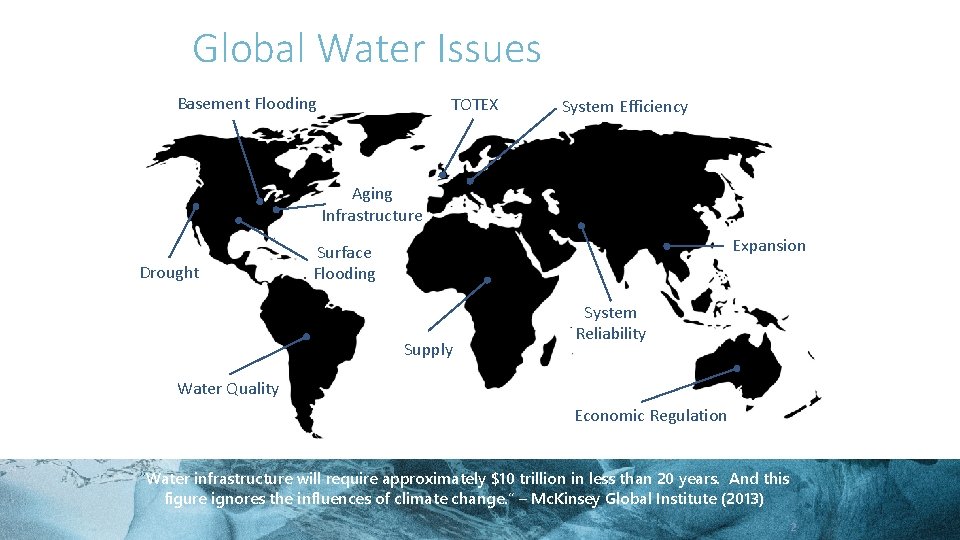
Global Water Issues Basement Flooding TOTEX System Efficiency Aging Infrastructure Drought Expansion Surface Flooding Supply System Reliability Water Quality Economic Regulation “Water infrastructure will require approximately $10 trillion in less than 20 years. And this figure ignores the influences of climate change. ” – Mc. Kinsey Global Institute (2013) 2
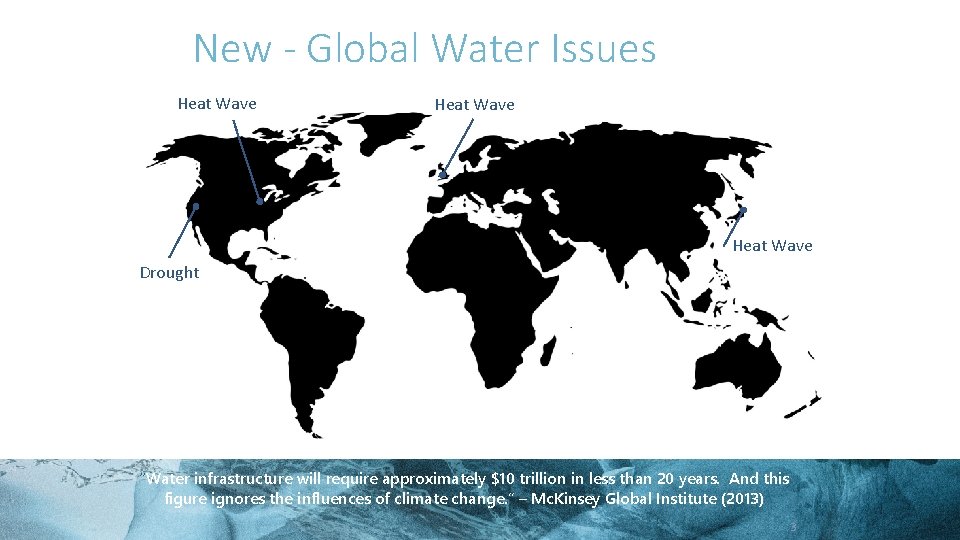
New - Global Water Issues Heat Wave Drought “Water infrastructure will require approximately $10 trillion in less than 20 years. And this figure ignores the influences of climate change. ” – Mc. Kinsey Global Institute (2013) 3
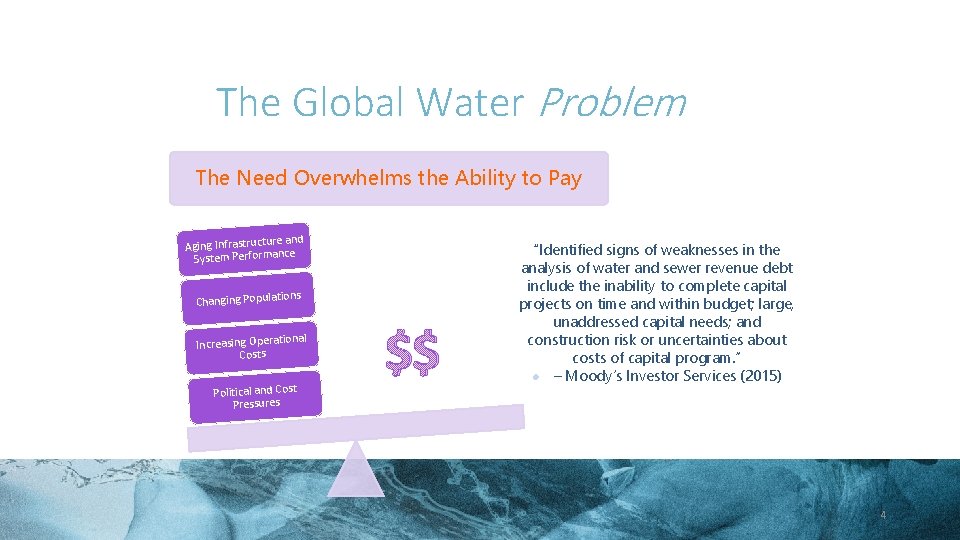
The Global Water Problem The Need Overwhelms the Ability to Pay re and Aging Infrastructu ce System Performan ns Changing Populatio Increasing Operatio Costs nal Political and Cost Pressures $$ “Identified signs of weaknesses in the analysis of water and sewer revenue debt include the inability to complete capital projects on time and within budget; large, unaddressed capital needs; and construction risk or uncertainties about costs of capital program. ” l – Moody’s Investor Services (2015) 4
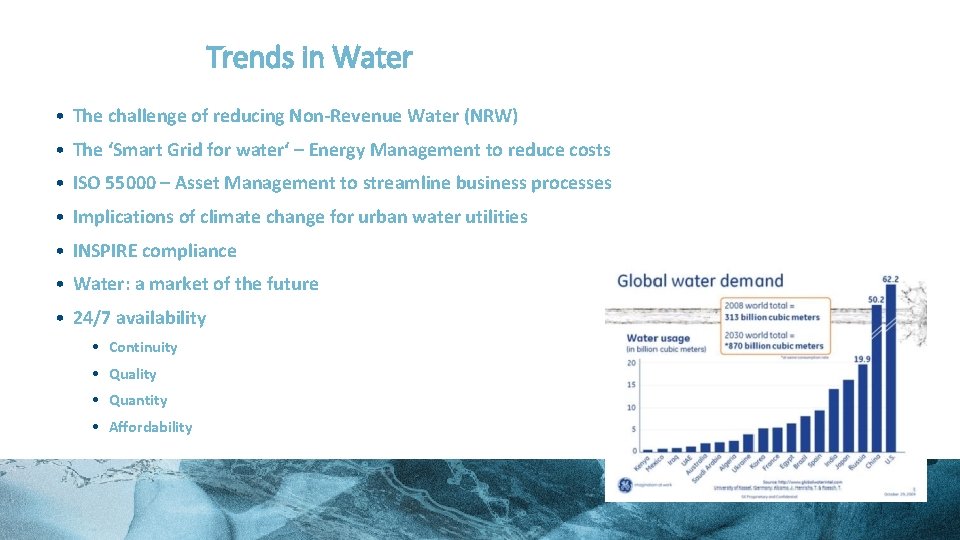
Trends in Water • The challenge of reducing Non-Revenue Water (NRW) • The ‘Smart Grid for water‘ – Energy Management to reduce costs • ISO 55000 – Asset Management to streamline business processes • Implications of climate change for urban water utilities • INSPIRE compliance • Water: a market of the future • 24/7 availability • Continuity • Quality • Quantity • Affordability
Non Revenue Water is the difference between total produced water vs the amount of metered and authorized un-metered use. • Apparent losses are metering, management and human errors that result in consumption without income. • Real losses is the amount of water lost due to waste in the network. These come from issues such as leaks, unreported bursts or other types of losses. Non Revenue Water can be calculated by ensuring that all of the data is available. • Various models are supported including SCADA and AMR integration
Non Revenue Water The Process…. .
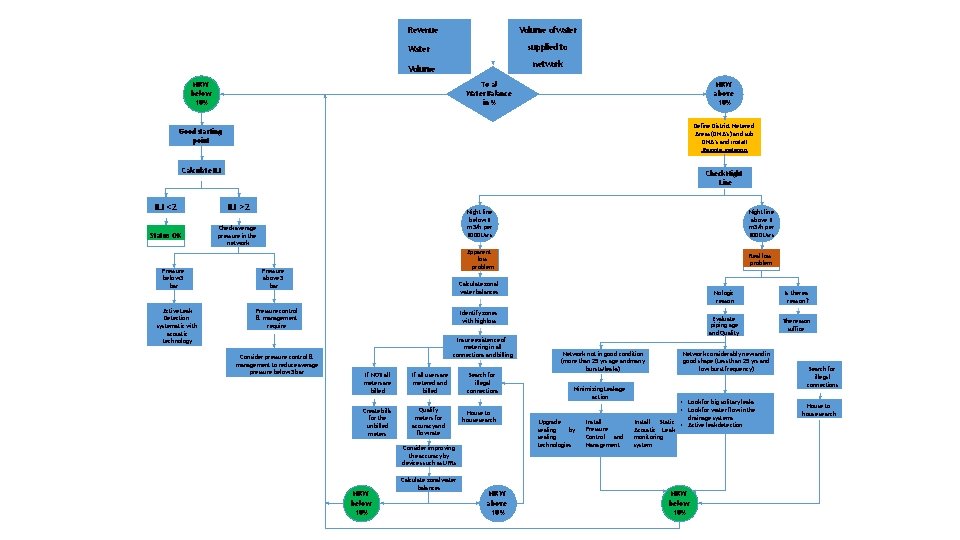
Volume ofwater Revenue supplied to Water network Volume Total Water Balance in % NRW below 10% NRW above 10% Define District Metered Areas (DMA’s) and sub DMA’s and install Remote metering Good starting point Calculate ILI Check Night Line ILI < 2 ILI > 2 Status OK Check average pressure in the network Pressure below 3 bar Active Leak Detection: systematic with acoustic technology Pressure above 3 bar Night line above 1 m 3/h per 1000 Usrs Apparent loss problem Real loss problem Calculate zonal water balances Pressure control & management require Consider pressure control & management to reduceaverage pressure below 3 bar Night line below 1 m 3/h per 1000 Usrs Identify zones with high loss Insure existence of metering in all connections and billing If NOT all meters are billed If all usersare metered and billed Create bills for the unbilled meters Qualify meters for accuracy and flow rate Search for illegal connections House to house search Consider improving the accuracy by devices such as UFRs NRW below 10% Calculate zonal water balances NRW above 10% Network not in good condition (more than 25 yrs age andmany bursts/leaks) Minimizing Leakage action Upgrade sealing by sealing technologies Install Pressure Control and Management No logic reason Is therea reason? Evaluate piping age and Quality Thereason suffice Network considerably new and in good shape (Less than 25 yrs and low burst frequency) • Look for big solitary leaks • Look for water flow inthe drainage systems Install Static • Active leak detection Acoustic Leak monitoring system NRW below 10% Search for illegal connections House to house search
Non Revenue Water The Prerequisites…. . • Functions • Data
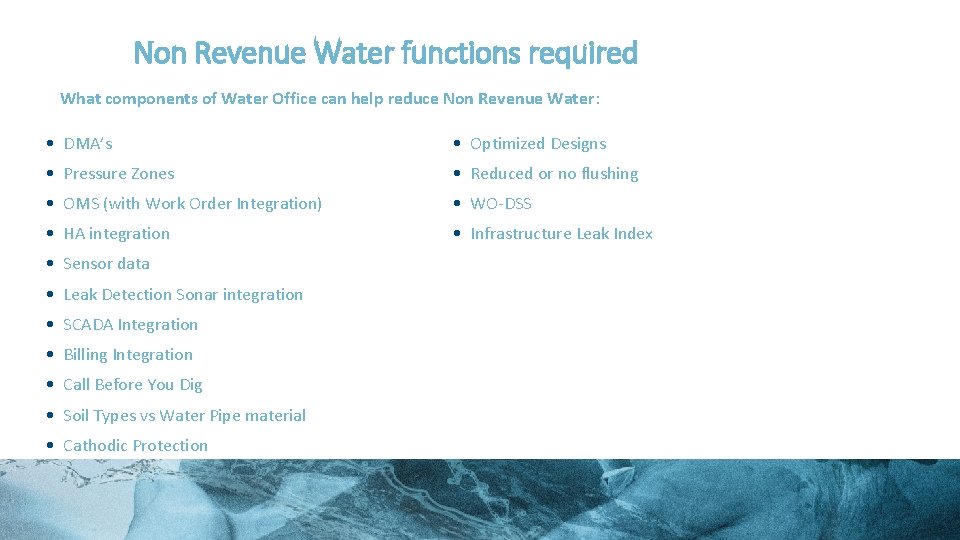
Non Revenue Water functions required What components of Water Office can help reduce Non Revenue Water: • DMA’s • Optimized Designs • Pressure Zones • Reduced or no flushing • OMS (with Work Order Integration) • WO-DSS • HA integration • Infrastructure Leak Index • Sensor data • Leak Detection Sonar integration • SCADA Integration • Billing Integration • Call Before You Dig • Soil Types vs Water Pipe material • Cathodic Protection
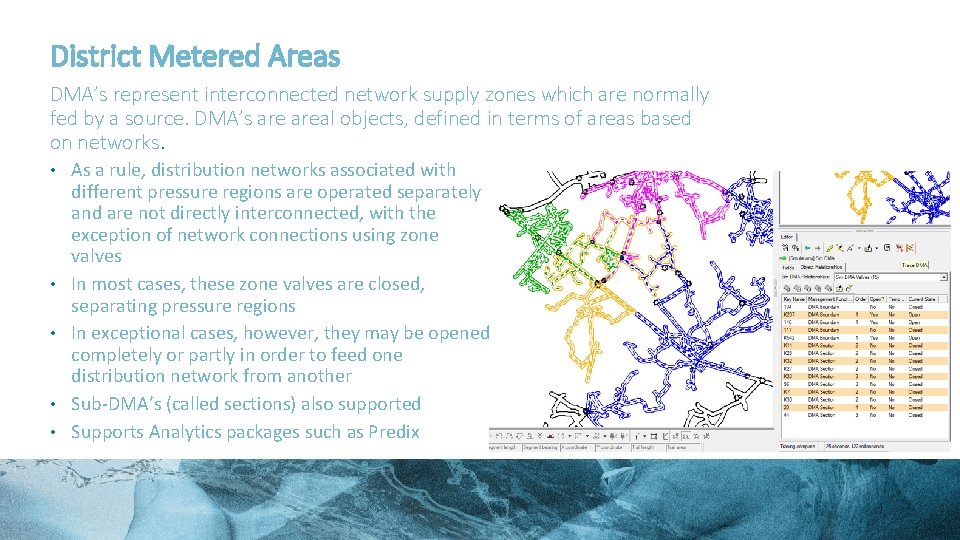
District Metered Areas DMA’s represent interconnected network supply zones which are normally fed by a source. DMA’s areal objects, defined in terms of areas based on networks. • As a rule, distribution networks associated with • • different pressure regions are operated separately and are not directly interconnected, with the exception of network connections using zone valves In most cases, these zone valves are closed, separating pressure regions In exceptional cases, however, they may be opened completely or partly in order to feed one distribution network from another Sub-DMA’s (called sections) also supported Supports Analytics packages such as Predix
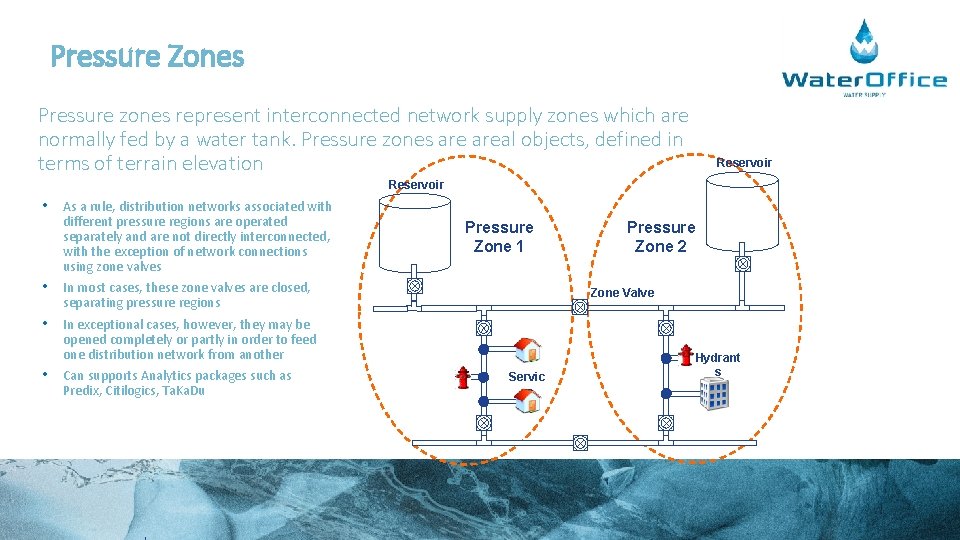
Pressure Zones Pressure zones represent interconnected network supply zones which are normally fed by a water tank. Pressure zones areal objects, defined in terms of terrain elevation Reservoir • As a rule, distribution networks associated with different pressure regions are operated separately and are not directly interconnected, with the exception of network connections using zone valves • In most cases, these zone valves are closed, separating pressure regions • In exceptional cases, however, they may be opened completely or partly in order to feed one distribution network from another • Can supports Analytics packages such as Predix, Citilogics, Ta. Ka. Du Pressure Zone 1 Pressure Zone 2 Zone Valve Servic es Hydrant s
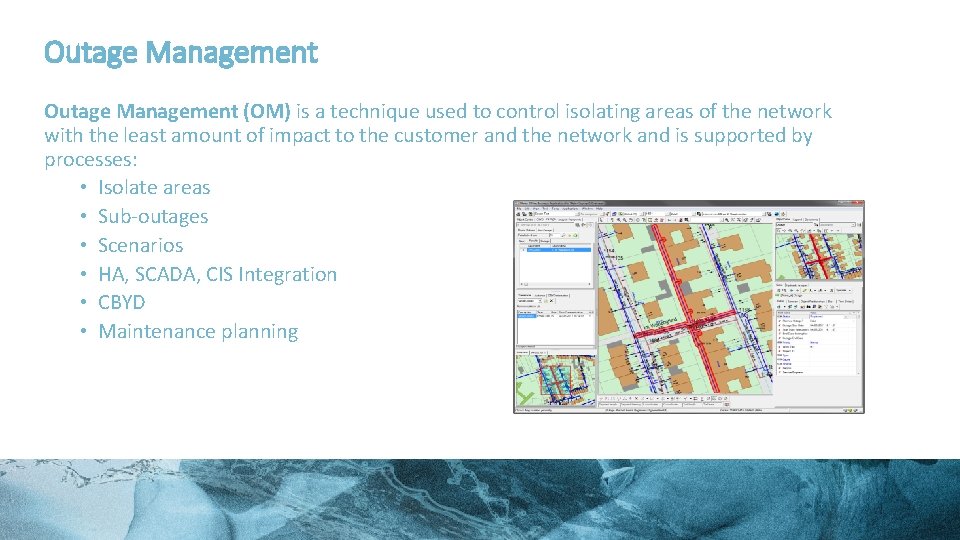
Outage Management (OM) is a technique used to control isolating areas of the network with the least amount of impact to the customer and the network and is supported by processes: • Isolate areas • Sub-outages • Scenarios • HA, SCADA, CIS Integration • CBYD • Maintenance planning
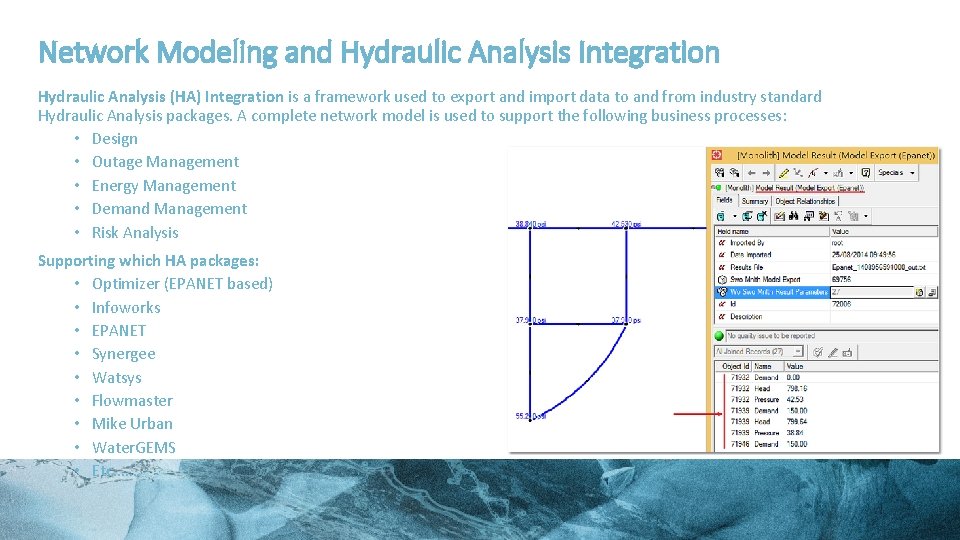
Network Modeling and Hydraulic Analysis Integration Hydraulic Analysis (HA) Integration is a framework used to export and import data to and from industry standard Hydraulic Analysis packages. A complete network model is used to support the following business processes: • Design • Outage Management • Energy Management • Demand Management • Risk Analysis Supporting which HA packages: • Optimizer (EPANET based) • Infoworks • EPANET • Synergee • Watsys • Flowmaster • Mike Urban • Water. GEMS • Etc…….
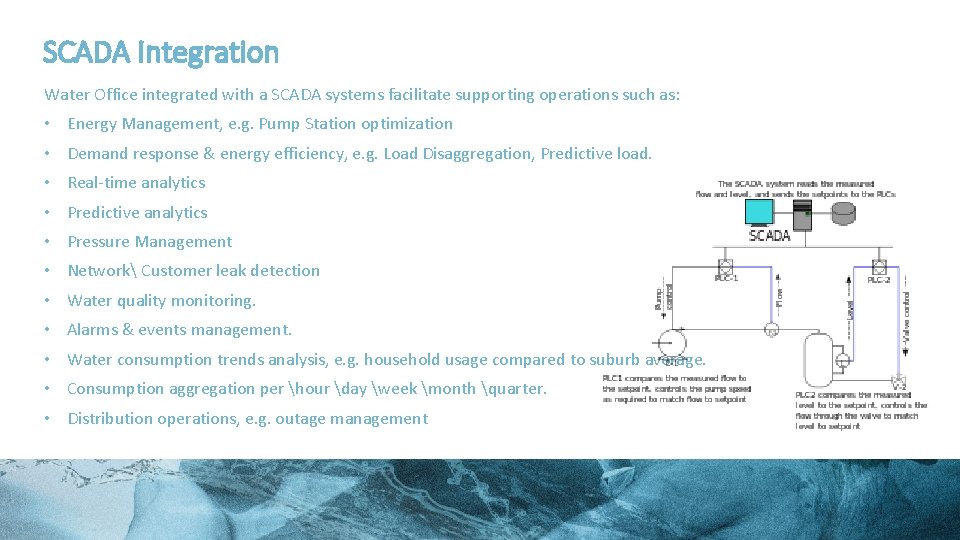
SCADA Integration Water Office integrated with a SCADA systems facilitate supporting operations such as: • Energy Management, e. g. Pump Station optimization • Demand response & energy efficiency, e. g. Load Disaggregation, Predictive load. • Real-time analytics • Predictive analytics • Pressure Management • Network Customer leak detection • Water quality monitoring. • Alarms & events management. • Water consumption trends analysis, e. g. household usage compared to suburb average. • Consumption aggregation per hour day week month quarter. • Distribution operations, e. g. outage management
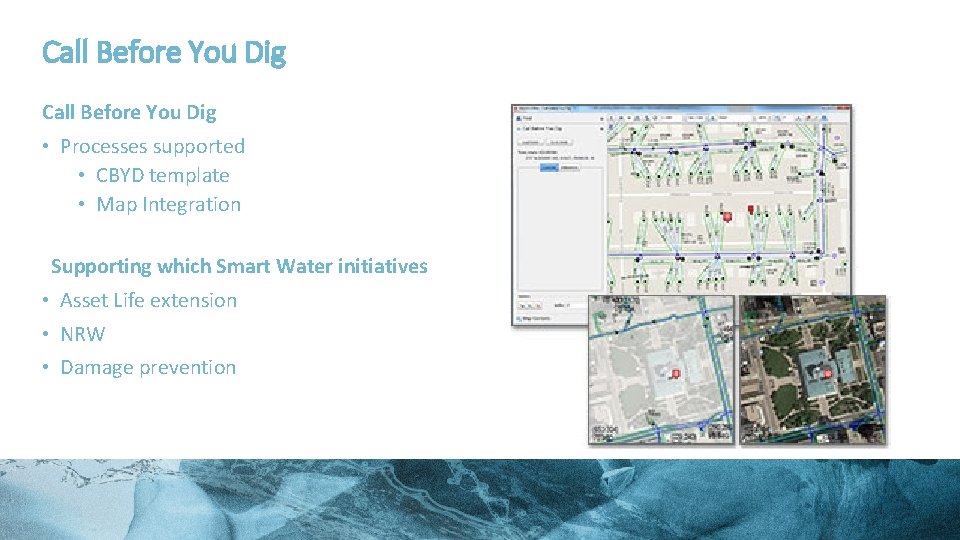
Call Before You Dig • Processes supported • CBYD template • Map Integration Supporting which Smart Water initiatives • Asset Life extension • NRW • Damage prevention
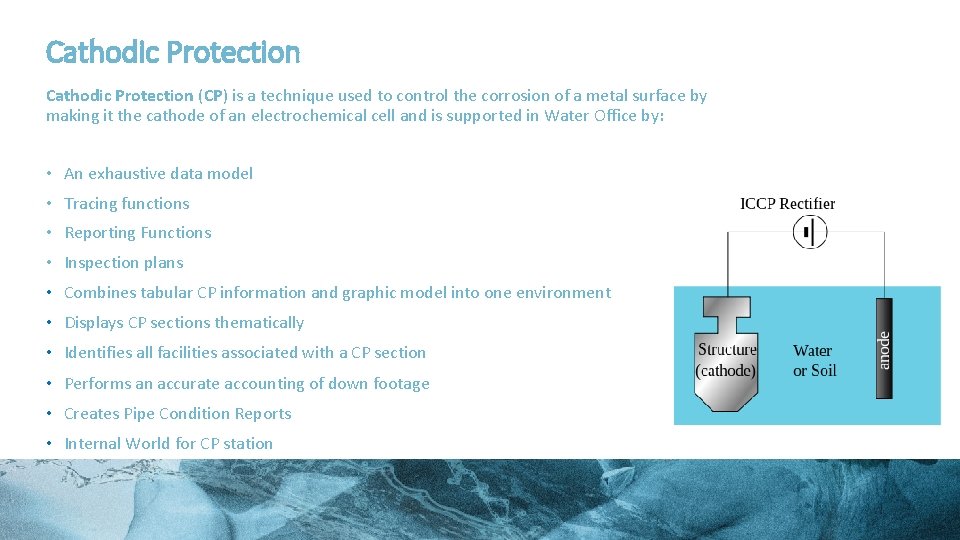
Cathodic Protection (CP) is a technique used to control the corrosion of a metal surface by making it the cathode of an electrochemical cell and is supported in Water Office by: • An exhaustive data model • Tracing functions • Reporting Functions • Inspection plans • Combines tabular CP information and graphic model into one environment • Displays CP sections thematically • Identifies all facilities associated with a CP section • Performs an accurate accounting of down footage • Creates Pipe Condition Reports • Internal World for CP station
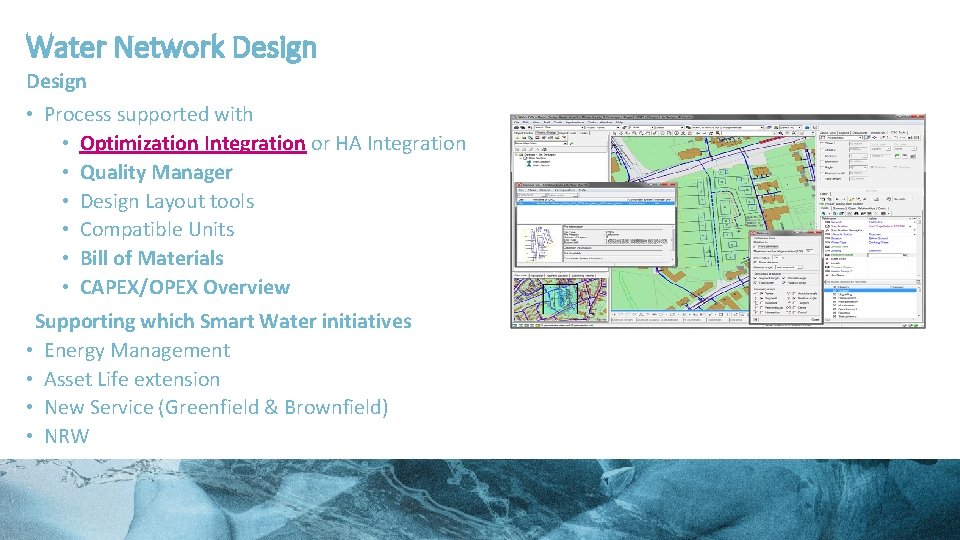
Water Network Design • Process supported with • Optimization Integration or HA Integration • Quality Manager • Design Layout tools • Compatible Units • Bill of Materials • CAPEX/OPEX Overview Supporting which Smart Water initiatives • Energy Management • Asset Life extension • New Service (Greenfield & Brownfield) • NRW
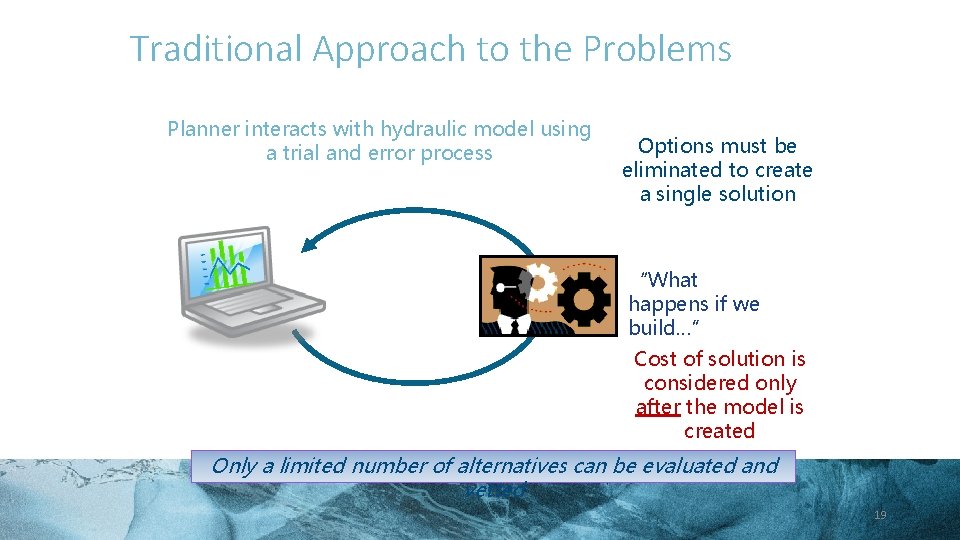
Traditional Approach to the Problems Planner interacts with hydraulic model using a trial and error process Options must be eliminated to create a single solution “What happens if we build…” Cost of solution is considered only after the model is created Only a limited number of alternatives can be evaluated and vetted 19
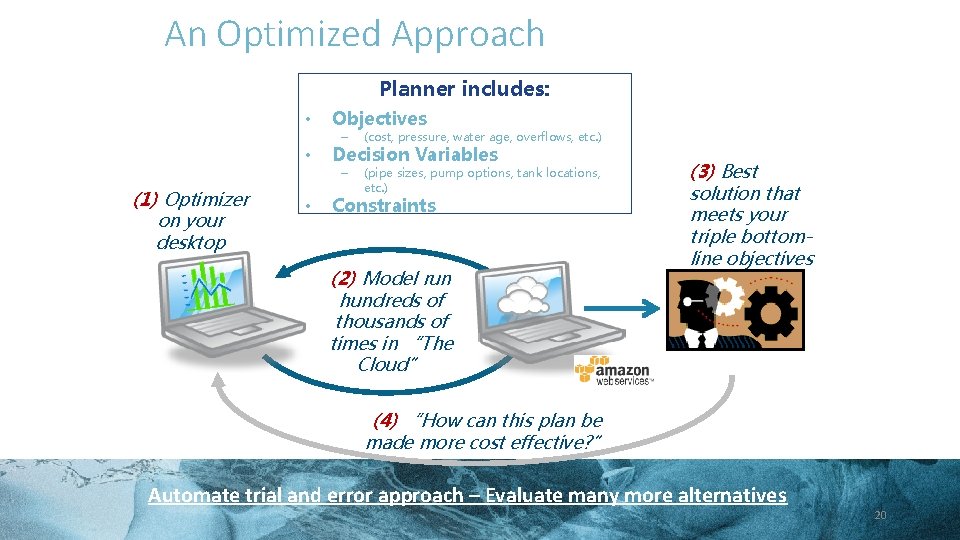
An Optimized Approach Planner includes: • • (1) Optimizer on your desktop • Objectives – (cost, pressure, water age, overflows, etc. ) – (pipe sizes, pump options, tank locations, etc. ) Decision Variables Constraints (2) Model run hundreds of thousands of times in “The Cloud” (3) Best solution that meets your triple bottomline objectives (4) “How can this plan be made more cost effective? ” Automate trial and error approach – Evaluate many more alternatives 20
Self Cleaning Networks or Flushing Application Self Cleaning networks are networks that are that do not need to be cleaned since they are hydraulically modeled to support a self cleaning function. Flushing Application is an excellent, water-efficient method of cleaning water distribution pipes to improve water quality and restore capacity. • Manage this based on Asset information • Plan Flushing activities
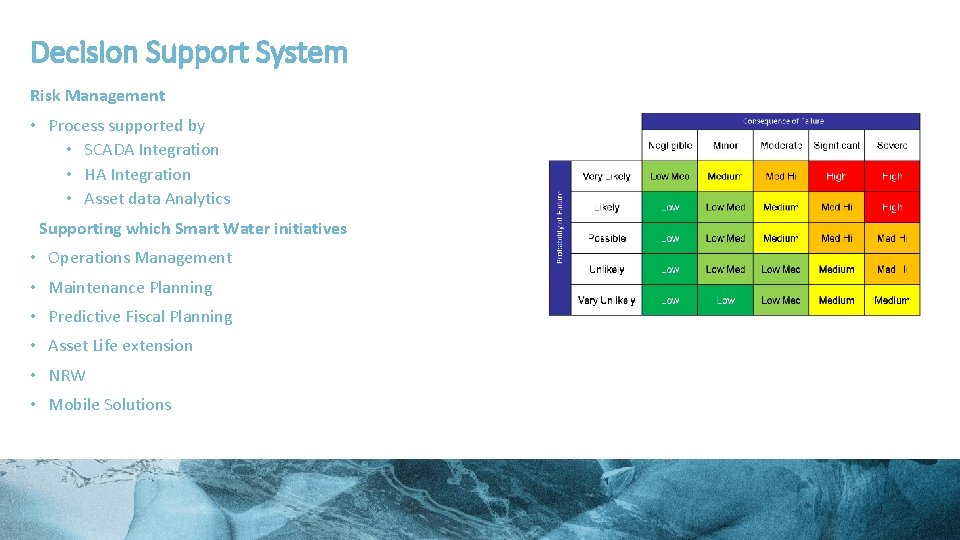
Decision Support System Risk Management • Process supported by • SCADA Integration • HA Integration • Asset data Analytics Supporting which Smart Water initiatives • Operations Management • Maintenance Planning • Predictive Fiscal Planning • Asset Life extension • NRW • Mobile Solutions
Infrastructure Leak Index Calculation of Infrastructure Leakage Index (ILI) The Infrastructure Leakage Index is calculated as follows: ILI = Current Annual Real Losses (CARL) Unavoidable Annual Real Losses (UARL)
Sensor Data, Leak Detection tools, Soil type vs Pipe Material Sensor Data • Acquire data regarding performance of the network Leak Detection tools • Satellite, Ground Penetration Radar, Sonar Soil Types vs Pipe Material • How does pipe material react to various soils and chemicals
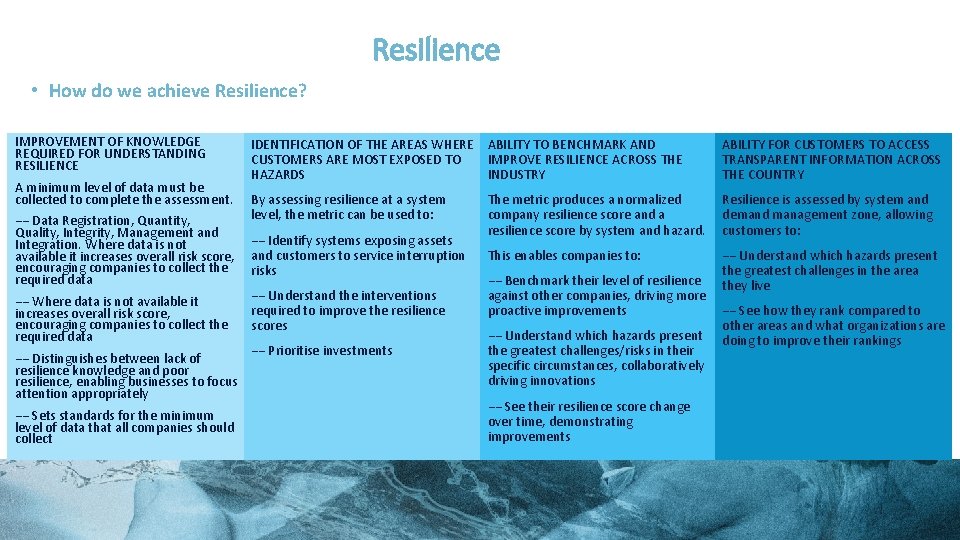
Resilience • How do we achieve Resilience? IMPROVEMENT OF KNOWLEDGE REQUIRED FOR UNDERSTANDING RESILIENCE A minimum level of data must be collected to complete the assessment. −− Data Registration, Quantity, Quality, Integrity, Management and Integration. Where data is not available it increases overall risk score, encouraging companies to collect the required data −− Distinguishes between lack of resilience knowledge and poor resilience, enabling businesses to focus attention appropriately −− Sets standards for the minimum level of data that all companies should collect IDENTIFICATION OF THE AREAS WHERE ABILITY TO BENCHMARK AND CUSTOMERS ARE MOST EXPOSED TO IMPROVE RESILIENCE ACROSS THE HAZARDS INDUSTRY ABILITY FOR CUSTOMERS TO ACCESS TRANSPARENT INFORMATION ACROSS THE COUNTRY By assessing resilience at a system level, the metric can be used to: The metric produces a normalized company resilience score and a resilience score by system and hazard. Resilience is assessed by system and demand management zone, allowing customers to: This enables companies to: −− Understand which hazards present the greatest challenges in the area they live −− Identify systems exposing assets and customers to service interruption risks −− Understand the interventions required to improve the resilience scores −− Prioritise investments −− Benchmark their level of resilience against other companies, driving more proactive improvements −− Understand which hazards present the greatest challenges/risks in their specific circumstances, collaboratively driving innovations −− See their resilience score change over time, demonstrating improvements −− See how they rank compared to other areas and what organizations are doing to improve their rankings
QUESTIONS? John Leeuwenburg john. leeuwenburg@realworld-systems. com Global Product Manager – Realworld Systems Thank You!
- Slides: 26