Research Methods William G Zikmund Bivariate Analysis Measures

Research Methods William G. Zikmund Bivariate Analysis: Measures of Associations

Measures of Association • A general term that refers to a number of bivariate statistical techniques used to measure the strength of a relationship between two variables.

Relationships Among Variables • Correlation analysis • Bivariate regression analysis

Type of Measurement Measure of Association Interval and Ratio Scales Correlation Coefficient Bivariate Regression

Type of Measurement Measure of Association Ordinal Scales Chi-square Rank Correlation

Type of Measurement Measure of Association Nominal Chi-Square Phi Coefficient Contingency Coefficient

Correlation Coefficient • A statistical measure of the covariation or association between two variables. • Are dollar sales associated with advertising dollar expenditures?

The Correlation coefficient for two variables, X and Y is .

Correlation Coefficient • • • r r ranges from +1 to -1 r = +1 a perfect positive linear relationship r = -1 a perfect negative linear relationship r = 0 indicates no correlation

Simple Correlation Coefficient

Simple Correlation Coefficient

Simple Correlation Coefficient Alternative Method = Variance of X = Variance of Y = Covariance of X and Y

Y Correlation Patterns NO CORRELATION X.

Y Correlation Patterns PERFECT NEGATIVE CORRELATION r= -1. 0 X.

Correlation Patterns Y A HIGH POSITIVE CORRELATION r = +. 98 X.

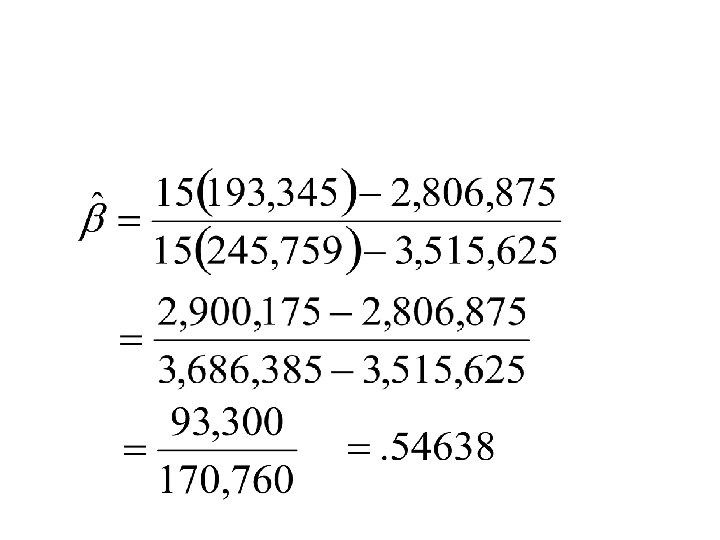
Calculation of r Pg 629

Coefficient of Determination

Correlation Does Not Mean Causation • High correlation • Rooster’s crow and the rising of the sun – Rooster does not cause the sun to rise. • Teachers’ salaries and the consumption of liquor – Covary because they are both influenced by a third variable

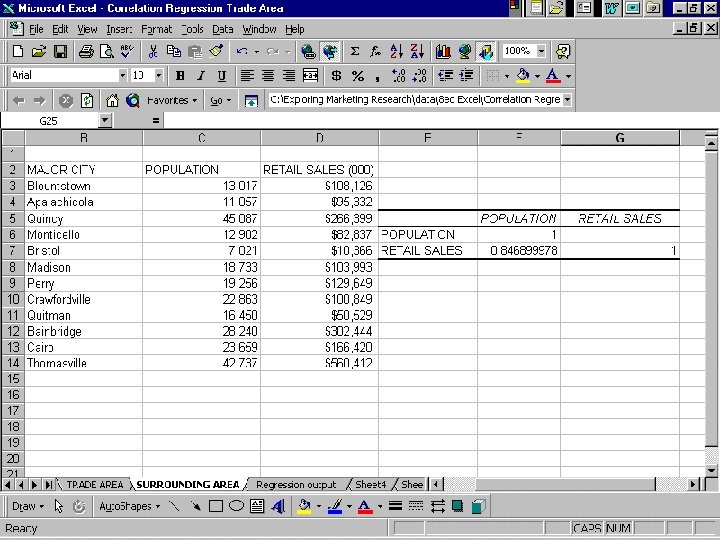
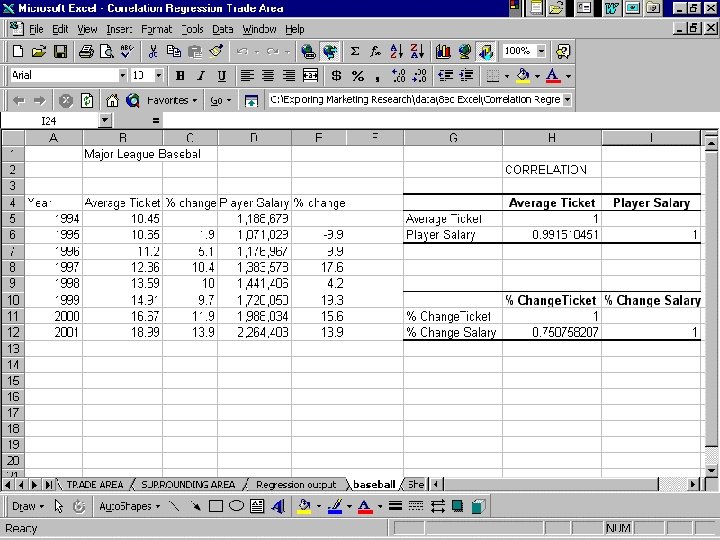
Correlation Matrix • The standard form for reporting correlational results.

Correlation Matrix

Walkup’s First Laws of Statistics • Law No. 1 – Everything correlates with everything, especially when the same individual defines the variables to be correlated. • Law No. 2 – It won’t help very much to find a good correlation between the variable you are interested in and some other variable that you don’t understand any better.

Walkup’s First Laws of Statistics • Law No. 3 – Unless you can think of a logical reason why two variables should be connected as cause and effect, it doesn’t help much to find a correlation between them. In Columbus, Ohio, the mean monthly rainfall correlates very nicely with the number of letters in the names of the months!

Regression DICTIONARY DEFINITION GOING OR MOVING BACKWARD Going back to previous conditions l Tall men’s sons

Bivariate Regression • A measure of linear association that investigates a straight line relationship • Useful in forecasting

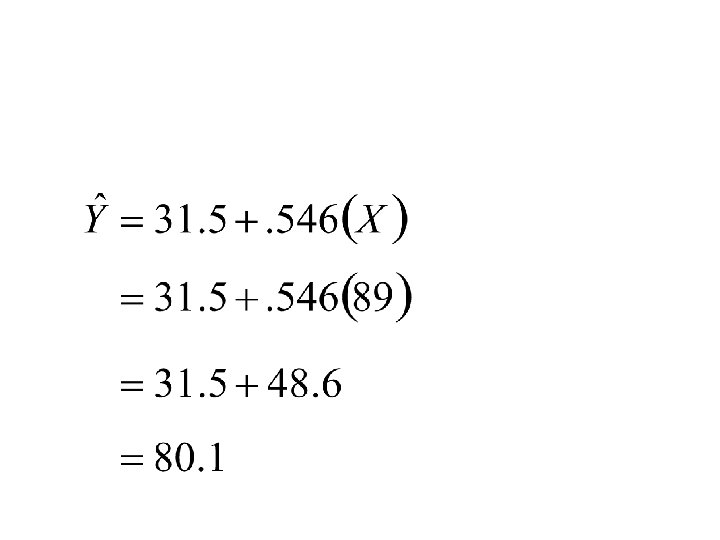
Bivariate Linear Regression • A measure of linear association that investigates a straight-line relationship • Y = a + b. X • where • Y is the dependent variable • X is the independent variable • a and b are two constants to be estimated

Y intercept • a • An intercepted segment of a line • The point at which a regression line intercepts the Y-axis

Slope • b • The inclination of a regression line as compared to a base line • Rise over run • D - notation for “a change in”

Scatter Diagram and Eyeball Forecast Y 160 150 My line 140 Your line 130 120 110 100 90 80 X 70 80 90 100 110 120 130 140. 150 160 170 180

Regression Line and Slope Y 130 120 110 100 90 80 80 90 100 110 120 130 140 150 160 170 X . 180

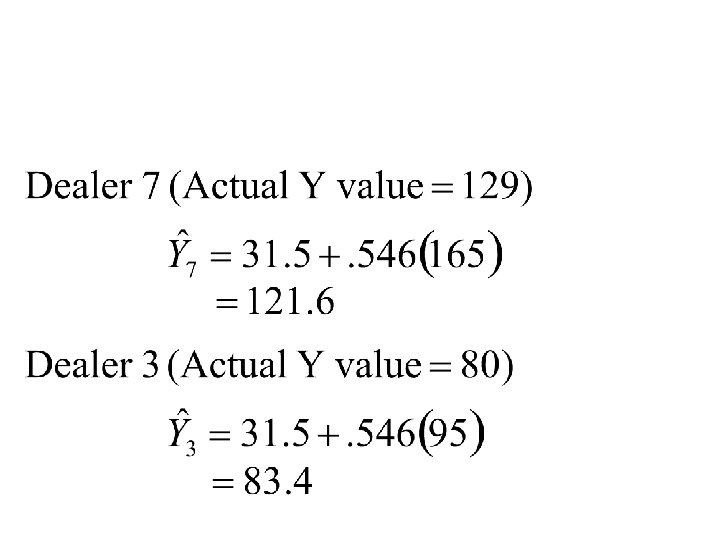
Least-Squares Regression Line Y 160 150 140 Actual Y for Dealer 7 130 120 Y “hat” for Dealer 7 110 Y “hat” for Dealer 3 100 90 Actual Y for Dealer 3 80 70 80 90 100 110 120 130 140 150 160 170 X 180

Y Scatter Diagram of Explained and Unexplained Variation 130 } 120 Total deviation 110 Deviation not explained {} Deviation explained by the regression 100 90 80 80 90 100 110 120 130 140 150 160 170 X . 180

The Least-Square Method • Uses the criterion of attempting to make the least amount of total error in prediction of Y from X. More technically, the procedure used in the least-squares method generates a straight line that minimizes the sum of squared deviations of the actual values from this predicted regression line.

The Least-Square Method • A relatively simple mathematical technique that ensures that the straight line will most closely represent the relationship between X and Y.

Regression - Least-Square Method
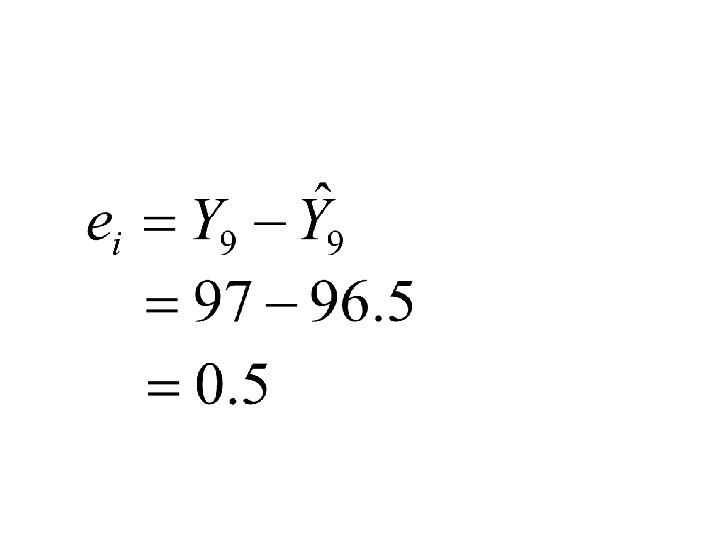
 = actual value of the dependent variable = estimated value")
= - (The “residual”) = actual value of the dependent variable = estimated value of the dependent variable (Y hat) n = number of observations i = number of the observation

The Logic behind the Least. Squares Technique • No straight line can completely represent every dot in the scatter diagram • There will be a discrepancy between most of the actual scores (each dot) and the predicted score • Uses the criterion of attempting to make the least amount of total error in prediction of Y from X

Bivariate Regression

Bivariate Regression
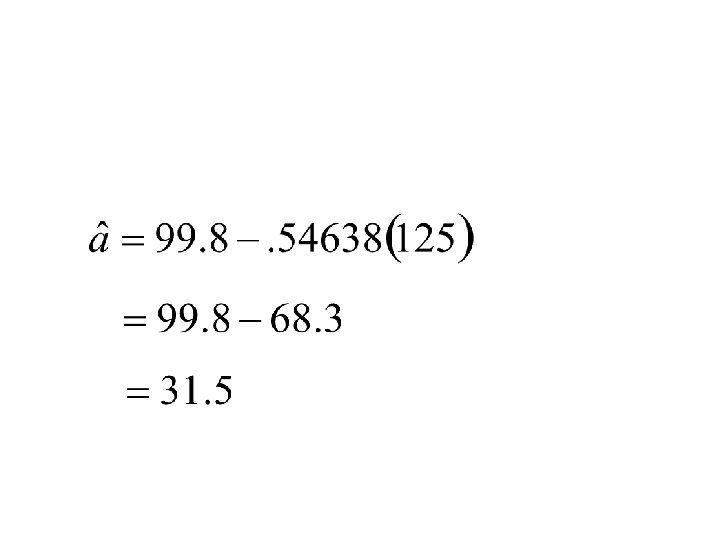
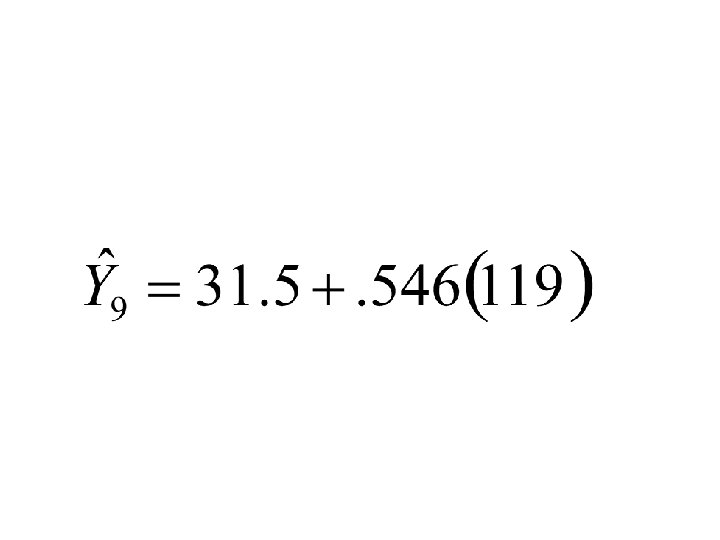
 = estimated intercept of the")
= estimated slope of the line (the “regression coefficient”) = estimated intercept of the y axis = dependent variable = mean of the dependent variable = independent variable = mean of the independent variable = number of observations


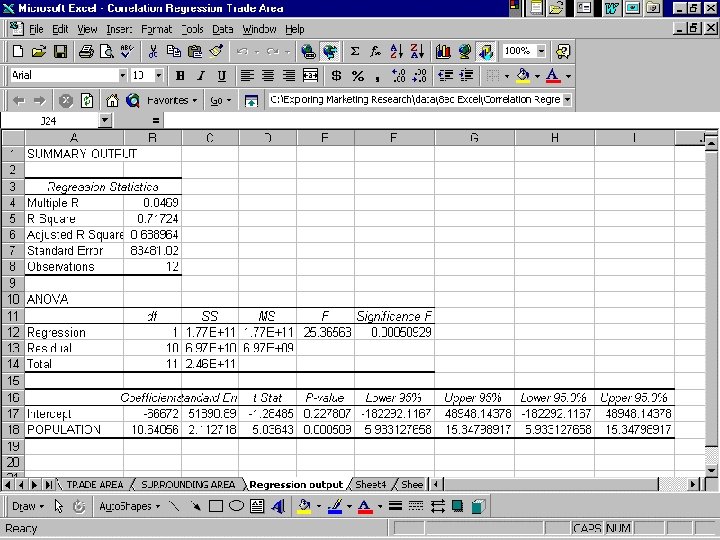
 • A procedure to determine whethere is more variability explained by the")
F-Test (Regression) • A procedure to determine whethere is more variability explained by the regression or unexplained by the regression. • Analysis of variance summary table

Total Deviation can be Partitioned into Two Parts • Total deviation equals • Deviation explained by the regression plus • Deviation unexplained by the regression

“We are always acting on what has just finished happening. It happened at least 1/30 th of a second ago. We think we’re in the present, but we aren’t. The present we. know is only a movie of the past. ” Tom Wolfe in The Electric Kool-Aid Acid Test

Partitioning the Variance Deviation unexplained by Total = explained by the + the regression deviation regression (Residual error)

= Mean of the total group = Value predicted with regression equation = Actual value
")
Total variation explained Explained = variation Unexplained + variation (residual)

Sum of Squares

Coefficient of Determination 2 r • The proportion of variance in Y that is explained by X (or vice versa) • A measure obtained by squaring the correlation coefficient; that proportion of the total variance of a variable that is accounted for by knowing the value of another variable

Coefficient of Determination r 2

Source of Variation • Explained by Regression • Degrees of Freedom – k-1 where k= number of estimated constants (variables) • Sum of Squares – SSr • Mean Squared – SSr/k-1

Source of Variation • Unexplained by Regression • Degrees of Freedom – n-k where n=number of observations • Sum of Squares – SSe • Mean Squared – SSe/n-k

2 r in the Example

Multiple Regression • Extension of Bivariate Regression • Multidimensional when three or more variables are involved • Simultaneously investigates the effect of two or more variables on a single dependent variable • Discussed in Chapter 24

Correlation Coefficient, r =. 75
- Slides: 66