Research Methods Why do we have to learn


 to observe")


- Slides: 22
Research Methods
Why do we have to learn this stuff? Psychology is first and foremost a science and based on research.
Hindsight Bias The tendency to believe, after learning the outcome, that you knew it all along. Monday Morning Quarterbacking!!!
Overconfidence We tend to think we know more than we do. 82% of U. S. drivers consider themselves to be in the top 30% of their group in terms of safety. 81% of new business owners felt they had an excellent chance of their businesses succeeding. When asked about the success of their peers, the answer was only 39%. (Now that's overconfidence!!!)
Critical thinking Thinking that does not blindly accept arguments and conclusions – examines assumptions, discerns hidden values, evaluated evidence and assesses conclusions.
Scientific Method: Asking and Answering Research Questions Theory: an explanation using an integrated set of principles that organizes observations and predicts behaviors or events. Ex: Kitty Genovese - Bystander Effect Hypothesis: A prediction, stemming from a theory, stated in a way that allows it to be tested. Teachers with more experience produce greater student success. Operational definitions: a statement of procedures (operations) used to define research variables. Ex: Student success = End of course grades OR Attrition OR satisfaction
Validity and Reliability Valid: Measures what it sets out to measure Reliable: Can be replicate; its consistent. When conducted in same way it would achieve similar results.
Obtaining Representative Sample Population: all the cases in a group being studied, from which samples may be drawn. Ex: All public school student grades 9 -12 Random Sample: a sample that fairly represents a population because each member has equal chance of inclusion. Stratified sampling: allows researcher to represent the population on some criteria. School pop = 1000 students (500 Caucasian; 300 African American; 200 Latino) Sample 100 students: 50 Caucasians; 30 African Americans and 20 Latinos
Describing Behavior Case Study: Observation technique – single person is studied in depth. Survey: Sample of people are chosen to represent a larger population are asked a series of questions, about their behavior, thoughts or attitudes.
Describing Behavior Naturalistic Observation: observing and recording behavior in naturally occurring situations without trying to manipulate or control situation.
Correlation Correlation: a measure of the extent to which two factors vary together, and how well they predict one another. Correlation Coefficient: statistical measure of how closely variables are related. Positive Correlation: value of 1 variable increases with the value of another (represented by positive number +1. 0) Negative Correlation: as the value of 1 variable increases the value of the other decreases (represented by a negative number -1. 0) Scatterplots: graphed cluster of dots, each of which represents values of two variables. Slope and points suggests direction of relationship and amount of scatter the strength of correlation
Illusory Correlations A perceived but nonexistent correlation. We are sensitive to dramatic and unusual events. (Ex: infertile couples who adopt become more likely to conceive. )
Experimentation Experiment: method which an investigator manipulates one or more factors (IV) to observe the effect on some behavior or mental process (DV). Random assignment minimizes preexisting differences between groups. Double-Blind Procedure: Neither researchers or participants know which groups is receiving treatment. WHY? !? Placebo Effect: Results caused by expectations alone
EXPERIMENTATION Independent Variable: the experimental factor that is manipulated. Confounding variables: factors other than IV that might produce an effect on experiment. Random assignment diminishes this problem. Dependent Variable: outcome factor; variable that may change in response to change in IV
Descriptive Statistics Provides a way to describe/summarize a set of data. Measures of Central Tendency: Mean: arithmetic average Most common but accuracy is distorted by outliers (i. e. extreme scores) Median: the middle score in a distribution Better measure of CT when outliers exist. Mode: most frequently occurring score(s) in a distribution.
Descriptive Statistics Measures of Variability/Variation: Range: difference b/w the highest and lowest scores in a distribution. Variance: used to measure how widely individuals in a group vary. Average of the squared differences from the mean. (i. e. find mean, then for each data point subtract the mean and square difference) Standard deviation: is the square root of the variance
Descriptive Statistics Normal curve: bell-shaped distribution that is very typical (most cases fall towards the mean). Z-scores: measures the distance of a score from the mean in units of standard deviation.
Inferential Statistics Is used to determine if findings can be applied to a larger population from which sample was selected. Variety of different statistical tests exist: T-tests Chi-square ANOVAs Statistical Significance: how likely it is that an obtained result occurred by chance. All inferential statistics yield a p-value. The smaller the p value the more significant the results Cut-off is. 05 for statistical significance = 5% of chance results occur by chance.
T-Test With data aggregated at the instructor level, a paired t-test with a single within-instructor variable (i. e. traditional vs. online course format) was run in order to compare any statistical significance of means between the two groups. The null hypothesis was tested where the mean difference in student achievement under the two conditions was zero against the alternative hypothesis that mean difference in varying course formats is greater than zero, that is, that student achievement in traditional courses is greater than in online courses. Equation 1. H 0 : = δ = μ 1 – μ 2 = 0 Ha : = δ = μ 1 – μ 2 > 0 The results indicated no effect of course format (t = -0. 014, p = 0. 98) -traditional and online confidence levels are not significantly different. This suggests that student outcome scores did not differ between course format.
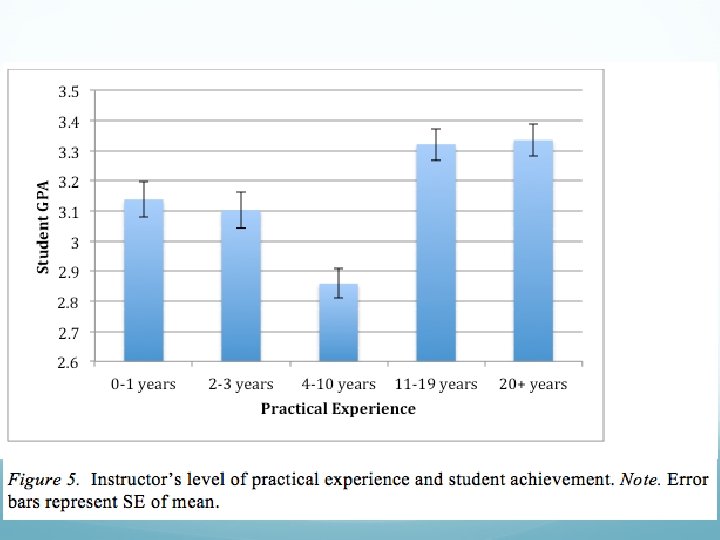
Multiple regression Regression of Instructor Qualities’ and Student Achievement; B = estimate, SE = standard error, t and p-value. * p <. 05, ** p <. 01, *** p <. 001. Experience (V 12) = 3 -5 years, V 13 = 6 -9 years, V 14 = 10+ years – Education Level (2) = Professional, Education Level 3 = Doctorate – Practical Experience 2 = 2 -3 years, Practical Experience 3 = 4 -10 years, Practical Experience 4 = 11 -19 years, Practical Experience 5 = 20+ years The MLR analysis shown in Table 9 indicates an R 2 = 0. 056, or roughly 5. 6% of the variance in student achievement was explained by the predictor variables -- F(9, 4722) = 31. 38, MS =1. 137 p <. 001).
APA Ethical Guidelines Any type of academic research must be proposed to the ethics or institutional review board (IRB). See animal/human research handout!!