Research Methods Research Methods Observation Case Studies Surveys

Research Methods

Research Methods Observation Case Studies Surveys Correlational Research Experimental Research

Naturalistic Observation Three goals 1. To gather information. 2. To predict If you can establish relationships among variables. (Correlations) 3. To explain if you can establish cause and effect relationships. (Through experiments)

Observation without intervention Observation of behavior in a natural setting, without any attempt to intervene.

Advantages Allows observation of behavior exactly as it occurs in the real world. Helps to establish external validity of the research findings. Ethical considerations may prevent the manipulation of a variable. Ex. Psychologists who study reactions to school shootings.

Drawbacks Reactivity - where a subject’s behavior is different when the person knows they are being observed. The subject’s expectations about what the experiment is about can change their responses.

The Hawthorn Effect

How do we avoid Reactivity? Unobtrusive observation - Don’t let people know that they’re being observed. Deception - Don’t tell the subject the real reason for conducting the study. Blind study - The experimenter can conduct the study so that the subject is blind as to their role in the study. Double-blind study - Both the subject and the experimenter are blind to the purpose.

Observation WITH intervention Observation of behavior in a natural setting where the researcher manipulates part of the interaction.


Why intervene? Helps to cause an event that occurs infrequently in nature. Allows us to arrange conditions so that important variables are controlled and consequent behaviors can be observed.

Data Collecting techniques Narrative record – Write out what you are observing as it happens. Later on you review the notes and try to organize your findings. Recording – Limits bias of what gets recorded and what doesn’t. Coding data - the process of assigning a different number to each category of the behavior being observed.

Coded Data in action Break up into groups of 3 1 will be the observer, the other two will be the subjects.

We have data, now what?

Lunch Room Observations Complete the worksheet provided for questions 1 and 2 individually. Once you have finished you and your partner should move on collectively for questions 3 and 4.

What can we say about student behavior in the lunchroom?

Parts of an Experiment Variables – factors that are changed in an experiment. Independent Variable – factor that is changed during an experiment (What is changing) Dependent Variable – factor that is effected when the independent variable is manipulated (What it causes)

While you watch, what is the dependent and independent variables?

Experimental group – Group that is going to receive the manipulation or experiment Control group – believes they are part of the experiment but it is their normal responses they are not manipulated When both groups are used it is called a controlled experiment and carries more validity **CAUTION** Remember the Placebo Effect!

Example: Hypothesis: Students in a slightly warmer and noisier room will perform more poorly than students in a room that is normal in terms of both temperature and noise.

Control Group They take a math exam in their normal classroom. The room is quiet for the duration of the test and the room temperature is set as a comfortable 70 degrees Fahrenheit.

Experimental Group Students take the exact same test in the exact same classroom, but this time the independent variables are manipulated by the experimenter. A series of loud, banging noises are produced in the classroom next door, creating the impression that some type of construction work is taking place next door.

While you watch…. Make a hypothesis after the intro. What is the independent variable? What is the dependent variable? Was the hypothesis proved?


Analyze the Results Correlation – how closely is one thing related to another? Positive Correlation – as one thing goes up so does the other (Salaries / Education ex) Negative Correlation – as one goes up the other goes down (Stress / health ex) Just because there is a correlation does not mean that one causes the other. It simply means you measure a connection that was affected during your experiment

Create your own Observation with intervention An editable document is on the website titled “Second Observation” for your convenience.

Do Now Get a laptop and complete the post observation questions from the assignment. Email completed assignments to steve. odonnell@wattsburg. org

Surveys

Lets take a couple Use your phone or a laptop Go to the unit 1 page of our Psychology website. Click on the link to the right that says “Interest Survey” and take the quiz. After that… Click on the link that says “interest survey 2”

Did you have difficulty answering any of them? Which Were one did you like best? they flawed? How so? Which one is more reliable?

The Psychology of taking a survey… Respondents must interpret the question, retrieve relevant information from memory, form a judgment, convert that judgment into one of the response options provided, and finally edit their response as necessary.

How many drinks do you consume in a typical day? _____ a lot more than average _____ somewhat fewer than average _____ a lot fewer than average

Open Ended Questions – Participants respond however they see fit. Example: How much liquid do you drink in a day? What types of liquid do you drink daily? Advantages: Avoids influencing responses. Easy to write Cons: More time consuming on the participant. Harder to analyze results.

Closed-ended items ask a question and provide a set of response options for participants to choose from. Ex: On a scale of 0 (no pain at all) to 10 (worst pain ever experienced), how much pain are you in right now? Advantages Quick for people to complete. Focus on specific variables they wish to study. Cons Difficult to write Limits what information can be gathered Can be confusing for participants if poorly worded

Formatting the Questionnaire Have an introduction 1. Encourage people to take the survey 2. Established informed consent by… 1. Tell them the topic 2. Inform them of the time it will take 3. Tell them they can withdraw at any time 4. Inform them of confidentiality

Other helpful tips Start with the most important items for purposes of the research and proceed to less important items. Items should also be grouped by topic or by type. Ex: items using the same rating scale (e. g. , a 5 -point agreement scale) should be grouped together if possible to make things easier.

Lets Make a survey! Create a survey based off of the topic picked Friday. Using office 365 Forms create your survey. Share the survey with me @ steve. odonnell@wattsburg. org Must be at least 15 questions and follow best practices discussed in class. The survey will need to be administered to your friends via social media. OR via paper form. We will share our results on Thursday. Can be open ended or closed… your choice.

Discuss with a partner that you DID NOT work with on the survey… What are you trying to uncover in your survey? Have you received any results and if so what have you found?

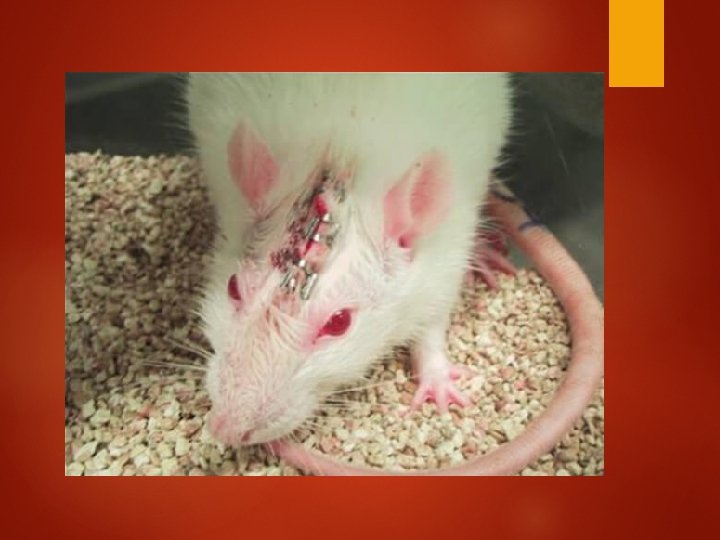
Ethics in research

- Worldwide it is estimated that the number of animals used is in the tens of millions a year. - One estimate of mice and rats used in the US alone in 2010 was 92 million. Most are euthanized after the experiment. -

What is being tested? 90 -95% of the animals used have been rodents and mice, principally rats, mice, and pigeons. Cats are most commonly used in neurological research half of whom were used in experiments which cause "pain and/or distress". 26, 000/year Small % use Primates for correlational studies.

Treatment of Humans The APA’s code of ethics Informed Consent Informed of the nature of the study Risks and possible effects must be spelled out Cannot deceive about risks

Psychology research gone wrong…

Analyze your results Write a 2 page paper that explains the results of your survey research. What kind of survey did you use? What did the data show you? Can you conclude anything from your research? What could have been done differently? How can this data be used to make our world a better place? Print off your analysis AND your data from 365 forms and put in the mesh.
- Slides: 45