
Research Institute of Organic Agriculture Fi BL info
Research Institute of Organic Agriculture Fi. BL info. suisse@fibl. org, www. fibl. org Organic agriculture worldwide 2017 - Graphs Helga Willer and Julia Lernoud Research Institute of Organic Agriculture Fi. BL, Frick, Switzerland Branchenpressekonferenz zur BIOFACH Messezentrum Nürnberg, February 13, 2019
www. fibl. org 2
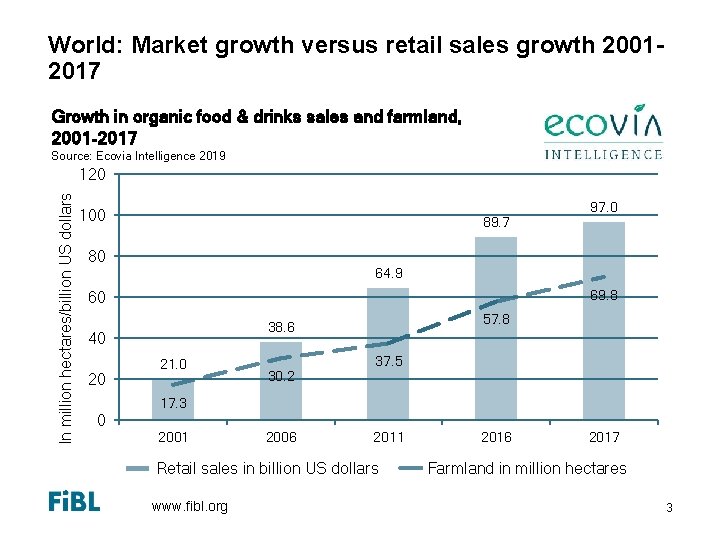
World: Market growth versus retail sales growth 20012017 Growth in organic food & drinks sales and farmland, 2001 -2017 Source: Ecovia Intelligence 2019 In million hectares/billion US dollars 120 100 89. 7 97. 0 80 64. 9 69. 8 60 40 20 57. 8 38. 6 21. 0 30. 2 37. 5 17. 3 0 2001 2006 2011 Retail sales in billion US dollars www. fibl. org 2016 2017 Farmland in million hectares 3
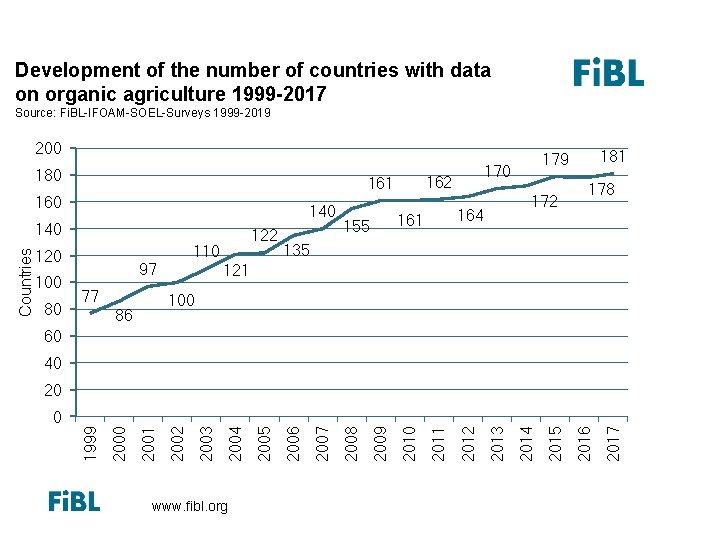
Development of the number of countries with data on organic agriculture 1999 -2017 Source: Fi. BL-IFOAM-SOEL-Surveys 1999 -2019 200 180 160 140 120 100 80 77 122 110 97 164 161 155 172 178 135 121 100 86 60 40 20 www. fibl. org 2017 2016 2015 2014 2013 2012 2011 2010 2009 2008 2007 2006 2005 2004 2003 2002 2001 2000 0 1999 Countries 140 170 162 161 181 179
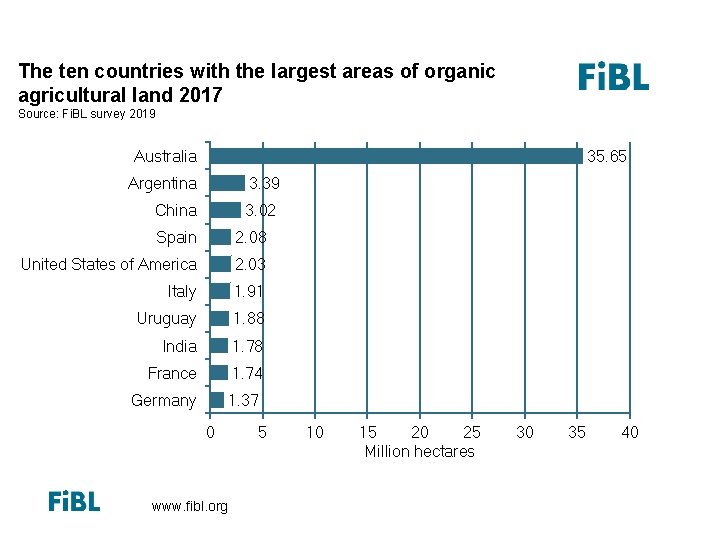
The ten countries with the largest organic agricultural land 2013 The ten countries with the largest areas of organic agricultural land 2017 Source: Fi. BL survey 2019 Australia 35. 65 Argentina 3. 39 China 3. 02 Spain 2. 08 United States of America 2. 03 Italy 1. 91 Uruguay 1. 88 India 1. 78 France 1. 74 Germany 1. 37 0 www. fibl. org 5 10 15 20 25 Million hectares 30 35 40
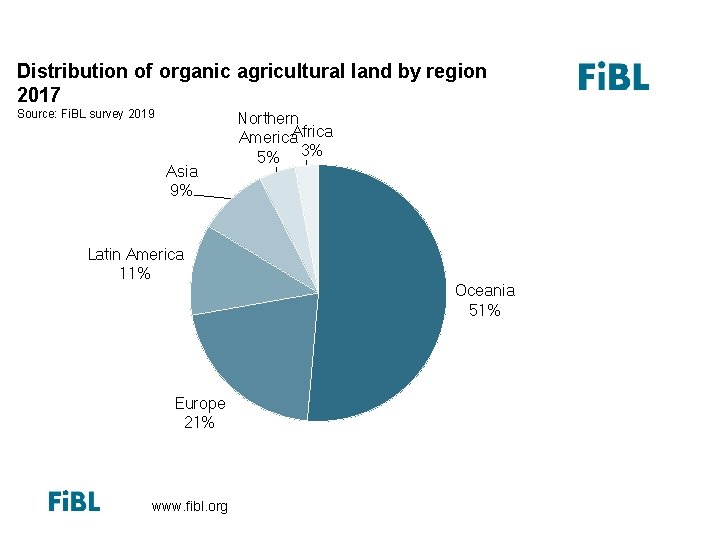
Distribution of organic agricultural land by region 2013 Distribution of organic agricultural land by region 2017 Source: Fi. BL survey 2019 Asia 9% Latin America 11% Europe 21% www. fibl. org Northern America. Africa 5% 3% Oceania 51%
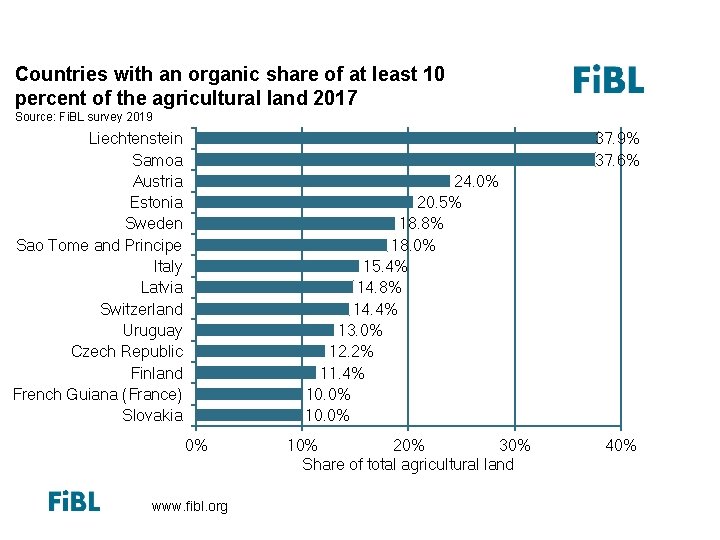
The eleven countries with the highest shares of organic agricultural land 2013 Countries with an organic share of at least 10 percent of the agricultural land 2017 Source: Fi. BL survey 2019 Liechtenstein Samoa Austria Estonia Sweden Sao Tome and Principe Italy Latvia Switzerland Uruguay Czech Republic Finland French Guiana (France) Slovakia 37. 9% 37. 6% 24. 0% 20. 5% 18. 8% 18. 0% 15. 4% 14. 8% 14. 4% 13. 0% 12. 2% 11. 4% 10. 0% 0% www. fibl. org 10% 20% 30% Share of total agricultural land 40%
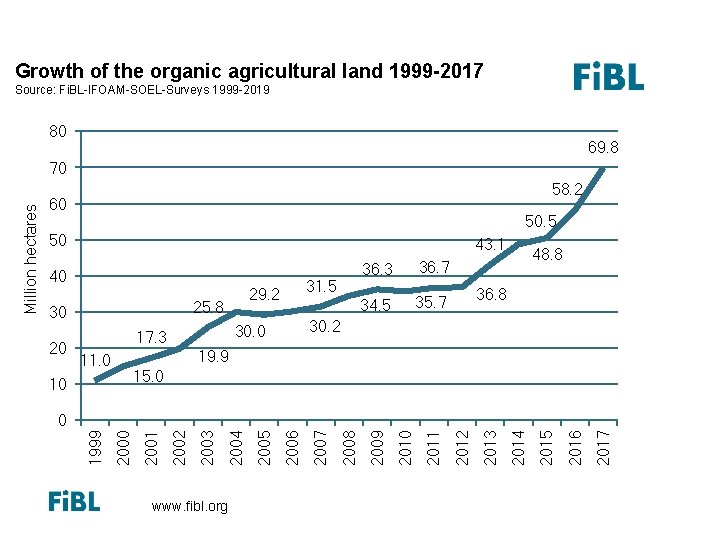
Growth of the organic agricultural land 1999 -2013 Growth of the organic agricultural land 1999 -2017 Source: Fi. BL-IFOAM-SOEL-Surveys 1999 -2019 80 69. 8 58. 2 60 50. 5 50 43. 1 40 30 20 31. 5 29. 2 25. 8 36. 3 36. 7 34. 5 35. 7 48. 8 36. 8 30. 2 30. 0 17. 3 19. 9 11. 0 15. 0 10 www. fibl. org 2017 2016 2015 2014 2013 2012 2011 2010 2009 2008 2007 2006 2005 2004 2003 2002 2001 2000 0 1999 Million hectares 70
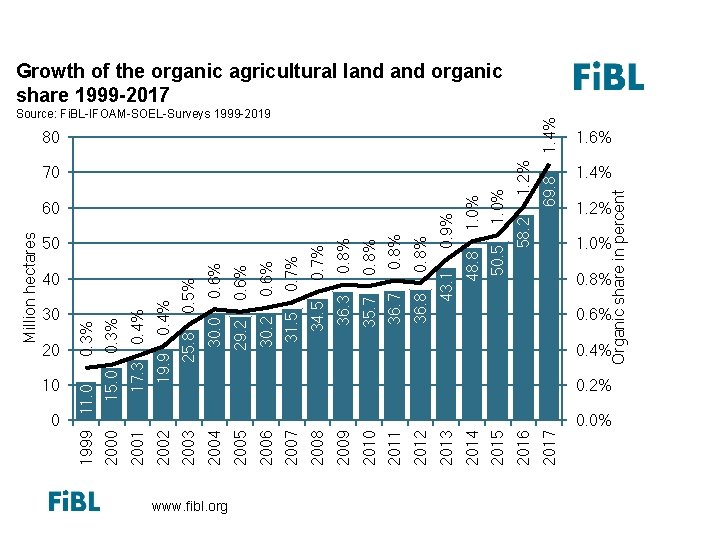
10 0 www. fibl. org 1. 0% 0. 8% 0. 6% 0. 4% Organic share in percent 1. 4% 80 69. 8 1. 2% 1. 0% 58. 2 50. 5 48. 8 Source: Fi. BL-IFOAM-SOEL-Surveys 1999 -2019 2017 0. 8% 36. 8 70 2016 2015 2014 0. 8% 36. 7 0. 9% 0. 8% 35. 7 43. 1 0. 8% 36. 3 60 2013 2012 2011 2010 2009 0. 7% 0. 6% 34. 5 31. 5 30. 2 29. 2 30. 0 0. 5% 50 2008 2007 2006 2005 2004 25. 8 0. 4% 0. 3% 19. 9 17. 3 15. 0 40 2003 2002 2001 2000 20 0. 3% 30 1999 11. 0 Million hectares Growth of the organic agricultural land 1999 -2013 Growth of the organic agricultural land organic share 1999 -2017 1. 6% 1. 4% 1. 2% 0. 0%
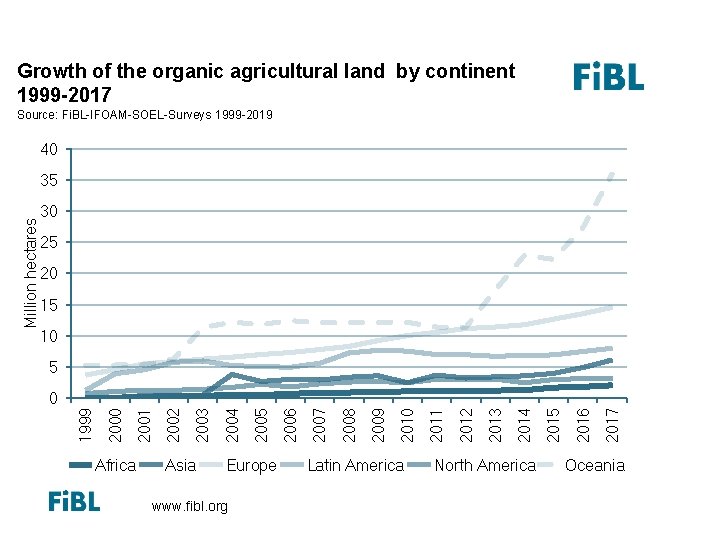
Growth of the organic agricultural land by continent 1999 -2013 Growth of the organic agricultural land by continent 1999 -2017 Source: Fi. BL-IFOAM-SOEL-Surveys 1999 -2019 40 30 25 20 15 10 5 Africa Asia Europe www. fibl. org Latin America North America 2017 2016 2015 2014 2013 2012 2011 2010 2009 2008 2007 2006 2005 2004 2003 2002 2001 2000 0 1999 Million hectares 35 Oceania
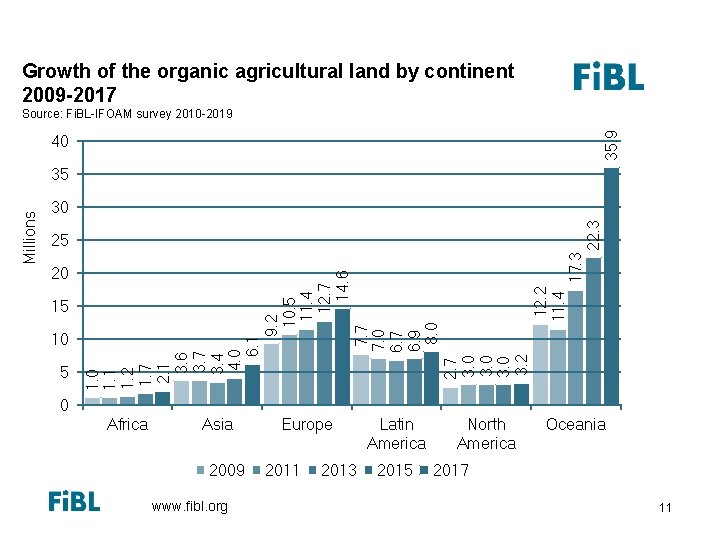
Growth of the organic agricultural land by continent 20052013 Growth of the organic agricultural land by continent 2009 -2017 35. 9 Source: Fi. BL-IFOAM survey 2010 -2019 40 22. 3 30 25 20 15 10 5 1. 0 1. 1 1. 2 1. 7 2. 1 3. 6 3. 7 3. 4 4. 0 6. 1 9. 2 10. 5 11. 4 12. 7 14. 6 7. 7 7. 0 6. 7 6. 9 8. 0 2. 7 3. 0 3. 2 12. 2 11. 4 17. 3 Millions 35 0 Africa Asia 2009 www. fibl. org Europe 2011 2013 Latin America 2015 North America Oceania 2017 11
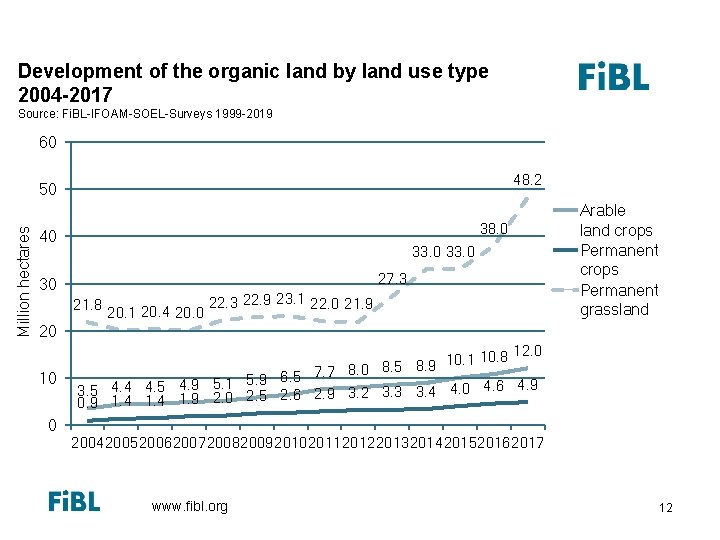
Growth of the organic land by land use type 2004 -2013 Development of the organic land by land use type 2004 -2017 Source: Fi. BL-IFOAM-SOEL-Surveys 1999 -2019 60 48. 2 Million hectares 50 38. 0 40 33. 0 27. 3 30 21. 8 20. 1 20. 4 20. 0 22. 3 22. 9 23. 1 22. 0 21. 9 Arable land crops Permanent grassland 20 10. 8 12. 0 10. 1 7. 7 8. 0 8. 5 8. 9 6. 5 5. 1 5. 9 3. 5 4. 4 4. 5 4. 9 2. 0 2. 5 2. 6 2. 9 3. 2 3. 3 3. 4 4. 0 4. 6 4. 9 0. 9 1. 4 1. 9 20042005200620072008200920102011201220132014201520162017 www. fibl. org 12
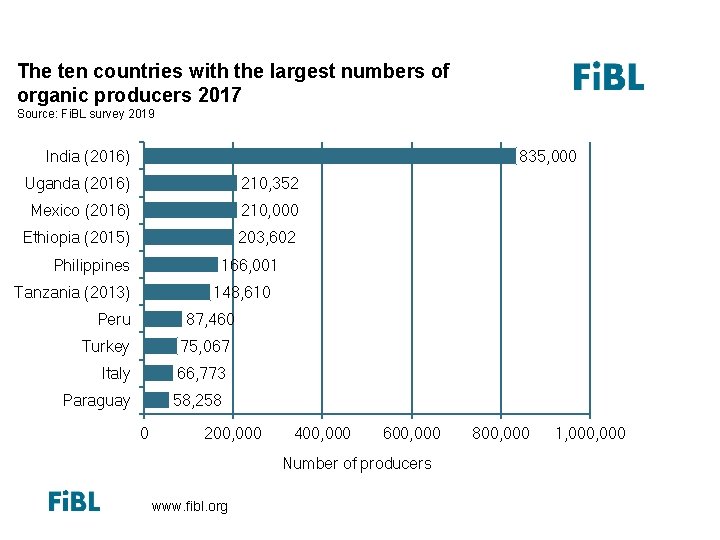
The ten countries with the largest numbers of organic producers 2013 The ten countries with the largest numbers of organic producers 2017 Source: Fi. BL survey 2019 835, 000 India (2016) Uganda (2016) 210, 352 Mexico (2016) 210, 000 Ethiopia (2015) 203, 602 Philippines 166, 001 Tanzania (2013) 148, 610 Peru 87, 460 Turkey 75, 067 Italy 66, 773 Paraguay 58, 258 0 200, 000 400, 000 600, 000 Number of producers www. fibl. org 800, 000 1, 000
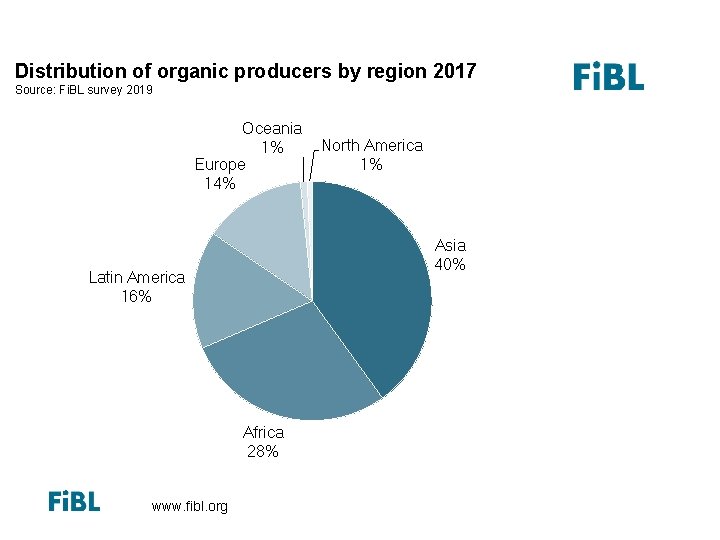
Organic producers by region 2013 Distribution of organic producers by region 2017 Source: Fi. BL survey 2019 Oceania 1% Europe 14% Asia 40% Latin America 16% Africa 28% www. fibl. org North America 1%
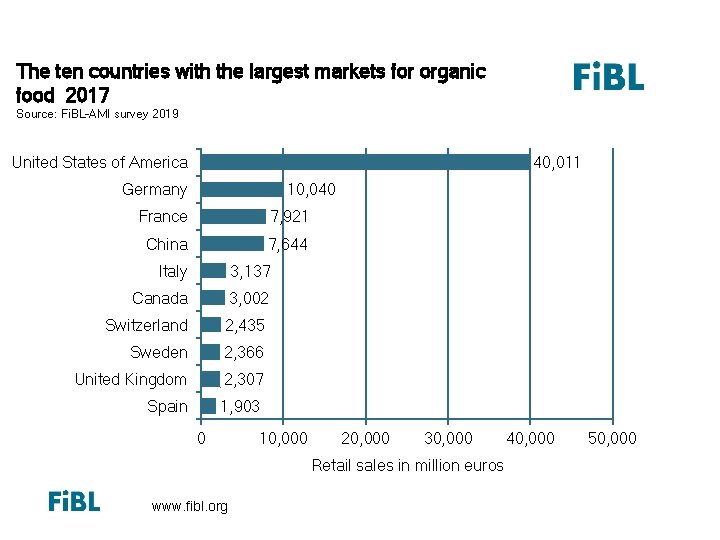
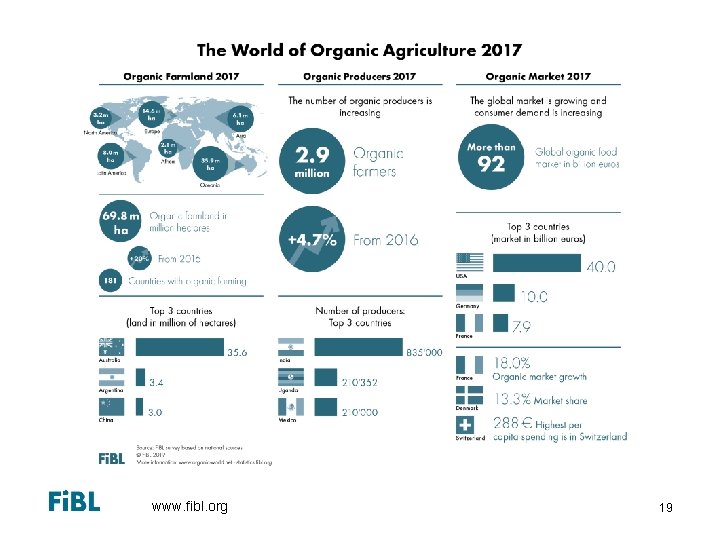
The ten countries with the largest markets for organic food 2017 Source: Fi. BL-AMI survey 2019 United States of America 40, 011 Germany 10, 040 France 7, 921 China 7, 644 Italy 3, 137 Canada 3, 002 Switzerland 2, 435 Sweden 2, 366 United Kingdom 2, 307 Spain 1, 903 0 10, 000 20, 000 30, 000 Retail sales in million euros www. fibl. org 40, 000 50, 000
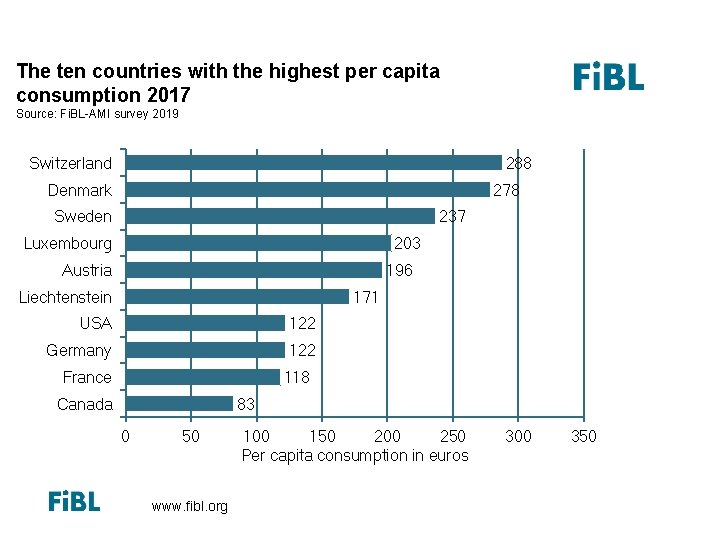
The ten countries with the largest per capita consumption for 2013 The ten countries with the highest per capita consumption 2017 Source: Fi. BL-AMI survey 2019 Switzerland 288 Denmark 278 Sweden 237 Luxembourg 203 Austria 196 Liechtenstein 171 USA 122 Germany 122 118 France Canada 83 0 50 www. fibl. org 100 150 200 250 Per capita consumption in euros 300 350
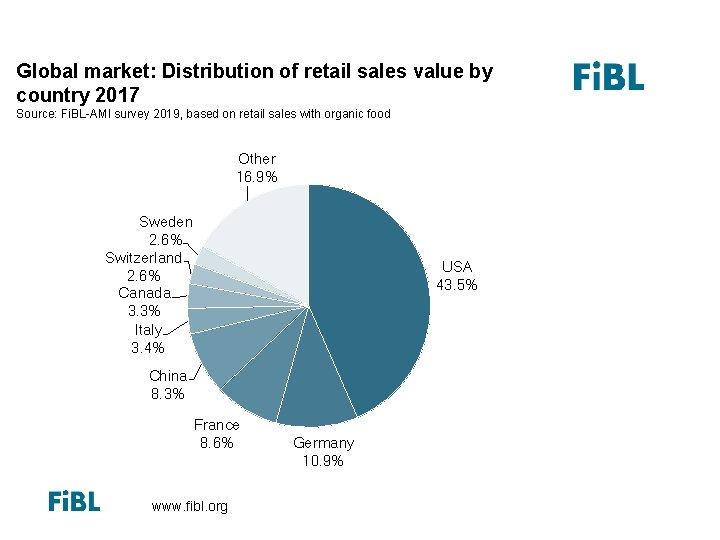
Global market: Distribution of total retail sales value by country (total: 56. 2 billion) Euros 2013 Global market: Distribution of retail sales value by country 2017 Source: Fi. BL-AMI survey 2019, based on retail sales with organic food Other 16. 9% Sweden 2. 6% Switzerland 2. 6% Canada 3. 3% Italy 3. 4% USA 43. 5% China 8. 3% France 8. 6% www. fibl. org Germany 10. 9%
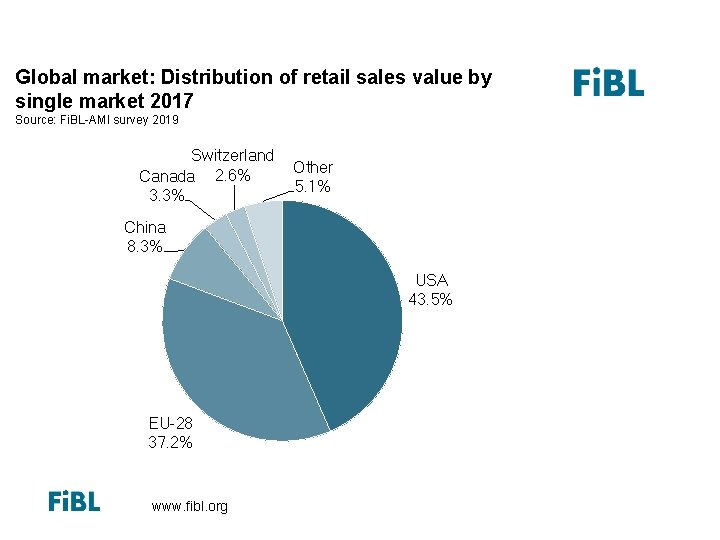
Global market: Distribution of total retail sales value by single markets (total: 47. 8 billion) Euros 2013 Global market: Distribution of retail sales value by single market 2017 Source: Fi. BL-AMI survey 2019 Switzerland Canada 2. 6% 3. 3% Other 5. 1% China 8. 3% USA 43. 5% EU-28 37. 2% www. fibl. org
www. fibl. org 19
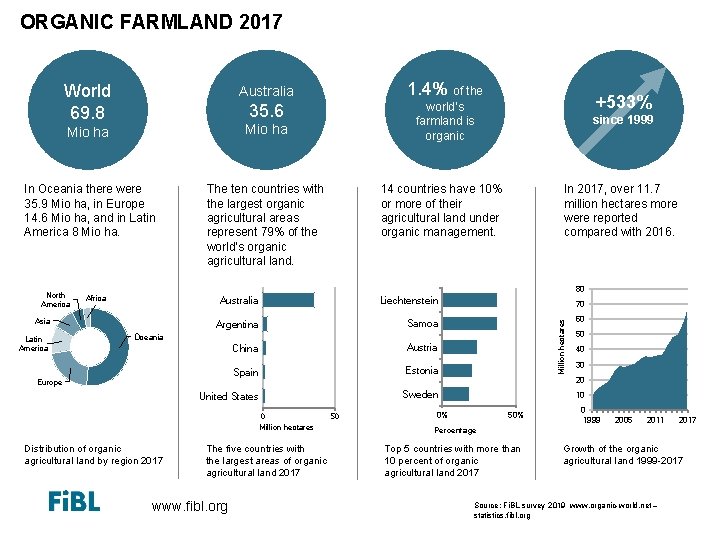
ORGANIC FARMLAND 2017 World 69. 8 Australia 1. 4% of the 35. 6 world’s farmland is organic since 1999 14 countries have 10% or more of their agricultural land under organic management. In 2017, over 11. 7 million hectares more were reported compared with 2016. Mio ha In Oceania there were 35. 9 Mio ha, in Europe 14. 6 Mio ha, and in Latin America 8 Mio ha. The ten countries with the largest organic agricultural areas represent 79% of the world’s organic agricultural land. 80 Africa Asia Latin America Australia Liechtenstein Argentina Samoa China Austria Spain Estonia United States Sweden Oceania Europe 0 Million hectares Distribution of organic agricultural land by region 2017 The five countries with the largest areas of organic agricultural land 2017 www. fibl. org 50 70 Million hectares North America +533% 60 50 40 30 20 10 0% 50% 0 1999 2005 2011 2017 Percentage Top 5 countries with more than 10 percent of organic agricultural land 2017 Growth of the organic agricultural land 1999 -2017 Source: Fi. BL survey 2019 www. organic-world. net – statistics. fibl. org
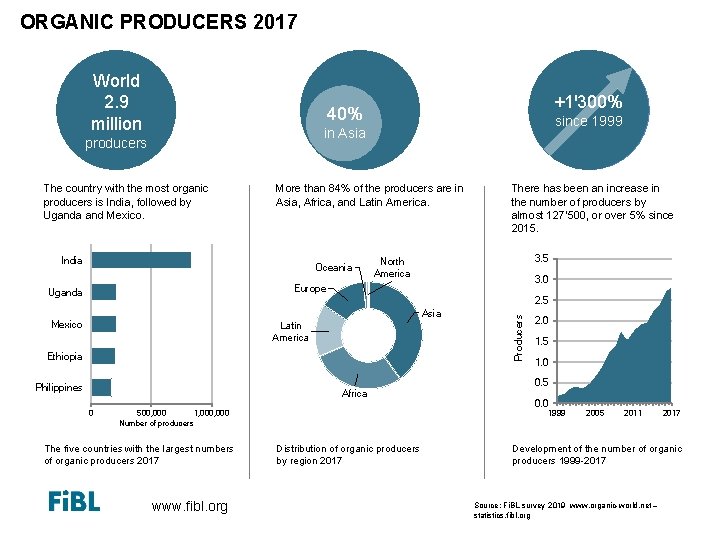
ORGANIC PRODUCERS 2017 World 2. 9 million +1ꞌ300% 40% since 1999 in Asia producers The country with the most organic producers is India, followed by Uganda and Mexico. More than 84% of the producers are in Asia, Africa, and Latin America. India Oceania There has been an increase in the number of producers by almost 127’ 500, or over 5% since 2015. 3. 5 North America 3. 0 Europe Uganda Asia Mexico Latin America Ethiopia Philippines Africa 0 www. fibl. org 2. 0 1. 5 1. 0 0. 5 0. 0 1999 500, 000 1, 000 Number of producers The five countries with the largest numbers of organic producers 2017 Producers 2. 5 Distribution of organic producers by region 2017 2005 2011 2017 Development of the number of organic producers 1999 -2017 Source: Fi. BL survey 2019 www. organic-world. net – statistics. fibl. org
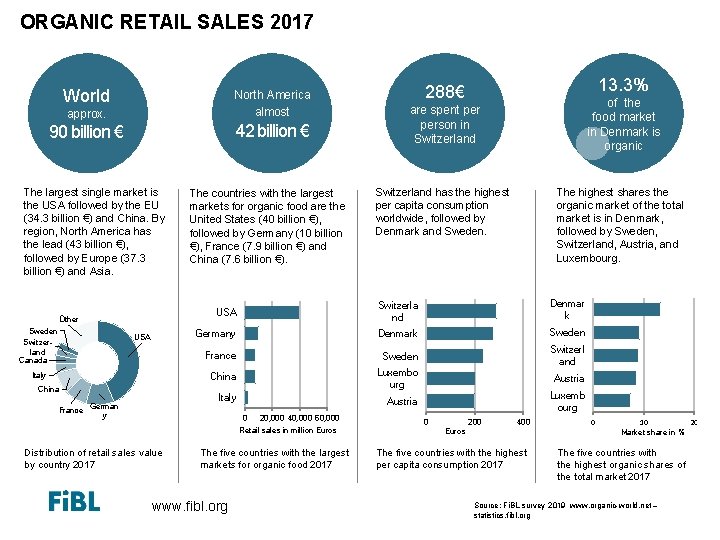
ORGANIC RETAIL SALES 2017 World approx. North America almost 90 billion € 42 billion € The largest single market is the USA followed by the EU (34. 3 billion €) and China. By region, North America has the lead (43 billion €), followed by Europe (37. 3 billion €) and Asia. Other Sweden Switzerland Canada USA Italy China German France y The countries with the largest markets for organic food are the United States (40 billion €), followed by Germany (10 billion €), France (7. 9 billion €) and China (7. 6 billion €). of the food market in Denmark is organic are spent person in Switzerland has the highest per capita consumption worldwide, followed by Denmark and Sweden. The highest shares the organic market of the total market is in Denmark, followed by Sweden, Switzerland, Austria, and Luxembourg. USA Switzerla nd Denmar k Germany Denmark Sweden France Sweden China Luxembo urg Switzerl and Italy Austria 0 20, 000 40, 000 60, 000 Retail sales in million Euros Distribution of retail sales value by country 2017 13. 3% 288€ The five countries with the largest markets for organic food 2017 www. fibl. org Austria Luxemb ourg 0 200 400 Euros The five countries with the highest per capita consumption 2017 0 10 20 Market share in % The five countries with the highest organic shares of the total market 2017 Source: Fi. BL survey 2019 www. organic-world. net – statistics. fibl. org
Acknowledgements • The Swiss State Secretariat of Economic Affairs SECO • International Trade Centre ITC • Coop Sustainability Fund • Nürnberg. Messe, the organizers of BIOFACH • IFOAM – Organics International • More than 200 experts from all parts of the world contributed to the Fi. BL survey 2019. www. fibl. org
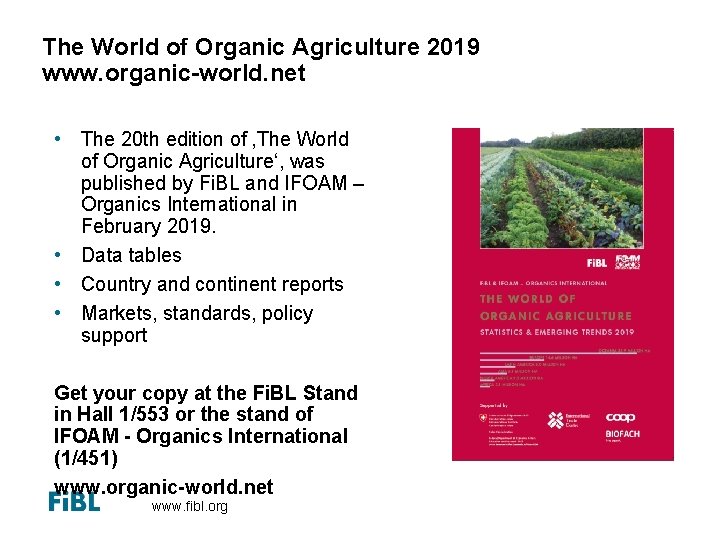
The World of Organic Agriculture 2019 www. organic-world. net • The 20 th edition of ‚The World of Organic Agriculture‘, was published by Fi. BL and IFOAM – Organics International in February 2019. • Data tables • Country and continent reports • Markets, standards, policy support Get your copy at the Fi. BL Stand in Hall 1/553 or the stand of IFOAM - Organics International (1/451) www. organic-world. net www. fibl. org
Contact Helga Willer and Julia Lernoud Research Institute of Organic Agriculture (Fi. BL) Ackerstrasse 113, 5070 Frick, Switzerland Tel. +41 79 218 0626, Fax +41 62 865 7273 helga. willer@fibl. org und julia. lernoud@fibl. org www. fibl. org, www. organic-world. net; www. fibl. stats. fibl. org Willer, Helga and Julia Lernoud (Eds. ) (2019): The World of Organic Agriculture. Statistics and Emerging Trends 2019. Fi. BL, Frick and IFOAM – Organics International, Bonn http: //www. organic-world. net/yearbook-2019. html www. fibl. org
- Slides: 25