RESEARCH IN PSYCHOLOGY BASIC VS APPLIED Basic Applied

RESEARCH IN PSYCHOLOGY

BASIC VS. APPLIED Basic Applied • Seeking knowledge for the sake of knowledge itself • “pure” research • Studying psychological issues in order to apply the findings to help solve problems • How do children and adults differ in addictive tendencies? • How can we predict addictive tendencies in adolescents to prevent adult addictions?

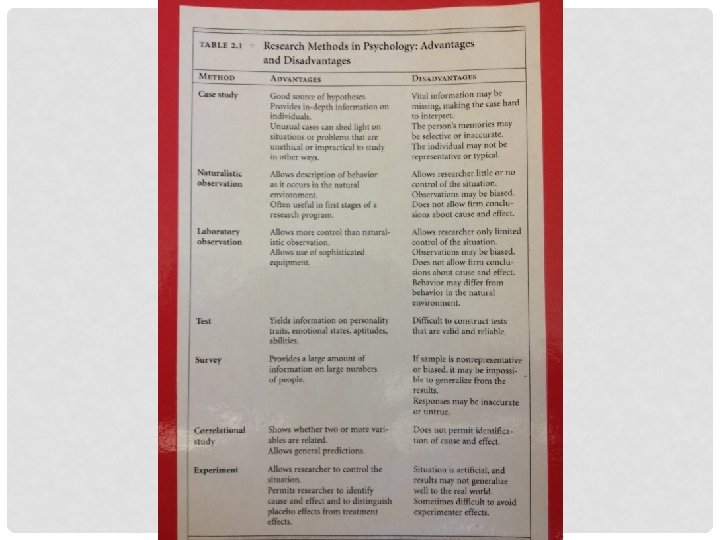
METHODS • Case Studies • Detailed description of a particular individual being studied/treated • Observational Studies • Naturalistic or lab created situations • Tests • Personality, aptitudes, interests, values, abilities, etc. • Surveys

Naturalistic Observation of human or animal behavior in the environment in which it typically occurs Jane Goodall’s study of chimpanzee culture

Naturalistic Observation • Valuable where other methods are likely to be disruptive or misleading • Problems with Naturalistic Observation – If people know they are being observed, they tend to act differently than they normally would • Ethically you usually must tell people you are observing them, yet can combat by observing for a long period of time – Observations can be distorted if observers expect to see certain behaviors • Why would this be a problem? How could it be solved?

Case Study Intensive examination of the behavior and mental processes associated with a specific person or situation http: //behavioralhealth. typepad. com

Case study • Are useful when something is new, complex or fairly rare – Often used in clinical work and neuropsychology • Limitations… – May contain evidence that a certain research thought to be important (why would this be a problem? ) – Are unlikely to be representative of people in general • Yet…provide valuable material for further research and serve as testing ground for new treatment, training programs & other applications of research

Survey A technique for ascertaining the self-reported attitudes, opinions or behaviors of people usually by questioning a representative, random sample of people. http: //www. lynnefeatherstone. org

Surveys • Validity of data depends upon: – How questions are worded – Representativeness of people surveyed (why? ) • Other limitations… – Willingness of people to honestly complete the survey – People may say what they believe they should say about an issue • Still a great way to gather LARGE amounts of information

CORRELATIONAL VS. EXPERIMENTAL Correlational Research Experimental Research • Study that looks at consistent relationship between two things that are already occurring • A study that tests a hypothesis using controls and manipulation of variables • Positive • Negative • Independent • Dependent

Correlation The measure of the relationship between two items or variables POSITIVE CORRELATION • Two variables increase together or decrease together NEGATIVE CORRELATION • Variables move in opposite directions • Example: The number of gallons of gas pumped is positively correlated to the amount spent on gas. • Example: Miles traveled is negatively correlated to the amount of gas left in your tank.

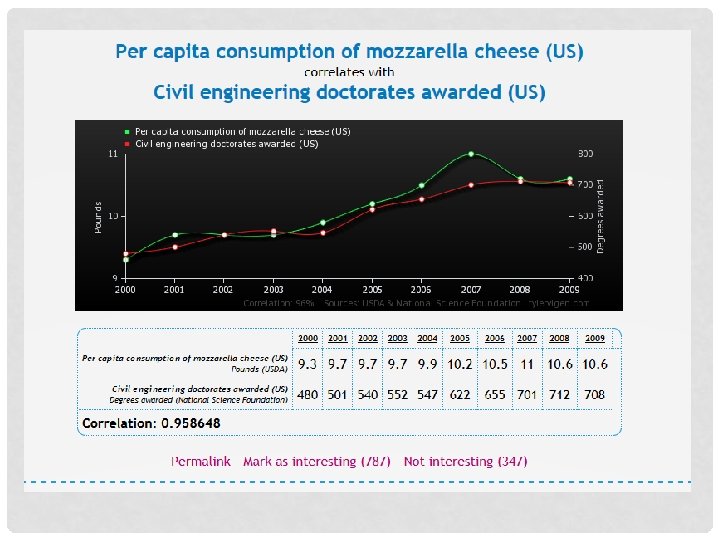
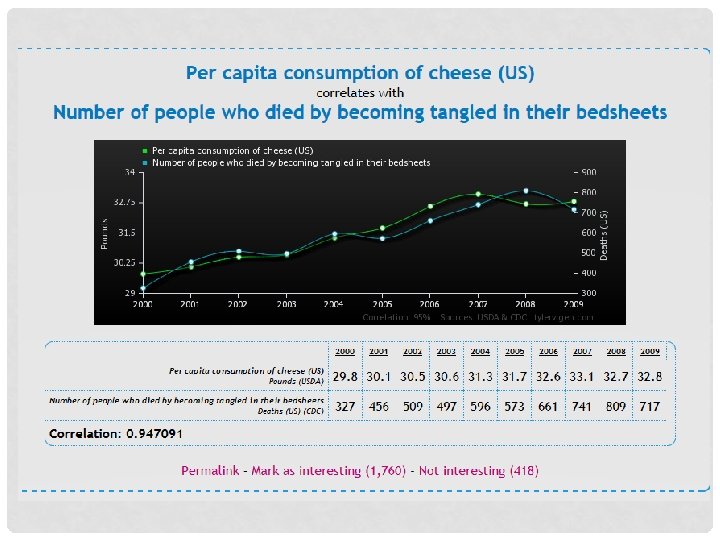
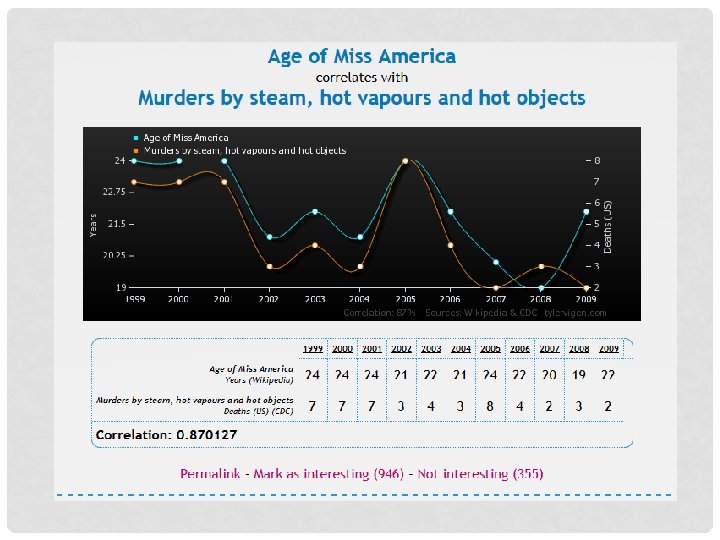
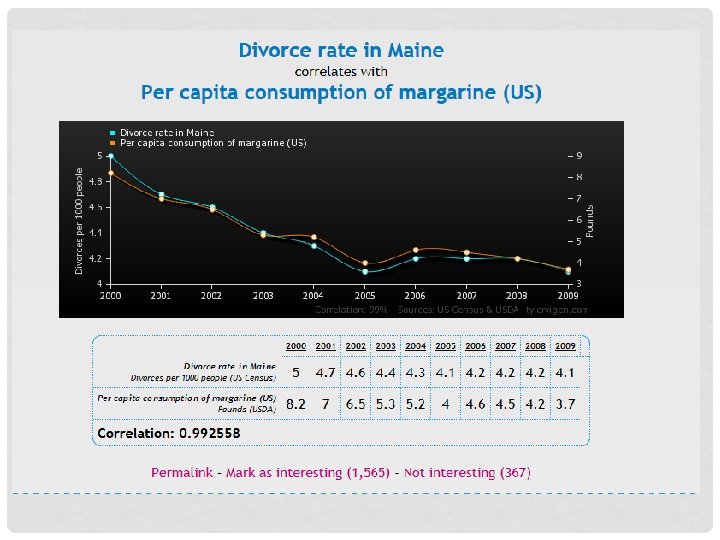
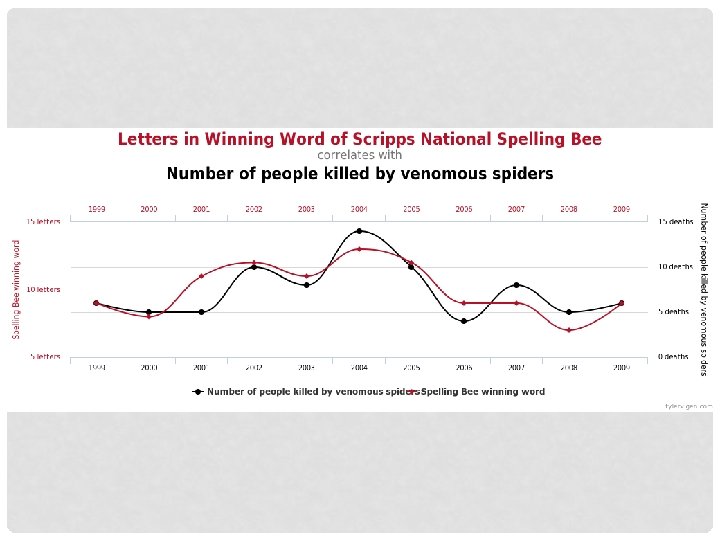
CORRELATIONS • A correlation expresses a relationship between two variables without ascribing cause • Variable = anything that can change or vary • COREELATION DOES NOT = CAUSATION!!!!!! spurious correlations ….

DIRECTIONAL RELATIONSHIPS Positive Correlation • The presence of one thing “predicts” the other • As one thing goes “up, ” so does the other • Examples? Negative Correlation • The presence of one thing “predicts” the absence of the other • As one thing goes “up, ” the other goes “down” • Examples?
 Perfect negative correlation (-1. 00) No relationship (0.")
Scatterplots Perfect positive correlation (+1. 00) Perfect negative correlation (-1. 00) No relationship (0. 00) Scatterplot is a graph comprised of points generated by values of two variables. The slope of points depicts the direction, and the amount of scatter the strength of relationship.

VISUALIZING A CORRELATION • Must be graphed using a scatter plot • The line of best fit, or regression line, is drawn through the middle in a way that minimizes its space from as many points as possible • The closer the points to the line, the more perfect the correlational relationship • (Coefficient closer to +1 or -1)

Correlation Coefficient Examples What kind of relationships do the following correlations have? • - 0. 78 moderately strong negative • + 0. 05 very weak positive • - 0. 43 moderately weak negative • + 0. 92 very strong positive

Another example…. Scatterplot showing relationship between height and temperament in people. What kind of relationship is depicted? Moderately positive… +. 63

Correlation Coefficient Statistical measure that shows the degree of relationship between two variables Correlation coefficient Number will always fall between -1. 0 and +1. 0 The higher the number the stronger the relationship Indicates strength of relationship (0. 00 to 1. 00) r = + 0. 37 Indicates direction of relationship (positive or negative)
![CORRELATION COEFFICIENT Represented by the letter r • • Ranges from [-1] to [+1]](http://slidetodoc.com/presentation_image_h2/f4ae174855257635a7b6fcbd29833ef6/image-25.jpg "CORRELATION COEFFICIENT Represented by the letter r • • Ranges from [-1] to [+1]")
CORRELATION COEFFICIENT Represented by the letter r • • Ranges from [-1] to [+1] -1 is a perfect Negative relationship +1 is a perfect Positive relationship 0 is the weakest relationship

EXPERIMENTAL METHOD - TERMS • Participants • Operational definitions – LEGOS activity • Independent variables • The thing you manipulate • Dependent variables • The thing affected by the ind. Var. • It “depends” on the ind. Var. • Confounding variables • Other factors (beside the ind. Var. ) that could effect the dependent variable • Participant-relevant – controlled by random assignment • Situation-relevant – controlled by equivalent environments

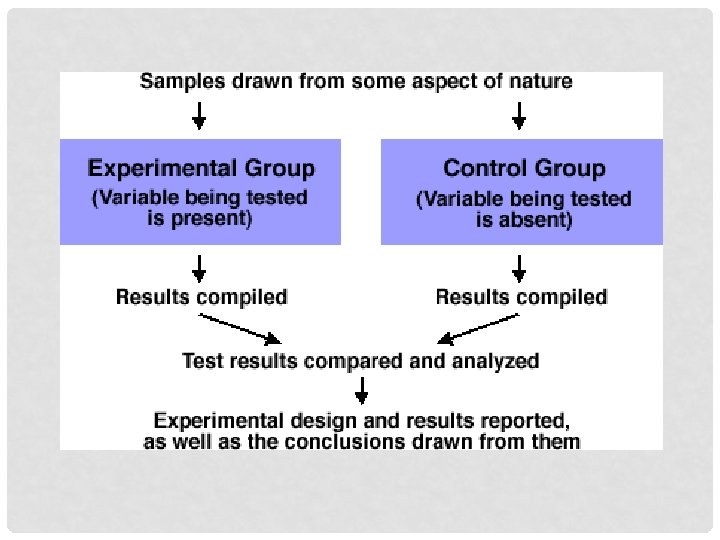
TERMS - CONTINUED • Experimental group • Group exposed to the independent variable that is manipulated…. exposed to the “treatment” • Control group • Group NOT exposed to treatment. Serves as a comparison to the experimental group • Valid • Does the study measure what you aim to measure? • Like…. Hand length a measure of intelligence • Reliable • If the study was done again, would you get the same results?

SAMPLING • Sampling • Process in which participants are selected for a study • Goal: • For the sample population to be representative of a larger population • Random selection vs. random assignment • Random Selection: every person in a population has an equal chance of being selected (best done by computer) • Random Assignment: Participants have equal chance of being put into experimental or control group

DOUBLE/SINGLE BLIND STUDIES • Single Blind Study • Participants don’t know if they are in the control group or the experimental group • Placebos can be used to prevent this when using medicine • Double Blind Study • Neither the participants or researchers know who is in which group • Participants usually coded some way • Researchers see results but don’t know which group participant was from • Helps prevent experimenter bias

“EFFECTS” AND BIASES • Biases • Observer bias – what experimenter expects to see, can change how s/he sees the behaviors being watched • More specifically – confirmation bias: tendency to notice only things that agree with your view or hypothesis • Order effects • Participants may get better at a repetitive task of an experiment because they are “practicing” with each trial • Participants may get worse at a repetitive task of an experiement because they get fatigued.
 • the clues in an experiment that lead")
DEMAND CHARACTERISTICS Demand Characteristics (Participant bias) • the clues in an experiment that lead the participants to think they know what the researcher is looking for (e. g. experimenter’s body language). • Hawthorne Effect • Participants beh. changes because they know they are being observed. Usually performance increases • Placebo Effect • The improvement of a patient or “cure” because of the perceived benefits of a treatment (even if the pill/injection/cream/etc. is fake. ) • Pygmalion Effect • The researchers’ expectations are unknowingly projected onto participants. The participants behave in a way that matches those expectations.

STUDY SUMMARY WORK • On your own, complete the study summary sheet with the study by Rosenthal. • Completing this is homework

PYGMALION EFFECT

DUE NEXT CLASS • Reading Guide 2 C • Correlation practice sheet • Next class: • statistics in psychological research • Vocab Quiz for Unit 2 -same format. Majority of Qs from “History/Approaches”

SMILING OPERATIONAL DEFINITION
- Slides: 36