Research in Psychology Agenda 1 Bell Ringer Which

Research in Psychology

Agenda 1. Bell Ringer: Which perspective would be utilized to study memory loss after a fall? Which perspective would examine religious beliefs and how they affect psychological thought? (10) 2. Lecture: Research Methods (20) 3. Handout 1 -11 and Discussion. (15) 4. Introspection Exercise(10) 5. Reading Quiz 1: Chapter 1 (10)

Objective n By the end of this lesson you will be able to identify the research methods of Psychology. n You will be able to define research terms.

n. Why do we need research?
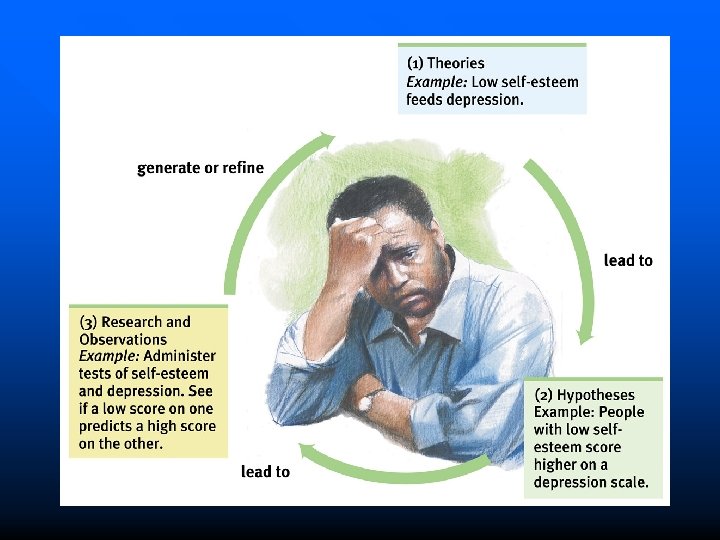

Intuition and Critical Thinking Human Intuition is highly limited. n Critically thinking rarely comes easily to us! – Critical Thinking: thinking that does not blindly accept arguments and conclusions » examines assumptions » discerns hidden values » evaluates evidence » An awareness to our own vulnerability n

Hindsight bias – “I knew it all along” phenomenon where after learning an outcome, one believes s/he could have predicted that very outcome n Overconfidence – we think we know more than we actually know n This is why we need psychological science. n

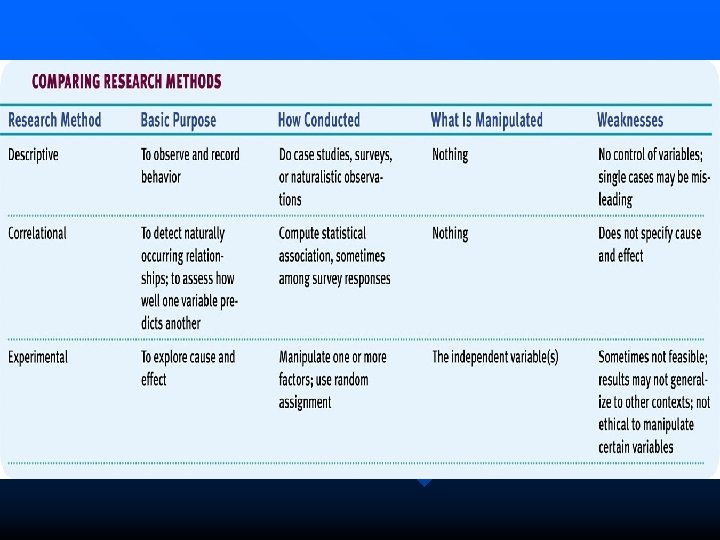
Natural Observation - Systematic study of behavior in a natural setting n Description: – Careful observation of humans or animals in real-life situations n Strength: – provides descriptions of behavior n Weakness: – DOES NOT explain how or why the behavior occurs – only describes it

Example: Jane Goodall’s research was naturalistic observation

Case Studies n Description: detailed information gathered over time on a specific individual n Strength: provides descriptive data over a period of time and analyzes new phenomena n Weakness: emotional attachment or personal prejudice to subject can effect objectivity

Example: n Studying patients with gunshot wounds to the head over a period of years to see how injuries changed their behavior.

Survey Description: a technique for gathering the selfreported attitudes, opinions, or behaviors of people

Strengths: 1. easy administration, scoring, and statistical analysis. n Weaknesses: 1. people lie or are opinionated 2. groups should be representative or data is skewed 3. wording of question can sway answers n n Example: – Survey students about their opinions on homework

Sampling when doing studies: n Representative samples are necessary because you can’t survey everyone in a given population. n Thus you create a random sample that fairly represents a population. (Every person in a group has an equal chance to participate)

n Ex. You want to survey the school about attitudes on HW. By using a students list where everyone is numbered, you pick as many as possible to participate. n The bigger the sample the better – as long as it is representative.

M&M Activity No, you may not eat your candy. This is an experiment.

n All the packages together make up the population from which we are getting the ______________, representative sample which is each individual package. n Each student who selected a pack of M&M’s have selected a ________. random sample n Separate the colors on the desk.

You should have according the Mars company, 30% brown n 20% red n 20% yellow n 10% green n 10% orange n with a total of 24 M&M’s in a pack. n

Correlational Method n Description: Used to look at relationships between two variables. n Strengths: The stronger the correlation the more successfully one variable can be predicted from the other n Weaknesses: Does not est. cause and effect. Often a 3 rd (an intervening variable) involved

Example n There is a positive correlation showing that people who go to college will have higher incomes. n an increase in one variable tends to be associated with an increase in the other

Example 2 n If an increase in one variable tends to be associated with a decrease in the other then this is known as a negative correlation n There is a negative correlation showing that the more education a person has the LESS likely the are to be racist

Correlation and Causation

Scatterplot n A graph comprised of points that are generated by values of two variables. n The slope of the points depict the direction, while the amount of scatter depicts the strength of the relationship. n Correlational coefficient: a statistical measure of the degree of relatedness or association between two sets of data that ranges from -1 to 1.

Perfect positive correlation Perfect negative correlation No relationship

What is the relationship between height and temperament shown in the scatterplot below? n It shows a moderate positive correlation. +0. 63

Experimental Method Description: researcher manipulates a variable under controlled conditions and observes a response n Strengths: Can establish cause and effect relationships. Experiments should be able to be replicated in order to be found valid and reliable. n Weakness: Because it is done under controlled conditions hard to apply to real world situation n

Other types of studies n Longitudinal study – study one person or event over a long period of time n Ex-post facto study – study something after it happened naturally – look at effect – seek cause

Statistics n Measures of central tendency – typical scores – Mean – average of scores – Median: middle score in a rank distribution – Mode: most frequent score

n n Statistical procedures analyze and interpret data allowing us to see what the unaided eye misses. Researchers are looking for statistical significance

Measures of Variation Range – difference between the highest and lowest scores in a distribution n Standard deviation – a computed measure of how much scores vary around the mean (BELL CURVE) n

A skewed distribution

Closure

Directions: For each of the following hypotheses, explain which research method would be best and why that method is best. If a cancer patient receives chemotherapy, then they will live longer than a cancer patient who does not. n Do people think coffee helps performance at work? n How does playing a high school sport effect amount of friends you have? n If there are no cars around, then most people do not completely stop at a stop sign n

n If students study more, then they will do better on tests. n What percentage of students actually use the bathroom when they ask to go to the bathroom? n Students behave differently around teachers. n How does laser eye surgery effect vision later in life?
- Slides: 35