Research Hypotheses Statement in words as to what

. Students")


- Slides: 31
Research Hypotheses. • Statement in words as to what the investigator expects to find. • Example. Students who drink caffeine will be able to memorise information faster than students who do not drink caffeine.
Logical Hypotheses �Stated in terms of null & alternate hypotheses. �Null Hypothesis (Ho). Students who drink caffeine will be not be able to memorise information faster than students who do not drink caffeine. �Alternative Hypothesis (Ha). Students who drink caffeine will be able to memorise information faster than students who do not drink caffeine.
Statistical Hypotheses �Statement in statistical terms as to what would be found if the research hypothesis is true. �A sales manager has asked her salespeople to observe a limit on travelling expenses. The manager hope to keep expenses to an average of $ 100 per salesman per day. What will be H 0 and Ha?
Steps in Hypotheses Testing 1. Formulation of the null and alternate hypothesis 2. Definition of a test statistic 3. Determination of the distribution of the test statistic 4. Definition of critical region of the test statistic 5. Testing whether the calculated value of the test statistic falls within the acceptance region.
1: Formulation of H 0 • The Null hypothesis assumes a certain specific value for the unknown population parameter. • Defined as an inequality – greater than or less than. • For example, if the mean of a population is considered, then • H 0: μ ≤ μ 0 • H 0: μ = μ 0 • H 0: μ ≥ μ 0
2: Formulation of Ha • The alternate hypothesis assigns the values to the population parameter that is not contained in the null hypothesis. • For example, • Ha: μ > μ 0 • Ha: μ ≠ μ 0 • Ha: μ < μ 0 • The null hypothesis is accepted or rejected on the basis of the information provided by the sample.
Select the Suitable Test of significance or Test Statistic • Whether the test involves one sample, two samples, or samples? • Whether two or more samples used are independent or related? • Is the measurement scale nominal, ordinal, interval, or ratio?
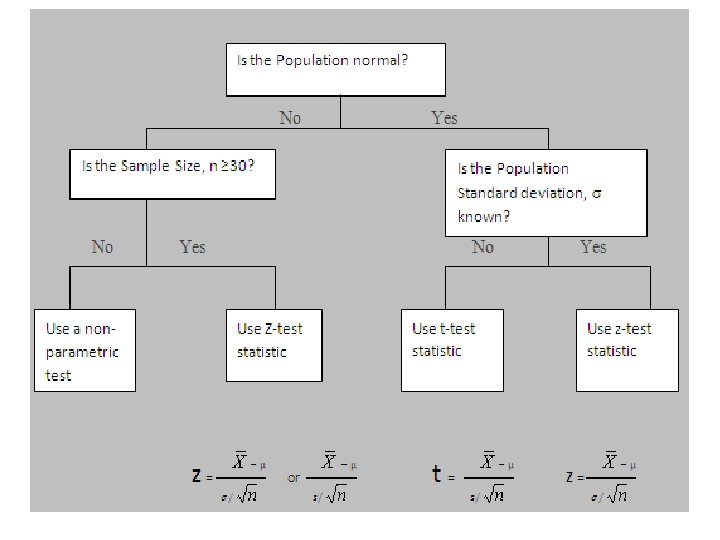
The choice of a probability distribution of a sample statistics is guided but the sample size n and the value of population standard deviation as shown in the table.
3: Definition of a Test Statistic • A test statistic must be defined to test the validity of the hypothesis. • The test statistic is computed from sample information. • A number calculated to represent the match between a set of data and the expectation under the null hypothesis A test that uses the z-score as a test statistic is called a z-test.
4: Determination of the distribution of the test statistic • The probability distribution of the test statistic depends on the null hypothesis assumed, the parameter to be tested, and the sample size. Commonly used ones are the Normal, Student’s “t”, Chi-square and F-distributions.
5: Definition of the critical region for the test statistic • The set of values of the test statistic that leads to the rejection of H 0 in favour of Ha is called the rejection region or critical region. • Depends upon whether the testing is onesided or two-sided.
6: Decision rule • A decision rule is used to accept or reject the null hypothesis. • P- value P<α Reject the null hypothesis Statistically significant • Test statistic (calculated value) < Table value of α Accept H 0 Statistically insignificant
7: Outcome • The acceptance or rejection of the hypothesis will lead to the following possible outcomes: • • To accept H 0 when H 0 is true- Correct decision To reject H 0 when H 0 is false- Correct decision To reject H 0 when H 0 is true- Type I error To accept H 0 when H 0 is false- Type II error
8: Error probabilities • The inferences made on the basis of the sample information would always have some degree of error. α = Type I error = Rejecting H 0 when H 0 is true β = Type II error = Accepting H 0 when H 0 is false • Rejecting a null hypothesis (Type I error) is more serious than accepting it when it is false. Therefore, the error probability α is referred to as the significance level.
Parametric & Non Parametric Testsp • Parametric Test • Statistical procedures that use interval or ratio scaled data and assume populations or sampling distributions with normal distributions. • Non Parametric Test • Statistical procedures that use nominal or ordinal scaled data and make no assumptions about the distribution of the population.
Parametric Tests • • z-test t-test F-test Chi square test
Conditions for using Tests Population standard deviation known deviation unknown N larger than 30 z- Test N smaller than 30 z- Test t-Test
t-Test • • • Used when sample size is ≤ 30. Given by W. S. Gosset (pen name Student) Also called Student’s t distribution. Based on t distribution. The relevant test statistic is t.
t-Test • Conditions • Sample should be small. • Population standard deviation must be unknown. • Assumption • Normal or approximately normal population.
t Distribution �Characteristics �Flatter than normal distribution. �Lower at mean, higher at tails than normal distribution. �As degrees of freedom increase, t-distribution approaches the standard normal distribution (df=8 or more) �Degrees of Freedom: No. of observations minus the no. of constraints or assumptions needed to calculate a statistical term.
t-Test • Confidence Interval Degrees of Freedom: n-1
t-Test • The specimen of copper wires drawn from a large lot to have the following breaking strength (in Kg weight) 578, 572, 570, 568, 572, 578, 570, 572, 596, 544 • Test whether the mean breaking strength of the lot may be taken to be 578 kg, at 5% significance level.
t-Test • Given a sample mean of 83, a sample standard deviation of 12. 5, & a sample size of 22, test the hypothesis that the value of population mean is 70 against the alternative that is more than 70. Use 0. 05 significance level.
z -Test • Based on the normal distribution. • Mostly used for judging the significance level of mean. • The relevant test statistic is z. • The value of z is calculated & compared with its probable value. • If calculated value is less than table value- accept H 0
z -Test • The mean of a certain production process is known to be 50 with a standard deviation of 2. 5. The production manager may welcome any change in mean value towards higher side but would like to safeguard against decreasing values of mean. He takes a sample of 12 items that gives a mean value of 48. 5. What inference should the manager take for the production process on the basis of sample results? Use 5% significance value.
z -Test • A sample of 400 male students is found to have a mean height 67. 47 inches. Can it be reasonably regarded as a sample from a large population with mean height 67. 39 inches & standard deviation 1. 30 inches? Test at 5% level of significance.
z -Test • Hinton press hypothesizes that the average life of its largest web press is 14, 500 hours. They know that the standard deviation of press life is 2100 hours. From a sample of 36 presses , the company finds a sample mean of 13, 000 hours. At a 0. 01 significance level, should the company conclude that the average life of the presses is less than the hypothesized 14, 500 hours?
F-Test • Based on F-Distribution • Used to compare variance of 2 independent samples. • Relevant Test statistic is F. • Larger the F value, greater the possibility of having statistically significant results.
F-Test • Characteristics • Family of distributions. • Has 2 degrees of freedom.
F-Test • Two random samples drawn from two normal populations are Sample 1 20 16 26 27 23 22 18 24 25 19 Sample 2 27 33 42 35 32 34 38 28 41 43 30 37 • Test using variance ratio of 5% and 1% level of significance whether the two populations have the same variance.