Research Findings on Environmental Impacts of Sustainable Shale

Research Findings on Environmental Impacts of Sustainable Shale Gas Development in Pennsylvania The Center for Energy Economics and Policy Alan Krupnick, Ph. D Director, Center for Energy Economics and Policy Widener University School of Law September 27, 2013

Risk Matrix 2

Sloan Project on Environmental Risks 1. Expert survey of shale gas development risks Risk Matrix 2. Statistical analysis: a) Effects of shale gas activity on surface water quality in Pennsylvania b) Analysis of chemical assays of flowback/produced water c) Property Value effects 3. State-by-state regulatory analysis 4. Public Survey 5. Summary 3
: Most national")
Surveying the Experts: Who & What? 215 experts: • • NGOs (35): Most national environmental groups, some local Academics (63): Universities/think tanks Government (42): Federal agencies; about half the relevant states; river basin commissions Industry (75): Operating and support companies, trade associations, consulting firms, law firms Chose high priorities among 264 possible risks

Overlap of each groups’ high priority routine risk pathways

Consensus routine risk pathways

7
 from")
RFF project focuses on environmental risks Surface Water Quality Risk Study (PNAS, 2013) from shale gas development We exploit spatial and temporal variation in the proximity of shale gas wells, waste treatment facilities, and surface water quality monitors in Pennsylvania to estimate: 1. the impact of shale gas wells on downstream chloride and TSS concentrations; and 2. the impact of shale gas waste treatment and release to surface water on downstream chloride and TSS concentrations. 8

9

RFF project focuses on environmental risks Conclusions from shale gas development • No statistically significant impact of shale gas wells on downstream chloride concentrations. • A positive result here would have been consistent with contamination problems from spills, dumping, etc. • Release of treated shale gas waste to surface water by permitted waste facilities appears to increase downstream chloride concentrations. • Effect is significant only for POTWs, not CWTs. • Shale gas wells appear to increase downstream TSS concentrations. 10

Public Survey Public concerns for shale gas development well known, but no information currently available on • Risk valuation • Risk preference tradeoffs We survey public in Texas and Pennsylvania to elicit attitudes and (monetary) preferences for five key risk attributes: • Groundwater wells with problems • Surface water bodies with problems • Violations of air quality standards • Time lost to congestion • Percent habitat fragmented Three different information treatments 11
")
Degree of concern about the environmental consequences of shale gas development (1=none, 7=extreme concern) 30% 26% 25% 20% 15%15% 12% 11% 10% 13% 11%11% 13%12% 10% 9% 8% 8% 7% 5% 0% 1 2 3 4 PA 5 TX 6 7 No opinion 12
 25% 21%")
Degree of support of shale gas development (1=not at all, 7=extremely supportive) 25% 21% 20% 19% 20% 18% 17% 15% 12% 11% 10% 9% 7% 7% 6% 5% 4% 4% 0% 1 2 3 4 PA 5 6 7 No opinion TX 13
 WTP Estimates (mean, 90% CI), Controlling for Information Treatment and Baseline 45")
Primary (conservative) WTP Estimates (mean, 90% CI), Controlling for Information Treatment and Baseline 45 40 35 29, 9 30 25 21, 8 20, 1 20 15 10 5 11, 1 9, 1 6, 5 3, 6 3, 9 3, 4 0, 3 0 Groundwater (1, 000 Surface Water (% Air Quality (days of Local Community (% Wildlife Habitat (% wells w/ problems) water bodies w/ standard violation) time loss) habitat fragmented) problems) PA WTP TX WTP 14

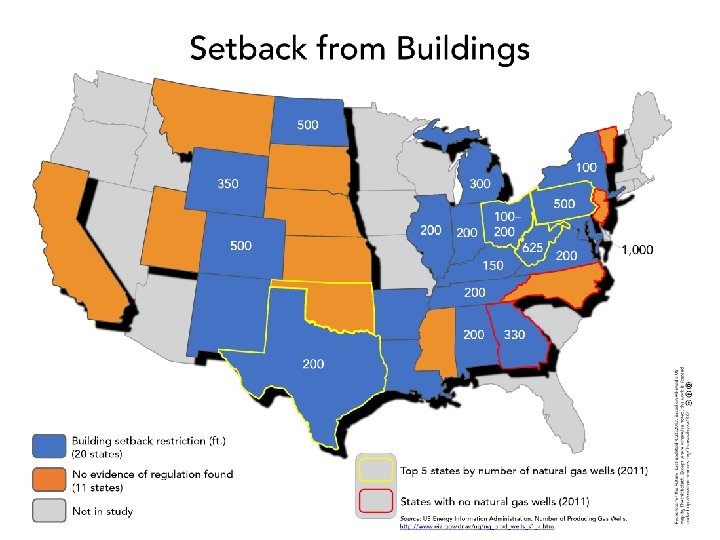
Top 5 states by number of gas wells 44% 42% 40% Wyoming Montana Mississippi Illinois Utah 25% Indiana Virginia 13% 22% 25% Kentucky Tennessee 28% California 31% 45% Arkansas South Dakota 46% Ohio 51% Oklahoma 46% 51% Michigan New Mexico 52% Texas 47% 54% Alabama North Dakota 54% 57% Louisiana Kansas 57% Pennsylvania 0% 59% 10% Colorado 20% 60% 30% West Virginia 40% 60% 50% New York 60% 61% 70% Nebraska 74% 80% Maryland Stringency of Quantitatively Regulated and Unregulated Elements 100% 90%

Truck Traffic Accidents in Pennsylvania by Well Activity 16

Thank you 17

Changes in attitudes post-information treatment 18

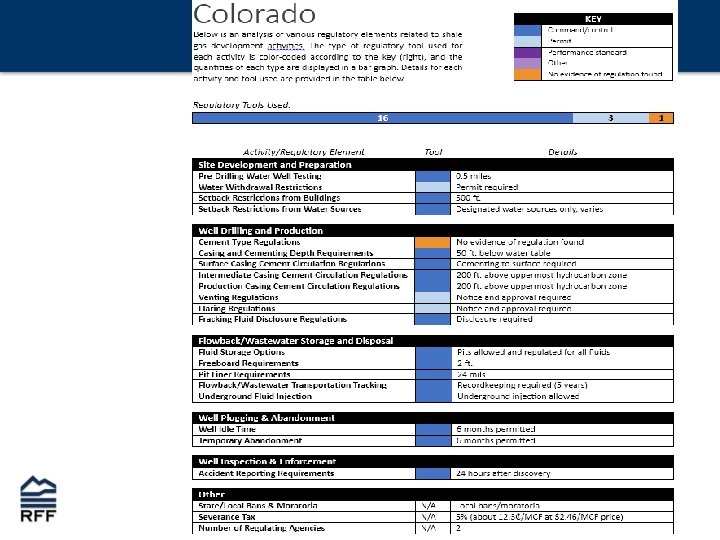
State-by-state regulatory analysis • 31 states • 27 regulatory elements across shale development process • Sources of data: statutes, regulations, independent reports, and interviews with regulators 19

Fracking Fluid Disclosure 20

21

22

Some Findings • Heterogeneity is the rule. • States average regulating about 70% of our elements (18 -95%) • Mostly command control • Of these, numerical standards range from 9% to 75% of maximum stringency • Lack of transparency and data availability 23

Non-consensus top government concerns • White area: All groundwater effects, including from pit or pond storage of fracturing fluids, DWI, saline intrusion from drilling. • Other for states: The above effects on surface water, drilling fluids and cuttings to both surface and groundwater; frack fluids hydraulic fracture propagation to groundwater • Noticeably lower state priorities: community and habitat effects and air pollutants 24

Top 5 states by number of gas wells Virginia 10 California 12 Tennessee 13 13 South Dakota Utah 14 14 14 Mississippi Montana 14 Kentucky 15 15 15 Indiana North Dakota Illinois 16 16 15, 6 Arkansas Natl. Average 16 Maryland 17 17 Nebraska Wyoming Texas Oklahoma Ohio Louisiana Kansas 18 18 Alabama 18 New Mexico 19 19 Michigan Pennsylvania 20 20 Colorado West Virginia 20 New York Elements Regulated 12 12 10 10 8 6 4 2 0
 Panel Two waves February–May 2013 1, 624 completed")
Survey Facts Knowledge Networks (Gf. K) Panel Two waves February–May 2013 1, 624 completed responses • 3 information treatments (neutral, industry, NGO) • 3 baselines (high, medium, low risks) • 2 states (PA and TX) Drop off those who took less than 10 minutes to complete Final data 1490 respondents 27
 II. Brief")
Survey Organization I. Motivation (PA/TX considering different government programs, need your input) II. Brief intro to shale gas development in PA/TX III. Elicit attitudes towards risks IV. Information treatment (randomized) V. Choice questions (five) VI. Elicit attitudes towards risks (repeat) VII. Debriefing 28

Information Treatments: “Shale Gas: What Everyone Should Know” Different treatments similar in • length (about ten short paragraphs, one for each topic) • topics covered (overall economic potential, environmental risks, efforts to manage them) Industry Information • • • American Petroleum Institute “Ten Facts about Shale Gas” Technical focus, emphasizes economic potential Assures risks not large, industry goes beyond what is required to address risks NGO Information • • • Extracted from NGO websites, press releases, and so forth Highlights risks, downplays economic potential Mixes scare tactics, anecdotes, facts, problem cases • • “Rational Middle, ” balanced view Factual, evidence based, notes expert agreement and disagreement Recognizes risks, highlights potential methods to reduce them “Kind of boring” & “Not telling me how to think” (focus group participants) Neutral Focus groups correctly identified the different treatments 29
 $120 per year ($10 per month)")
10, 000 $60 per year ($5 per month) $120 per year ($10 per month) 30

Stylized Examples of Information Treatments: Overall Prospects of Shale Gas Development Industry NGO Neutral Hydraulic fracturing will account for nearly 70 percent of natural gas development in the future… development applies the latest technologies and makes it commercially viable … Without it, we would lose 45 percent of domestic natural gas production and 17 percent of our oil production within 5 years. Shale gas supplies are overestimated, and it is not as cheap as it has been touted to be. The big reason is that shale gas wells, unlike oil wells, peter out quickly… the viability of shale gas as a solution to America’s high energy consumption level is only on an interim basis. Shale gas is more likely to be a stopgap, a 25 year solution rather than a 100 year one. According to the US Energy Information Agency, discovered and technically recoverable shale gas resources in the United States contain enough natural gas to satisfy over 100 years of demand in the entire country. Some question these estimates and claim actually recoverable shale gas supplies to be less. Regardless, shale gas resources are massive.
 32")
Risk concerns and mean votes for SQ (total five votes) 32
, by Information Treatment (unpooled estimation) $ year-1")
WTP for Risk Reductions (mean, 90% CI), by Information Treatment (unpooled estimation) $ year-1 100 90 80 70 60 50 40 30 20 10 0 Groundwater (1, 000 wells Surface Water (% water w/ problems) bodies w/ problems) PA Neutral PA Industry Air Quality (days of standard violation) PA NGO TX Neutral Local Community (% time Wildlife loss) f TX Industry TX NGO 33
, by State and Baseline (unpooled estimation) 200")
WTP for Risk Reductions (mean, 90% CI), by State and Baseline (unpooled estimation) 200 180 160 140 120 100 80 60 40 20 0 Groundwater (1, 000 wells w/ problems) PA Baseline High Surface Water (% water bodies w/ problems) PA Baseline Medium Air Quality (days of standard violation) PA Baseline Low Local Community (% time loss) TX Baseline High TX Baseline Medium Wildlife Habitat (% h fragmented) TX Baseline Low 34

Discussion Public is supportive of shale gas but concerned about environmental risks • • • Groundwater a major concern in both states Surface water a big concern in TX, less so in PA Wildlife habitat a big concern in PA, not at all in TX Air quality a relatively small yet statistically significant concern Community impacts not a major concern in either state, on average Considerable heterogeneity; key area for future work Preferences are polarized, more than 1/3 not WTP 35

Discussion WTP fairly robust to information & baseline, some evidence that • • • “neutral” information moderates WTP, non-neutral increases it lower risk baseline raises WTP per unit neutral information and high baseline conservatively estimate WTP Information effects deserve closer attention, still relatively poorly understood in valuation 36

Regulatory Tools Used 20 1 3 18 1 1 1 2 2 3 3 3 3 1 1 16 2 3 4 1 1 2 2 2 4 1 1 5 5 5 6 6 6 7 7 1 3 14 1 1 5 12 10 4 10 10 3 2 4 1 1 2 3 18 16 8 14 14 14 15 15 13 6 14 15 8 1 3 19 8 4 1 1 1 3 14 14 13 11 10 12 11 10 9 4 8 9 8 6 2 Command/control Case-by-case permit Performance standard Other No evidence of regulation found Virginia California Tennessee South Dakota Utah Mississippi Montana Kentucky Indiana North Dakota Illinois Arkansas Nebraska Maryland Wyoming Texas Oklahoma Ohio Louisiana Kansas Alabama New Mexico Michigan Pennsylvania Colorado West Virginia New York 0

30% 20% 19% 50% 40% 10% 0% Top 5 states by number of gas wells 52% 51% 49% Wyoming Ohio Oklahoma Virginia 33% 38% Indiana Kentucky 39% Tennessee 44% 52% West Virginia Illinois 54% 58% Pennsylvania Colorado 60% Arkansas 54% 61% New Mexico Michigan 63% California 54% 64% Alabama New York 64% Louisiana 70% Mississippi 66% 72% Kansas North Dakota 72% South Dakota 76% 60% Nebraska 70% 77% 80% Utah 80% 90% Texas Maryland 90% 96% 100% Montana Stringency of Quantitatively Regulated Elements

Treatment Effects Using Pooled Data. Estimated benchmarking to high baseline and neutral information as beta= (1+beta_treatment)*beta_pooled Pennsylvania Mean p-value Texas Mean p-value Industry Information (n=477) Status Quo 2. 38 0. 357 9. 15 0. 806 Environmental Attributes 1. 23 0. 057 0. 69 0. 144 Status Quo -0. 49 0. 557 9. 99 0. 802 Environmental Attributes 0. 39 0. 372 0. 130 Status Quo 0. 76 0. 545 -0. 42 0. 131 Environmental Attributes 0. 47 0. 210 0. 40 0. 136 Status Quo 1. 05 0. 451 -0. 75 0. 004 Environmental Attributes 0. 56 0. 124 -0. 44 40 0. 005 NGO Information (n=513) Medium Baseline (n=426) Low Baseline (n=445)
, by State, Pooled Data, No Controls for")
WTP for Risk Reductions (mean, 90% CI), by State, Pooled Data, No Controls for Baseline or Information $ year-1 50 45 40 35 30 25 20 15 10 5 0 Groundwater (1, 000 wells w/ problems) Surface Water (% Air Quality (days of Local Community Wildlife Habitat (% water bodies w/ standard violation) (% time loss) habitat PA WTP TX WTP 41 problems) fragmented)

Alternative Baselines: Environmental Risks in Status Quo High Medium Low 10, 000 5, 000 2, 500 10% 5% 2. 5% 30 15 8 Wildlife Habitat (percentage fragmented) 10% 5% 2. 5% Community Effects (time loss) 10% 5% 2. 5% Ground water (drinking wells with problems) Surface water (surface water bodies with problems) Air quality (days of air quality violations) 42

Hypotheses to be Tested First • PA SQ WTP less than TX; hopefully insignificant from zero. • PA community WTP>TX • TX surface and groundwater WTP > PA • Groundwater concerns most valuable • WTP (API) less than WTP (RFF) less than WTP (NGO) • Attribute WTP (High) greater than Attribute WTP (medium, low) 43

Standard Deviation of the WTP Distribution, by Information Treatment, Unpooled Data 200 180 160 140 120 100 80 60 40 20 0 Groundwater (1, 000 wells w/ problems) Surface Water (% water bodies w/ problems) PA Neutral PA Industry Air Quality (days of standard violation) PA NGO TX Neutral Local Community (% time loss) TX Industry Wildlife Habitat (% habitat fragmented) TX NGO 44

Public Survey • Sample Texas and Pennsylvania • Willingness to pay for reducing various types of shale gas risks • Three alternative information “treatments” describing risks: • API’s • NGO composite • RFF’s 45

46

Discrete Choice Econometric Modeling Random parameter multinomial logit model Estimation in WTP space (Train and Sonnier 2005) First, pooled results without information treatment and baseline controls Second, split sample results by information treatment and baseline sub-samples Third, pooled estimation to test and control for information treatment and baseline effects 47

Industry NGO Neutral Ground water Each well contains multiple layers of steel casing and cementing to effectively protect groundwater … NAS study found average methane concentrations in shallow drinking water wells 17 times higher than those in non-active areas, possibly due to leaky gas-well casings … Some evidence of drinking water well contamination linked to shale gas development. Scientists say that it is unlikely that the fracking fluids will migrate up to the surface or to groundwater … Surface Water Numerous protective measures are in place at well sites … to control and direct any potential runoff at the site. Even if the wastewater does not seep directly into the soil, a heavy rain cause a pit to overflow and create contaminated runoff … infrequent reports of localized ecosystem disruption from spills. To minimize risks, operators could focus on stopping leaks and spills … states could do more monitoring… Air Quality Industry has made considerable strides in reducing emissions through voluntary measures … working with EPA to define performance standards that will give rise to additional Sublette County, a rural Wyoming community with a high concentration of gas wells, has recorded higher ozone levels than those in Los Angeles To minimize risks, states could impose more controls on emissions and/or industry could increase efforts to reduce such emissions

Relationship between risk attitudes and number of status quo votes 4 3, 5 Mean Status Quo Votes 3 2, 5 2 Complete sample "Yes" Dropped 1, 5 Did you answer SQ because you thought industry should pay? 1 0, 5 0 1 1<…<2 2 2<…<3 3 3<…<4 4 4<…<5 Average Risk Attitude 5 5<…<6 6 6<…<7 7 49

Treatment Effects Using Pooled Data. Estimated benchmarking to high baseline and neutral information as beta= (1+beta_treatment)*beta_pooled Pennsylvania Mean p-value Texas Mean p-value Industry Information (n=477) Status Quo 2. 38 0. 357 9. 15 0. 806 Environmental Attributes 1. 23 0. 057 0. 69 0. 144 Status Quo -0. 49 0. 557 9. 99 0. 802 Environmental Attributes 0. 39 0. 372 0. 130 Status Quo 0. 76 0. 545 -0. 42 0. 131 Environmental Attributes 0. 47 0. 210 0. 40 0. 136 Status Quo 1. 05 0. 451 -0. 75 0. 004 Environmental Attributes 0. 56 0. 124 -0. 44 50 0. 005 NGO Information (n=513) Medium Baseline (n=426) Low Baseline (n=445)

Treatment Effects Using Pooled Data. Estimated benchmarking to high baseline and neutral information as beta= (1+beta_treatment)*beta_pooled Pennsylvania Mean p-value Texas Mean p-value Industry Information (n=477) Status Quo 2. 38 0. 357 9. 15 0. 806 Environmental Attributes 1. 23 0. 057 0. 69 0. 144 Status Quo -0. 49 0. 557 9. 99 0. 802 Environmental Attributes 0. 39 0. 372 0. 130 Status Quo 0. 76 0. 545 -0. 42 0. 131 Environmental Attributes 0. 47 0. 210 0. 40 0. 136 Status Quo 1. 05 0. 451 -0. 75 0. 004 Environmental Attributes 0. 56 0. 124 -0. 44 51 0. 005 NGO Information (n=513) Medium Baseline (n=426) Low Baseline (n=445)

WTP Estimates from Pooled Data, Controls for Baseline and Information, Reference Point High Baseline and Neutral Information Pennsylvania WTP Distribution Mean Groundwater (1, 000 wells w/ problems) Surface Water (% water bodies w/ problems) Air Quality (days of standard violation) Local Community (% time loss) Wildlife Habitat (% habitat fragmented) Status Quo WTP Distribution Standard Deviation Groundwater (1, 000 wells w/ problems) Surface Water (% water bodies w/ problems) Air Quality (days of standard violation) Local Community (% time loss) Wildlife Habitat (% habitat fragmented) Status Quo Estimate 21. 8 6. 5 3. 6 0. 3 11. 1 48. 8 Estimate 42. 3 31. 4 6. 7 22. 6 31. 5 182. 9 p-value 0. 002 0. 081 0. 020 0. 960 0. 030 0. 368 p-value 0. 000 0. 006 0. 092 0. 273 0. 008 0. 006 Texas Estimate p-value 29. 9 20. 1 3. 4 3. 9 9. 1 29. 3 0. 000 0. 003 0. 071 0. 458 0. 380 0. 785 Estimate p-value 42. 3 13. 8 27. 3 4. 6 285. 2 0. 000 0. 927 0. 000 0. 048 0. 799 52 0. 000

Attitudes After the description of shale gas development • Likert scale for attributes and environmental quality (here we average over responses) • Likert scale for opposition/support of shale gas development • Repeated after information and WTP questions 53
 bills First survey wave • groundwater,")
Survey Design Features Payment Vehicle: Increased utility (gas/electric) bills First survey wave • groundwater, surface water, air quality, and community attributes • medium and high baseline • experimental design using orthogonal level selection Second survey wave • substitute habitat fragmentation for community impacts in some versions • low and high baseline • Bayesian D-efficient experimental design using parameter estimates from the first wave (Monte Carlo Modified Fedorov design algorithm following Kessels 2009) 54
 Intermediate Impacts Activities Burdens Site development")
Creating Risk Pathways (Risk Matrices on the web) Intermediate Impacts Activities Burdens Site development and drilling preparation Air pollutants Groundwater Human health impacts Surface water Market impacts Vertical drilling Drilling fluids and cuttings Soil quality Ecosystem impacts Air quality Climate change impacts Horizontal drilling Saline water intrusion Fracturing and completion Fracturing fluids Well production and operation Flowback constituents (other than fracturing fluids) Flowback and produced water storage/disposal Produced water constituents Shutting-in, plugging and abandonment Condenser and dehydration additives Workovers Habitat/community disruptions Upstream and downstream activities Habitat disruption Final Impacts Quality of life impacts Community disruption Occupational hazard Other 55

Example of Impact Pathways Activities Burdens Intermediate Impacts Final Impacts Morbidity Conventional air pollutants and CO 2 On-road vehicle activity Air quality Climate change impacts Noise pollution Community disruption Aesthetics Road congestion Time loss

Surveying the Experts: Findings Some surprises: • • • Surface waters dominate; groundwater risks identified less frequently Only two pathways are unique to the shale gas development process Habitat fragmentation Some expected findings: • • On-site pit and pond storage of flowback Freshwater withdrawals Venting of methane Treatment and release of flowback liquids

Surveying the Experts: Responsibility Who should be responsible for managing risks? Government Industry NGO Industry Academic Gov’t All experts 93. 8% 49. 4% 74. 9% 74. 8% 69. 4% 6. 2% 50. 6% 25. 1% 25. 2% 30. 6% • All groups prefer shared responsibility • For consensus pathways, majority of industry supports government responsibility
- Slides: 58