Research Designs Comparing Groups 8 Quasiexperimental designs Quasiexperiments


")
")

 measuring")


 and noise level (quiet/noisy)")


 after normal working")


 11")


 Before doing anything, clarify your research")
 Step 2: Determine inclusion criteria Researcher")
 Step 3: Calculate effect sizes")
 Step 4: Do basic meta-analysis Need")
 Step 5: Do more advanced analyses")
 Step 6: Write up results Clearly")
 2 recent")


 will always be weaker than true")


 � 5 methodological decisions when conducting an EFA: 1. Study")
 �Study design �Avoid including variables with low reliability �Only include")
 �Study design �Needed sample size depends on variables included (communality,")
 �Is EFA the right analysis? �Use EFA if goal is")
 �Model fitting procedure �Maximum likelihood (ML): can get fit statistics,")
 �Number of factors �Need to retain meaningful factors �Better to")
 �Factor rotation �Orthogonal: factors don’t correlate �Oblique: factors correlate �")


. sav dataset �Check for any")
- Slides: 177
Research Designs Comparing Groups 8
Quasi-experimental designs
Quasi-experiments No random assignment Goal is still to investigate relationship between proposed causal variable and an outcome What they have: Manipulation of cause to force it to happen before outcome Assess covariation of cause and effect What they don’t have: Limited in ability to rule out alternative explanations But design features can improve this
One group posttest only design X O 1 Problems: No pretest: did anything change? No control group: what would have happened if IV not manipulated? Doesn’t control for threats to internal validity
One group posttest only design Example: An organization implemented a new pay-for-performance system, which replaced its previous pay-by-seniority system. A researcher was brought in after this implementation to administer a job satisfaction survey
One group pretest-posttest design O 1 X Adding pretest allows assessment of whether change occurred Major threats to internal validity: O 2 Maturation: change of participants due to natural causes History: change due to historical event (recession, etc. ) Testing: desensitizing participants to the test, using the same pretest for posttest
One group pretest-posttest design Example: An organization wanted to implement a new pay-for-performance system to replace its pay-by-seniority system. A researcher was brought in to administer a job satisfaction questionnaire before the pay system change, and again after the pay system change
Removed treatment design O 1 X O 2 O 3 X O 4 Treatment given, and then removed 4 measurements of DV: 2 pretests, and 2 posttests If treatment affects DV, DV should go back to its pre-treatment level after treatment removed Unlikely that threat to validity would follow this same pattern Problem: assumes that treatment can be removed with no lingering effects May not be possible or ethical (i. e. , ethical conundrum: taking away schizophrenic patients’ medicine treatment; possibility conundrum: therapy for depression, benefits would still be experienced) )
Removed treatment design Example: A researcher wanted to evaluate whether exposure to TV reduced memory capacity. Participants first completed a memory recall task, then completed the same task while a TV plays a sitcom in the background. After a break, participants again complete the memory task while the TV plays in the background, then complete it again with the TV turned off.
Repeated treatment design O 1 X O 2 X O 3 X O 4 Treatment introduced, removed, and then re-introduced Threat to validity would have to follow same schedule of introduction and removal-very unlikely Problem: treatment effects may not go away immediately
Repeated treatment design Example: A researcher wanted to investigate whether piped-in classical music decreased employee stress. She administered a stress survey, and then piped in music. One week later, stress was measured again. The music was then removed, and stress was measured again one week later. The music was then piped in again, and stress was measured a final time one week later.
Posttest-only with nonequivalent groups NR NR Participants not randomly assigned to groups One group receives treatment, one does not DV measured for both groups Big validity threat: selection X O 1 O 2
Posttest-only with nonequivalent groups Example: An organization wants to implement a policy against checking email after 6 pm in an effort to reduce work-related stress. The organization assigns their software development department to implement the new policy, while the sales department does not implement the new policy. After 2 months, employees in both departments complete a work stress scale.
Untreated control group with pretest and posttest NR O 1 X Pretest and posttest data gathered on same experimental units Pretest allows for assessment of selection bias Also allows for examination of attrition O 2
Untreated control group with pretest and posttest Example: A community is experimenting with a new outpatient treatment program for meth addicts. Current treatment recipients had the option to participate (experimental group) or not participate (control group). Current daily use of meth was collected for all individuals. Those in the experimental group completed the new program, while those in the control group did not. Following the program, participants in both groups were asked to provide estimates of their current daily use of meth.
Switching replications NR O 1 X O 2 O 3 X O 3 Treatment eventually administered to group that originally served as control Problems: May not be possible to remove treatment from one group Can lead to compensatory rivalry
Switching replications Example: An organization implemented a new reward program to reduce absences. After a month of no absences, employees were…The manufacturing organization from the previous scenario removed the reward program from the Ohio plant, and implemented it in the Michigan plant. Absences were gathered and compared 1 month later.
Reversed-treatment control group NR O 1 X+ O 2 NR O 1 X- O 2 Control group given treatment that should have opposite effect of that given to treatment group Rules out many potential validity threats Problems: may not be feasible (pay/performance, what’s the opposite? ) or ethical
Reversed-treatment control group Example: A researcher wanted to investigate the effect of mood on academic test performance. All participants took a pre-test of critical reading ability. The treatment group was put in a setting which stimulated positive mood (calming music, lavender scent, tasty snacks) while the control group was put in a setting which stimulated negative mood (annoying children’s show music, sulfur scent, no snacks). Participants then completed the critical reading test again in their respective settings.
Randomized experimental designs
Randomized experimental designs Participants randomly assigned to groups Random assignment: any procedure that assigns units to conditions based on chance alone, where each unit has a nonzero probability of being assigned to any condition NOT random sampling! Random sampling concerns how sample obtained Random assignment concerns how sample assigned to different experimental conditions
Why random assignment? Researchers in natural sciences can rigorously control extraneous variables People are tricky. Social scientists can’t exert much control. Can’t mandate specific level of cognitive ability, exposure to violent TV in childhood, attitude towards women, etc. Random assignment to conditions reduces chances that some unmeasured third variable led to observed covariation between presumed cause and effect
Why random assignment? Example: what if you assigned all participants who signed up in the morning to be in the experimental group for a memory study, and all those who signed up in the afternoon to be in the control group? And those who signed up in the morning had an average of 55 and those who signed up in the afternoon had an average of 27? Could difference between experimental and control groups be attributed to manipulation?
Random assignment Since participants randomly assigned to conditions, expectation that groups are equal prior to experimental manipulations Any observed difference attributable to experimental manipulation, not third variable Doesn’t prevent all threats to validity Just ensures they’re distributed equally across conditions so they aren’t confounded with treatment
Random assignment Doesn’t ensure groups are equal Just ensures expectation that they are equal No obvious reason why they should differ But they still could Example: By random chance, average of control group may be higher than average of experimental group
Random assignment guarantees equality of groups, on average, over many experiments Does not guarantee that any one experiment which uses random assignment will have equivalent groups Within any one study, groups likely to differ due to sampling error But, if random assignment process was conducted over infinite number of groups, average of all means for treatment and control groups would be equal
Random assignment If groups do differ despite random assignment, those differences will affect results of study But, any differences due to chance, not to way in which individuals assigned to conditions Confounding variables unlikely to correlate with treatment condition
Posttest-only control group design R X R O O Random assignment to conditions (R) Experimental group given treatment/IV manipulation (X) Outcome measured for both groups (O)
Posttest-only control group design Example: Participants assigned to control group (no healthy eating seminar) or treatment group (90 minute healthy eating seminar) 6 months later, participants given questionnaire assessing healthy eating habits Scores on questionnaire compared for control group and treatment group
Problems with posttest-only control group design No pretest If attrition occurs, can’t see if those who left were any different than those who completed study No pretest makes it difficult to assess change on outcome
Pretest-posttest control group design R P Randomly assigned to conditions Given pretest (P) measuring outcome variable One group given treatment/IV manipulation Outcome measured for both groups Variation: can randomly assign after pretest X O O
Pretest-posttest control group design Example: Randomly assign undergraduate student participants to control group and treatment group Give pretest on attitude towards in-state tuition for undocumented students Control group watches video about history of higher education for 20 minutes, while treatment group watches video explaining challenges faced by undocumented students in obtaining college degree Give posttest on attitude towards in-state tuition for undocumented students
Factorial designs Have 2 or more independent variables Naming logic: # of levels in IV 1 x # of levels in IV 2 x …# of levels in IV X 3 advantages: Require fewer participants since each participant receives treatment related to 2 or more IVs Treatment combinations can be evaluated Interactions can be tested
Factorial designs R XA 1 B 1 O R XA 1 B 2 O R XA 2 B 1 O R XA 2 B 2 O For 2 x 2 design: Randomly assign to conditions (there are 4) Each condition represents 1 of 4 possible IV combinations Measure outcome
Factorial designs Example: 2 IVs of interest: room temperature (cool/hot) and noise level (quiet/noisy) DV = number of mistakes made in basic math calculations Randomly assign to 1 of 4 groups: Quiet/cool Quiet/hot Noisy/cool Noisy/hot Measure number of mistakes made in math calculations Compare means across groups using factorial ANOVA
Factorial designs 2 things we can look for with these designs: Main effects: average effects of IV across treatment levels of other IV Did participants do worse in the noisy than quiet conditions? Did participants do worse in the hot than cool conditions Main effect can be misleading if there is a moderator variable Interaction: Relationship between one IV and DV depends on level of other IV Noise level positively related to number of errors made, but only if room hot
Within-subjects randomized experimental design R Order 1 Condition 1 O 1 Condition 2 O 2 R Order 2 Condition 2 O 1 Condition 1 O 2 Participants randomly assigned to either order 1 or order 2 Participants in order 1 receive condition 1, then condition 2 Participants in order 2 receive condition 2, then condition 1 Having different orders prevents order effects Having participants in more than 1 condition reduces error variance
Within-subjects randomized experimental design Example: Participants randomly assigned to order 1 or order 2 Participants in order 1 reviewed resumes with the applicant’s picture attached and made hiring recommendations. They then reviewed resumes without pictures and made hiring recommendations. Participants in order 2 reviewed resumes without pictures and made hiring recommendations. They then reviewed resumes with the applicant’s picture attached and made hiring recommendations.
Data analysis
With 2 groups Need to compare 2 group means to determine if they are significantly different from one another If groups independent, use independent samples t-test If participants in one group are different from the participants in the other group If repeated measures design, use repeated measures t-test
With 3 or more groups Still need to compare group means to determine if they are significantly different If only 1 IV, use a one-way ANOVA If 2 or more IVs, use a factorial ANOVA If groups are not independent, use repeated measures ANOVA
Design practice Research question: Does answering work-related communication (emails, phone calls) after normal working hours affect work-life balance? Design BOTH a randomized experiment AND a quasi-experiment to evaluate your research question For each design (random and quasi): Operationalize variables and develop a hypothesis(es) Name and explain the experimental design as it will be used to test your hypothesis(es) Name and explain one threat to internal validity in your design
Comparing means 9
Comparing means � 2 primary ways to evaluate mean differences between groups: �t-tests �ANOVAs �Which one you use will depend on how many groups you want to compare, and how many IVs you have � 2 groups, 1 IV, 1 DV: t-test � 3 or more groups, 1 or more IVs, 1 DV: ANOVA � One-way ANOVA if only 1 IV � Factorial ANOVA if 2 or more IVs
t-tests �Used to compare means on one DV between 2 groups �Do men and women differ in their levels of job autonomy? �Do students who take a class online and students who take the same class face-to-face have different scores on the final test? �Do individuals report higher levels of positive affect in the morning than they report in the evening? �Do individuals given a new anti-anxiety medication report different levels of anxiety than individuals given a placebo?
t-tests � 2 different options for t-tests: �Independent samples t-test: individuals in group 1 are not the same as individuals in group 2 � Do self-reported organizational citizenship behaviors differ between men and women? �Repeated measures t-test: individuals in group 1 are the same as individuals in group 2 � Do individuals report different levels of job satisfaction when surveyed on Friday than they do when surveyed on Monday?
A note on creating groups �Beware of dichotomizing a continuous variable in order to make 2 groups �Example: everyone who scored a 50% or below on a test goes in group 1, and everyone who scored 51% or higher goes in group 2 �Causes several problems �People with very similar scores around cut point may end up in separate groups �Reduces statistical power �Increases chances of spurious effects
t-tests and the linear model �
Rationale for t - test � 2 sample means collected-need to see how much they differ �If samples from same population, expect means to be roughly equivalent �Large differences unlikely to occur due to chance �When we do a t-test, we compare difference between sample means to difference we would expect if null hypothesis was true (difference = 0)
Rationale for t-test �Standard error = gauge of differences between means likely to occur due to chance alone � Small standard error: expect similar means if both samples from same population � Large standard error: expect somewhat different means even if both samples from same population �t-test evaluates whether observed difference between means is larger than would be expected, based on standard error, if samples from same population
Rationale for t-test �Top half of equation = model �Bottom half of equation = error
Independent samples t-test �Use when each sample contains different individuals �Look at ratio of between-group difference in means to estimate of total standard error for both groups �Variance sum law: variance of difference between 2 independent variables = sum of their variances �Use sample standard deviations to calculate standard error for each population’s sampling distribution
Independent samples t-test �
Independent samples t-test �If sample sizes are not equal, need to use pooled variance, which weights variance for each sample to account for sample size differences �Pooled variance:
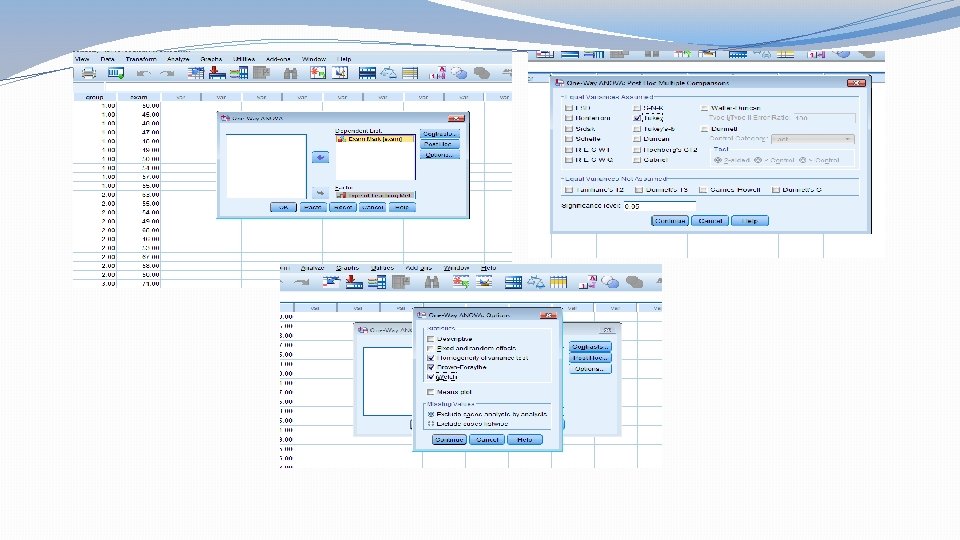
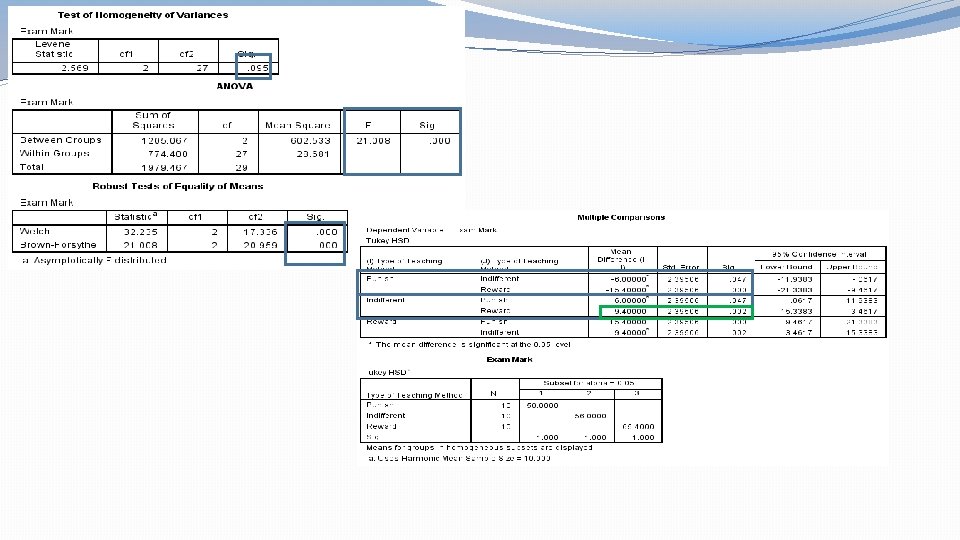
One-way ANOVA in SPSS
One-way ANOVA in SPSS
One-way ANOVA in SPSS
One-way ANOVA in SPSS �
Factorial ANOVA 10
Factorial ANOVA �One-way ANOVA only allows comparison of group means when there is one IV �Comparison of job performance at 6 month review for individuals trained using new training program vs. individuals trained using old training program �Factorial ANOVA allows for comparison of group means when there is more than one IV �Comparison of job performance at 6 month review considering 2 IVs: � Old training program vs. new training program � New managerial hires vs. new entry level hires
Factorial ANOVA �Naming rules � 2 IVs: Two-way ANOVA � 3 IVs: Three-way ANOVA � 2 x 2 ANOVA: 2 IVs, each of which has 2 levels (new vs. old training, management vs. entry level) � 2 x 2 x 2 ANOVA: 3 IVs, each of which has 2 levels � 4 x 3 x 2 ANOVA: 3 IVs, the first has 4 levels, the second has 3 levels, the third has 2 levels
Factorial ANOVA �Independent: different participants in all conditions � Comparing job accidents for high conscientiousness and low conscientiousness employees in agricultural and manufacturing settings �Repeated measures: same participants in all conditions � Measuring participants’ perceptions of procedural justice for a job knowledge test, a job simulation, and a personality inventory �Mixed design: mixture of repeated measure IV(s) and independent IV(s) � Measuring participants’ perceptions of procedural justice for a job knowledge test, a job simulation, and a personality inventory, and evaluating whether these perceptions differ by employee experience (experienced vs. entry level)
Factorial ANOVA �Advantages: �Can incorporate multiple IVs �Can look at interactions between IVs � Is there an interaction between context (manufacturing vs. agricultural) and conscientiousness (low vs. high) in relation to job accidents? � Could find that there’s no difference in job accidents for low vs. high conscientiousness employees in manufacturing settings, but there is a large difference in job accidents for low vs. high conscientiousness employees in agricultural settings
Factorial ANOVA �
Independent factorial ANOVA
Independent factorial ANOVA �Example: 2 independent variables: caffeine and music � 3 levels of caffeine: no coffee, 1 cup of coffee, 2 cups of coffee � 3 levels of music: no music, classical music, death metal music �DV: math test score � 90 participants �Independent design, so each participant in one of 9 groups � 10 participants for group
Independent factorial ANOVA Group Manipulation 1 No coffee/no music 2 No coffee/classical 3 No coffee/death metal 4 One cup of coffee/no music 5 One cup of coffee/classical 6 One cup of coffee/death metal 7 Two cups of coffee/no music 8 Two cups of coffee/classical 9 Two cups of coffee/death metal
Parts of independent factorial ANOVA �
Parts of independent factorial ANOVA �Model sum of squares: variance explained by experimental manipulation �n = number of scores in each group �From example: 10 in each of 9 groups �Grand mean = mean of scores on DV ignoring group membership �Mean of all scores on math test �Group mean = mean of scores on DV for group i �Degrees of freedom = number of groups (k) – 1 �k = # of levels of IVA x # of levels of IVB �From example: k = 9, so df = 8
Parts of independent factorial ANOVA �Main effect: Effect on DV that variable has by itself �Overall relationship between IV and DV �Example: Study investigating the effect of communication method (phone call vs. texting) and length of interaction (5 minutes vs. 10 minutes) on perceptions of friendliness
Parts of independent factorial ANOVA �Main effect of communication method: compare means between phone and text conditions (4. 6 and 3. 55) �Main effect of interaction length: compare means between 5 minute and 10 minute conditions (3. 35 and 4. 80)
Parts of independent factorial ANOVA �Main effect of communication method: compare means between phone and text conditions (4. 6 and 3. 55) �Main effect of interaction length: compare means between 5 minute and 10 minute conditions (3. 35 and 4. 80)
Parts of independent factorial ANOVA �
Parts of independent factorial ANOVA �
Parts of independent factorial ANOVA �Interaction: Interaction between independent variables: effect of 1 IV is different at different levels of other IV �Effect of 1 IV depends on level of the other IV
Parts of independent factorial ANOVA
Parts of independent factorial ANOVA
Parts of independent factorial ANOVA �Main effect of interaction time; more interaction time leads to higher ratings of friendliness �BUT, there is an interaction! �For 5 -minute interactions, there wasn’t much of a difference in friendliness ratings between the phone and the text groups �Those who communicated via phone for 10 minutes gave much higher friendliness ratings than those who communicated via text �So, interaction time affects friendliness ratings, but only when communication is done via phone
Parts of independent factorial ANOVA �
Parts of independent factorial ANOVA �
F-ratio �
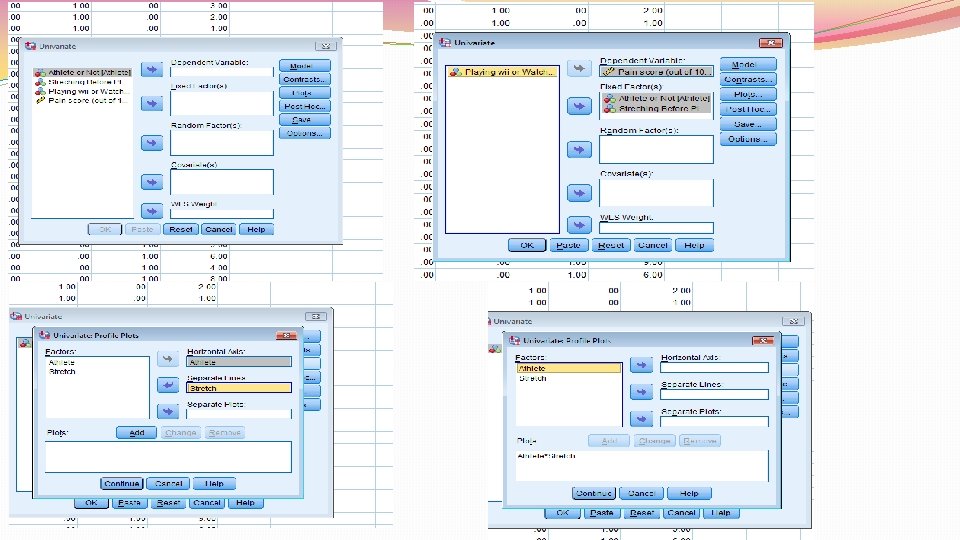
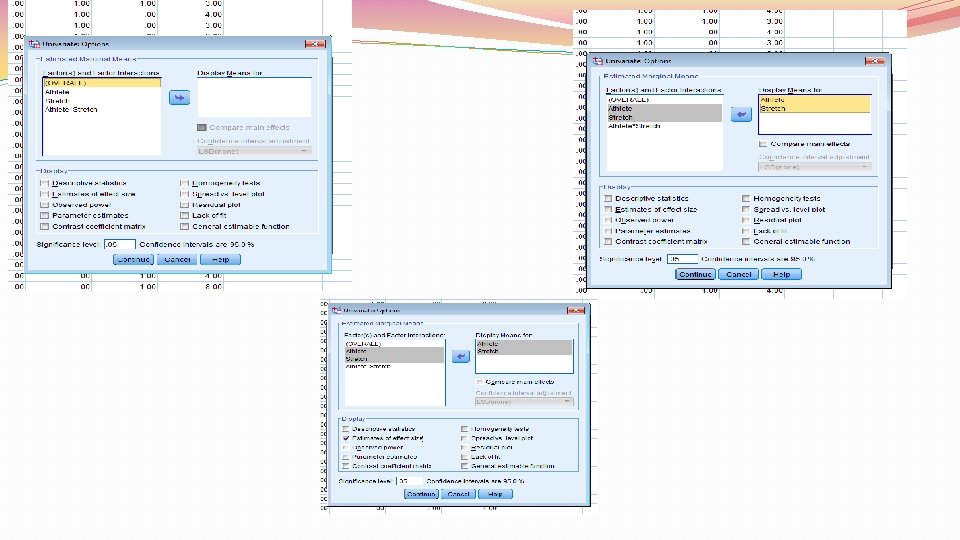
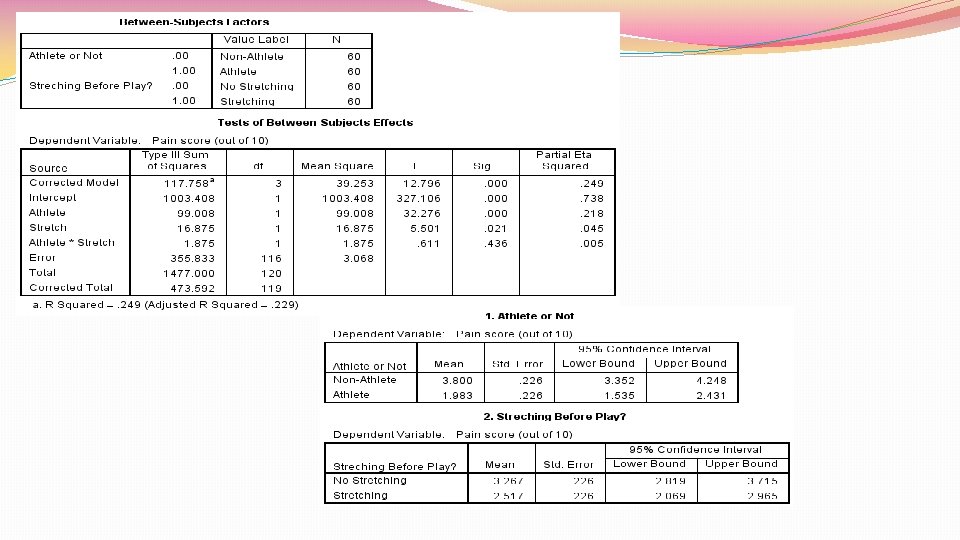
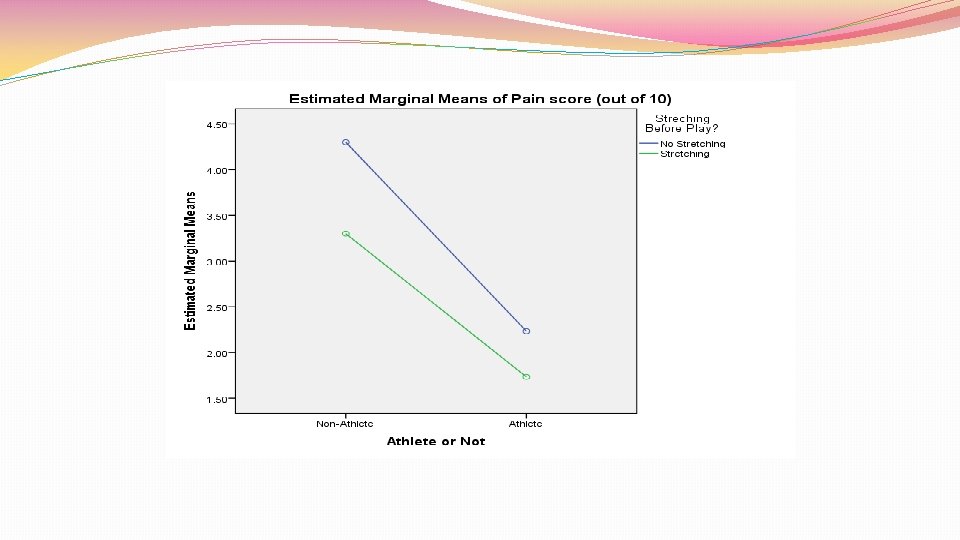
Factorial ANOVA in SPSS
Factorial ANOVA in SPSS
Factorial ANOVA in SPSS
Factorial ANOVA in SPSS
Factorial ANOVA in SPSS
Factorial ANOVA in SPSS
Factorial ANOVA in SPSS
Effect sizes for factorial ANOVA �
Effect sizes for factorial ANOVA �
Repeated measures ANOVA �Used when same people are in all conditions �Advantages: �Reduces unsystematic variance due to random individual differences �Thus, greater statistical power
Repeated measures ANOVA �Since same people in all conditions, independence assumption doesn’t hold �Repeated measures ANOVA assumes sphericity �Sphericity=equality of variances of differences between treatment levels �Because sphericity applies to differences between treatment levels, need at least 3 conditions for sphericity to be an issue
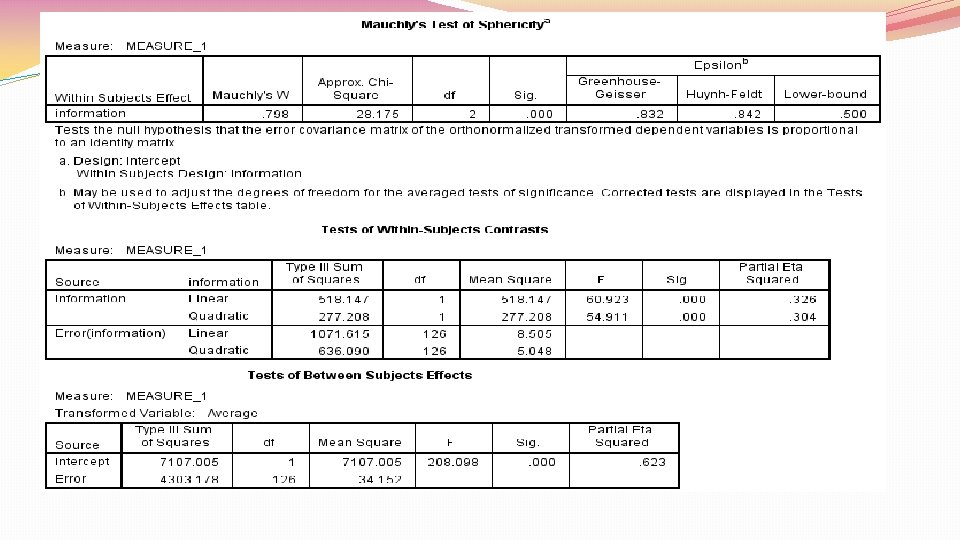
Repeated measures ANOVA �Evaluate whether sphericity assumption holds with Mauchly’s test �If statistically significant, sphericity assumption violated �If sphericity assumption violated, need to correct degrees of freedom for F ratio to make it more conservative �Done by multiplying relevant df by correction �When Greenhouse-Geisser estimate of sphericity larger than. 75, use Huynh. Feldt correction (liberal correction) �When estimates of sphericity smaller than. 75, use Greenhouse-Geisser correction (conservative correction) �Can also interpret multivariate ANOVA (MANOVA), since it doesn’t assume sphericity
Repeated measures ANOVA: one IV
Repeated measures ANOVA: 2 IVs SSR SSM Between. Participant Variance Within-Participant Variance explained by the experimental manipulations SSA SSB Effect of IV A Effect of IV B SSRA SSRB Error for IV A Error for IV B SSA B Effect of Interaction SSRA B Error for Interaction
Parts of repeated measures ANOVA �
Parts of repeated measures ANOVA �
Parts of repeated measures ANOVA �
Parts of repeated measures ANOVA �
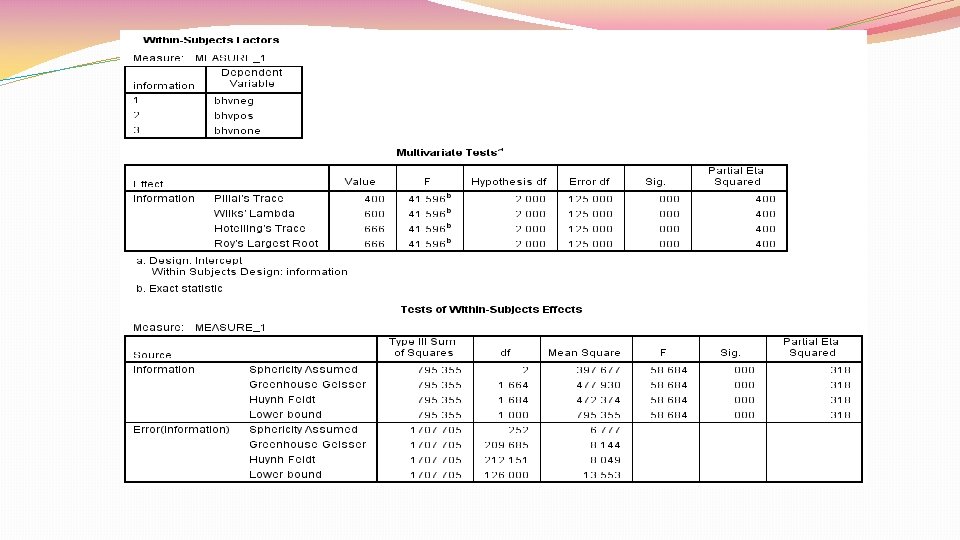
Repeated measures ANOVA in SPSS
Repeated measures ANOVA in SPSS
Repeated measures ANOVA in SPSS
Repeated measures ANOVA in SPSS
Repeated measures ANOVA in SPSS
Repeated measures ANOVA in SPSS
Repeated measures ANOVA in SPSS
Repeated measures ANOVA in SPSS
Repeated measures ANOVA in SPSS
Moving beyond Null Hypothesis Significance Testing (NHST) 11
Problems with NHST Dichotomous thinking promoted by p value If p =. 049, we’re excited because finding significant! If p =. 051, we’re sad because finding non-significant! Whole idea of testing null hypothesis to demonstrate feasibility of alternative hypothesis odd Not supporting alternative hypothesis so much as rejecting null hypothesis Type I or II errors due to: Poorly designed study (bad sample, bad design, etc. ) Measurement error (poor reliability/validity)
Confidence intervals Point estimate: single number as estimate of a value “It will rain tomorrow at 2 pm” Intervals: Range of numbers as estimates of value “It will rain tomorrow between 10 am and 3 pm” The wider the interval, the more sure we are that the true population value is in the interval But, the wider an interval, the less useful it is “It will rain tomorrow between 4 am and 11 pm” More likely to be accurate, but how useful is this?
Confidence intervals Confidence interval: range of values that should include true population value Usually use 95% confidence interval Means that if we repeated study an infinite number of times and created a 95% confidence interval for each study, 95% of these confidence intervals would contain true population value Does not mean 95% chance that single confidence interval contains true population value
Confidence intervals Width of confidence interval shows how much sampling error likely occurred Sampling error: difference between estimates that result from studying sample rather than population Wide confidence interval = lots of sampling error Narrow confidence interval = little sampling error A note on significance testing: if confidence interval contains 0 (correlations, differences between means, etc. ), the estimated value is not statistically significant If it doesn’t contain 0, it is statistically significant Always report confidence intervals!
Effect sizes Effect size: strength of relationship between variables, or magnitude of difference between groups Unstandardized effect size: dependent on scale used in study Size of difference between 2 groups on 10 -point job satisfaction scale Standardized effect size: not dependent on scale used in study Puts effect size in standard deviation units Difference between 2 groups on job satisfaction scale expressed in standard deviation units Best to use standardized effect size measure Allows for comparison across studies
Effect sizes Allow researchers to decide whether an effect is worth paying attention to Whether effect size is large enough to be “important” varies depending on purpose of research Example: Relatively small correlation between conscientiousness and job performance could still be important For large organization, even a small improvement in hiring success = lots of money saved Example: Relatively small difference between reading scores of students who completed new after-school program and students who didn’t might not be important if after-school program is really expensive Would need big difference to justify cost Allows for comparison across studies
Meta-analysis A “study of studies” Rather than each individual serving as the unit of analysis, each study serves as unit of analysis Allows for synthesis of existing research: across all studies conducted looking at a particular effect, what can be concluded? Summarizes existing research and provides single meta-analytic effect More confidence in findings across group of studies than in single study: estimates much less vulnerable to sampling error Gives more accurate picture of effect: should incorporate previously unpublished research (which was often not published due to non-significant findings) Strengthens external validity: lots of samples
Meta-analysis can tell us: The mean and variance of underlying population effects What is the mean difference in work-family conflict scores between men and women, and how much does this vary? What is the mean correlation between conscientiousness and job performance, and how much does this vary? The variability in effects across studies How much does the difference in work-family conflict between men and women vary across studies included in the meta-analysis? How much does the correlation between conscientiousness and job performance vary across studies included in the meta-analysis? Moderator variables: do any variables explain the variability between studies? Does occupation of respondents affect difference between men and women in work-family conflict scores? Does the correlation between conscientiousness and job performance vary depending on how job performance is measured?
Steps in meta-analysis (From Field & Gillett, 2010) Before doing anything, clarify your research question What are you looking at? Step 1: Do a literature search Find every study you can that addresses your research question Go beyond traditional searches (Psyc. Info, Google Scholar, etc. ) and contact authors who are well-known in the area of research May have previously unpublished research (rejected articles, conference papers, etc. ) that can be included Important! Published research tends to only include significant findings
Steps in meta-analysis (From Field & Gillett, 2010) Step 2: Determine inclusion criteria Researcher must decide which studies to include, and which to exclude Inclusion and exclusion criteria depend on research question, but can include: Samples used (such as “only organizational samples” or “no student samples” or “sample size of at least 50”) Research design (such as “only randomized experiments”) Way variables measured (such as “only studies that used supervisory job performance ratings”)
Steps in conducting meta-analysis (from Field & Gillett, 2010) Step 3: Calculate effect sizes for all studies included Need to choose an effect size measure-will depend largely on your research question Once effect size chosen, need to calculate for all studies Some will have reported it already, some will not Can use reported statistics (means, standard deviations, inferential statistics and their associated p values) to calculate effect size needed Can convert reported effect size to the effect size that you need (for example, convert d to r)
Steps in meta-analysis (From Field & Gillett, 2010) Step 4: Do basic meta-analysis Need to decide between fixed effects model and random effects model Fixed effects model: studies included assumed to represent entire population of interest- differences in effect size due only to sampling error Random effects model: studies included assumed to come from larger population of interest, and thus effect size varies across them When in doubt, use random-effects model Using fixed-effects model when random-effects model needed causes inflated Type I error rates Using random-effects model when fixed-effects model needed doesn’t bias results as drastically All meta-analytic methods correct for sources of error (such as sampling error and poor reliability) in some way in estimation of meta-analytic effect size
Steps in meta-analysis (From Field & Gillett, 2010) Step 5: Do more advanced analyses Moderator analyses: do effect sizes differ across studies due to some factor (samples, measures, etc. )? Estimating publication bias: how much are effect sizes affected by journals’ tendency to publish only significant findings?
Steps in meta-analysis (From Field & Gillett, 2010) Step 6: Write up results Clearly explain all decision points in meta-analysis (inclusion criteria, effect size choice, etc. ) Should describe all results, including variability of effect sizes, estimated population effect size and its confidence interval, publication bias, and moderator analyses
More on meta-analysis 3 articles posted on Blazeview: Field & Gillett (2010) 2 recent meta-analyses: For the I/O students: Beus et al. (2015) For the clinical/counseling students: Vös et al. (2015)
Measurement Issues 12
Reliability
Why is reliability important? We use tests to make decisions Advancing in the selection process based on cognitive ability score Being admitted into grad school based on GRE score We don’t want to make incorrect decisions based on problematic test scores Example: What if a cognitive ability test was so unreliable that it changed rank order of job applicants? The people hired might not be the most capable
Classical test theory
Classical test theory Technical definition of true score: average of test taker’s observed scores that would be obtained over infinite number of administrations of same test May be easier to think about true score as being test taker’s actual amount of construct that’s being measured
Classical test theory Reliability dependent on 2 things: Extent to which differences in observed scores can be attributed to true score differences Extent to which differences in observed scores can be attributed to measurement error
Reliability and statistics
Reliability and statistics Observed correlations (between observed scores) will always be weaker than true correlations (between constructs) Measurements not perfect: no measure perfectly reliable Low reliability weakens (attenuates) observed correlations
Reliability and statistics
Test-retest reliability Have participants take the same test twice, and correlate scores 2 requirements: No true score change between tests Equal error variance for both tests
Test-retest reliability Only works if construct being measured is something that does not change over testing period True score can’t change from time 1 to time 2
Test-retest reliability Some attributes less stable than others Stable: personality, intelligence Unstable: mood, stress Length of test-retest interval important Longer interval=more opportunity for true score change Period during which test-retest interval happens important Some attributes change more during some periods of life than others (example: children and reading skill)
Test-retest reliability If true scores don’t remain stable over time, test-retest correlation reflects both: Extent to which measurement error affects test Change in true scores Other problems: Requires administering test twice to same people: may be difficult to do If interval between tests is short, test takers may remember information from the first testing
Internal consistency reliability Respondents only need to take test once Different parts of test treated as different forms 2 factors affecting reliability: Consistency among parts of test Test length
Content validity Threats to content validity Test includes construct-irrelevant content Content unrelated to construct included in test Example: cognitive ability test includes items measuring self-efficacy Test underrepresents construct Important aspects of construct missing from test Example: cognitive ability test doesn’t include any items measuring verbal ability
Content validity Construct-irrelevant content Construct Irrelevant content
Content validity Construct under-representation Construct Test content
Response processes Match between psychological processes respondents should use when completing a measure and the ones they actually use Items are usually written assuming that respondents will use a particular thought process to arrive at a solution Our interpretation of their score relies on these assumptions being met
Response process example Dominance vs. ideal point models of item response Traditional dominance models assume that the higher a test taker scores on an item, the higher their level of the trait measured by the item I. e. , a test taker who chooses a 5 (strongly agree) on a Likert scale has more of the trait than a test taker who chooses a 4 (agree) Ideal point (unfolding) models assume that the test taker will strongly agree only with items that measure their particular level of the latent trait
Response process example Consider someone who is extremely introverted. 2 extraversion items, rated 1 (strongly disagree) to 5 (strongly agree): “I love going to parties” “I enjoy chatting quietly with a friend in a coffee shop” Agreement with the first item should imply higher levels of extroversion, and agreement with the second item should imply lower levels of extroversion But, what if the respondent is so introverted that chatting with a friend in a coffee shop is too much for them? They would disagree with both items How would we interpret their score?
Convergent and discriminant validity Test scores should be associated with measures of related concepts, and not associated with measures of unrelated concepts Should be match between expected relationships (based on theory and previous research) and actual relationships
Convergent and discriminant validity Convergent validity evidence: test scores correlated with measures of related constructs Example: cognitive ability test scores positively correlated with measures of problem-solving ability and job performance Discriminant validity evidence: test scores uncorrelated with measures of unrelated constructs Example: cognitive ability test scores not correlated with conscientiousness scores or years of job experience
Convergent and discriminant validity Concurrent validity evidence: test scores correlated with scores on other measures of interest that are measured at the same time Collecting scores on new conscientiousness scale and current job performance ratings from incumbents Predictive validity evidence: test scores correlated with scores on other measures of interest that are measured at different times Collecting scores on new conscientiousness scale from applicants, and correlating with job performance data after 6 months on the job
Consequences of testing What are the consequences of test scores? Does use of test scores benefit some groups more than others? Relates to issues of test bias and fairness Example: Men score higher than women on pre-employment cognitive ability test, and are thus hired at a higher rate Is this ok? Is it concerning? Should the test continue to be used?
Factor analysis 13
Dimensionality �Often, psychological tests don’t measure just one “thing” �May measure multiple constructs �NEO-PI-R: Conscientiousness, extraversion, neuroticism, openness to experience, agreeableness �May measure multiple facets of one construct �Conscientiousness facets: competence, order, dutifulness, achievementstriving, self-discipline, deliberation
Dimensionality �When a test measures more than one “thing, ” it’s multidimensional �Important implications for test use �Need to create score for each dimension �If test multidimensional, ignoring this dimensionality and creating overall test score results in useless, uninterpretable score
Dimensionality �Example: What if we just averaged together scores on all NEO-PI-R items? What would a “high” score mean? � High on all 5 personality constructs? � Really high on 4 of the 5 but low on agreeableness? � Medium-high on 3 of the 5 constructs and very high on neuroticism and conscientiousness? � How would such a score be used? � Useless for diagnostic decision-making purposes: doesn’t give clear picture of standing on personality constructs
Factor analysis in SPSS
Factor analysis in SPSS
More factor analysis! 14
Fabrigar et at. (1999) � 5 methodological decisions when conducting an EFA: 1. Study design: variables included, size and nature of sample 2. Goals of project 3. Model fitting procedure 4. How many factors to include 5. How to rotate
Fabrigar et al. (1999) �Study design �Avoid including variables with low reliability �Only include variables that relate to what you’re trying to measure � Don’t use “everything but kitchen sink” approach � Can lead to inclusion of irrelevant factors, or missing true underlying factor structure �Need at least 3 -5 variables per expected factor: should aim to have 4 -6 � Better to err on side of having more � If no expectations regarding factor structure, include enough items to ensure domain of interest appropriately sampled
Fabrigar et al. (1999) �Study design �Needed sample size depends on variables included (communality, number of variables per factor) �Sample also plays role: need some variability on variables being measured � Example: if your entire sample consists of graduate students, won’t have enough variability on cognitive ability test � 100 bare minimum sample size �In most situations, probably need more (>200)
Fabrigar et al. (1999) �Is EFA the right analysis? �Use EFA if goal is to find � variables that explain correlations between variables �Use PCA if you want to reduce variables into smaller groupings and don’t care about latent variables �Use CFA if you have a good idea of how many factors underlie your data, and you just want to verify this � Or if you want to test fit of several competing models � Used for hypothesis testing � Can use EFA first on subset of data, and then confirm model using CFA on another subset of data
Fabrigar et al. (1999) �Model fitting procedure �Maximum likelihood (ML): can get fit statistics, but strongly assumes multivariate normality and can’t handle departures from this �Principal axis factoring (PAF): fewer fit statistics, but no distribution assumptions and more likely to converge on appropriate solution � Better at dealing with messy data and more likely to converge � Leptokurtic and platykurtic data
Fabrigar et al. (1999) �Number of factors �Need to retain meaningful factors �Better to err on side of retaining more factors than might be needed � Underfactoring can lead to inaccurate model estimation because items will have to load somewhere (items will load to factors that are not strongly related) �Kaiser criterion tends to overfactor �Scree plot: useful, but very subjective �Fit statistics: compare fit (if using ML estimation): pick model with best fit �Theoretical considerations play a role
Fabrigar et al. (1999) �Factor rotation �Orthogonal: factors don’t correlate �Oblique: factors correlate � Best option in psychology � If factors don’t correlate, between-factor correlations will reflect this
Factor scores �Can calculate individual’s score on a factor �Example: if conscientiousness test had 4 factors, we might want to calculate scores on the “responsibility” factor �Weighted average method: plug individual’s scores into the factor equation �Multiply score by factor loading for that item, add up results across items �Not often used, since it requires all variables to be on same scale of measurement
Factor scores �Regression method: Takes unit of measurement and variance into account �Scores can be correlated with one another �Bartlett method: ensures scores correlate only with their factor �Orthogonal rotation �Anderson-Rubin method: Factor scores uncorrelated with each other, mean of 0, standard deviation of 1
Factor scores �Can be useful in analysis �Use factor scores rather than scores on each individual variable �Particularly helpful for reducing multicollinearity in regression
Factor scores in SPSS
Scale development �When creating and evaluating a new scale, EFA and reliability analyses go hand-in-hand �Need to use EFA to evaluate how many factors scale has, and which items load on which factor �Can then remove items which don’t load on any factor, or cross-load �Then, need to evaluate reliability for each factor (after removing problematic items) �Items which reduce reliability can be removed
Scale development practice �Open the Nichols & Nicki (2004). sav dataset �Check for any items that need to be reverse-coded �Run an initial EFA �Determine the number of factors to retain �Re-run the EFA �Make note of which items should be removed from the scale �Run reliability analyses (use alpha) for each factor �Determine if any additional items need to be removed