RESA Middle School Our SMART Journey Everyone Learns


- Slides: 34
RESA Middle School Our SMART Journey “Everyone Learns”.
SMART Presenters Jan Aschim - Science William Ady – Principal Jim Sheridan – Math Leader Keith Doering – Language Arts Jane Pickett - Math Mary Conover – Special Education
Our mission is to mentor, inspire and empower our students to be successful. RESA Middle School Mission Statement
RESULTS GOAL INDICATORS MEASURES TARGETS M & E on DEA will increase 3% from 2014 DEA D to 2015 DEA D RESA Middle School Students will increase their overall average of literacy by 10% on the Illinois State Test (ISAT/PARCC) by the end of the 2016 -2017 school year. Reading Comprehension Writing Skills Vocabulary DEA Tests A, B, and D PLC Created CFA District Benchmarks CWA, CFA M & E on DEA will increase 3% from 2015 DEA D to 2016 DEA M & E on DEA will increase 3% from 2016 DEA D to 2017 DEA D 70% of students will meet and exceed on district benchmarks and PLC created CFA's by the end of 2016 -2017 school year. Long Range Literacy Goal
Long Range Math Goal RESULTS GOAL INDICATORS MEASURES Expressions and Equations TARGETS M + E on DEA will increase 3% from 2014 DEA D to 2015 DEA C Geometry RESA Middle School Students will increase numeracy by 10% (school average) on the Illinois State Test (ISAT/PARCC) by the end of the 2016 -2017 school year. DEA Tests A, B, and C Statistics and Ptobability M + E on DEA will increase 3% from 2015 DEA D to 2016 DEA C The Number System Star Math Assessment Ratios and Proportionality Functions RESA will achieve a median growth rate on SGP of 40 or higher each year
DEA Growth from Test A to Test B Reading Grade Level Achievement Level 3 and Level 4 (Meets and Exceeds) – growth from Test A to Test B 6 th +5. 4% 7 th 11. 4% 8 th -4. 8% RESA Average +4. 0%
DEA Growth from Test B to Test C Reading Grade Level Achievement Level 3 and Level 4 (Meets and Exceeds) – growth from Test B to Test C 6 th -3. 4% 7 th -3. 3% 8 th +7. 9% RESA Average +0. 4%
DEA Growth from Test A to Test C Reading Grade Level Achievement Level 3 and Level 4 (Meets and Exceeds) – growth from Test A to Test C 6 th +2. 0% 7 th +8. 1% 8 th +3. 1% RESA Average +4. 4%
DEA Comparison Mathematics # of Level 3 & 4 students Test A Test B Test C Change A-C 6 Th Grade 24 100 101 77 7 Th Grade 48 74 80 32 8 th Grade 43 35 63 20 RESA 115 209 244 129 This addresses our yearlong school goal of increasing our Level 3 and Level 4 totals by 10 students between DEA tests A and B and 20 students between A and C. We STRIVE for excellence
STAR Math Test Average Average Grade e Scaled Grade Equivale Score Equivalent nt Test 2 Test 3 Average Scaled Score Average Grade Equivalent Test 1 6 th Grade 666 4. 9 702 5. 6 7 th Grade 693 5. 4 707 5. 7 719 5. 9 8 th Grade 731 6. 2 736 6. 3 738 6. 3 RESA Test 2 We challenge our students to set a goal for themselves of raising their STAR score by 25 points each quarter. We STRIVE for excellence
STAR Math Test Benchmark Scaled Score RESA Meeting or Exceeding Test 1 Test 3 Test 2 Winter Fall Spring 6 th Grade 694 41% 57% 54% 7 th Grade 728 37% 42% 49% 8 th Grade 758 44% 46% 47% We STRIVE for excellence
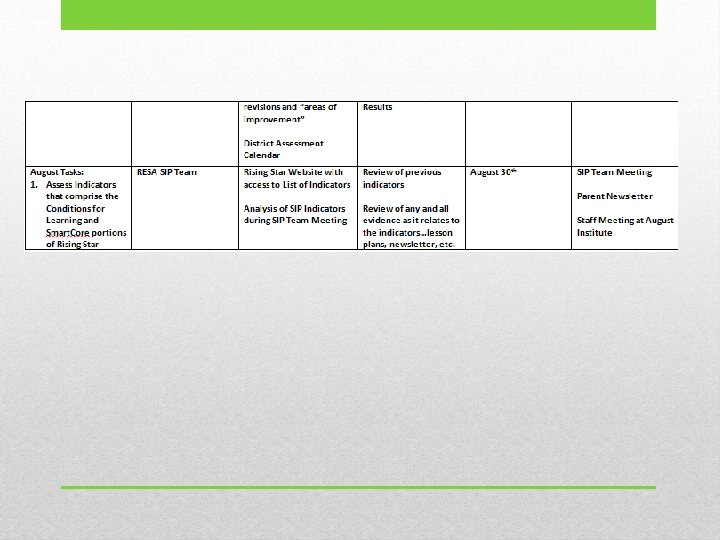
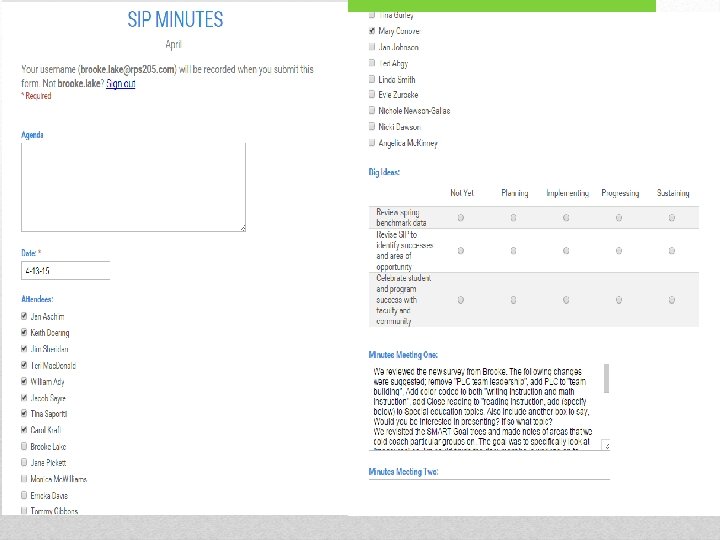
Updated 4/27/15 w/revisions, successes and areas for improvement RESA SIP Action Plan
RESA SIP Action Plan Continued
RESA SIP Action Plan Continued
RESA SIP Action Plan Continued
RESA SIP Action Plan Continued
RESA SIP Action Plan Continued
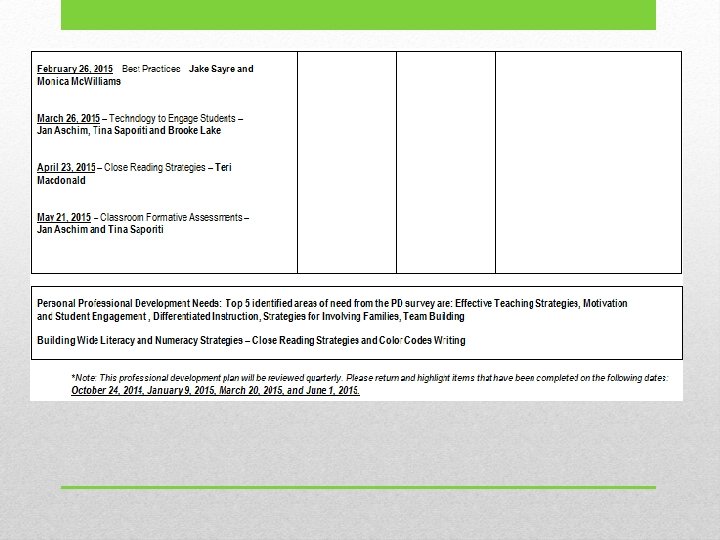
Building Professional Development Plan
Building Professional Development Plan Continued
• Deeper understanding of the SMART Goal Tree – Goal, Indicators, Measures and Targets…this was not the case in August…showed improvement in October and more improvement in February. • SMART/SIP Team has become very comfortable (not at first) sharing and critiquing each other’s work. (SMART goals, data, etc. ) • First RESA Newsletter was sent out in October…we now have a plan to mass e-mail to parents and to add student and staff celebrations that are tied directly into targets and SMART goals. • As a staff we have adopted building wide strategies that are being used across most content areas. • Our SIP Team created a user-friendly Google Doc that has stream-lined and simplified the process for recording minutes and monitoring completed SIP tasks. • Student Celebrations are now a weekly event as we announce several celebrations each Friday during our RESA Morning Broadcast. RESA SMART Journey High-Lights
• PLCs and SIP Team will continue to analyze and incoming benchmark data during the month of May to see if PLCs met their SMART goals and to see if we met our building SMART goal • Celebrate success with students, staff, parents and community…we will include celebrations in our May/June newsletter. • Continue to make revisions and additions to SIP plan for the Fall. • Begin putting together the RESA PD plan for 2015 -2016 school year. So…what next?
• We have clear goals • We have the same goal • We have different coaching styles so we are able to reach a variety of colleagues that need our guidance. SMART Coach Strengths
• A plan to identify colleagues that need coaching. • Time to build relationships for effective coaching SMART Coach Needs
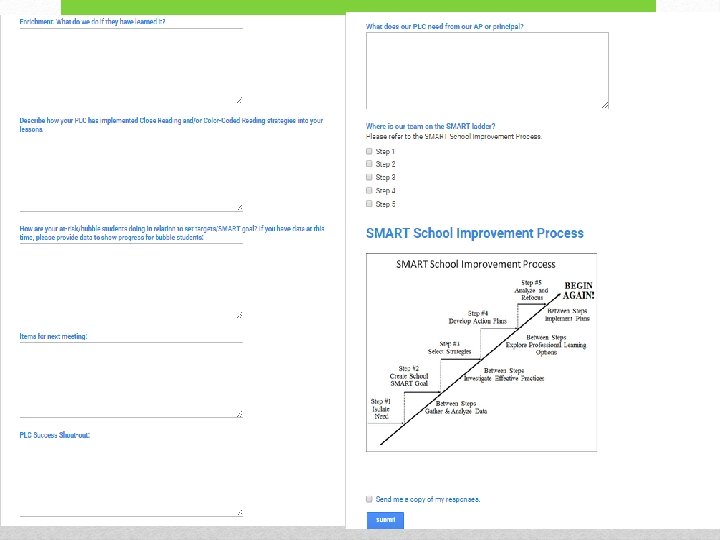
SMART Goal Tree – Help Sheet Definition Goal Indicators PLC SMART Goal should align to the building SMART Goal. Standards - Common Core Objectives Strategic Specific Measureable Attainable Results Oriented Time bound Targets Steps along the way Allows you to track improvements for each measure. Evidence we look for to see if the goal is being achieved. Essential learning outcomes Attainable performance level we want to see Specific skills and performances List for each measure. This should be results-based on greatest area of need. (GAN) Must include: % of students or number of students (Who) Score % on need-(What) Time –(from when to when) 85% of students in the 8 th grade students will be proficient writers at their grade level by December 31, 2014. You can also have different targets for different subgroups. ELA Organization Mechanics Conventions Thesis/Claim Conclusion Math Example Measures Assessments you will use to see if you are progressing on the indicators. Expressions 1 & 2 Step Equations w/integers Problem Solving Exponents Solving Eq. with 1 Variable Science NGSS Science and Engineering Standards PLC / Teacher created Homework Thumbs up/down Exit slips DEA CFA/Benchmark test (District) STAR Bell Ringers Quizzes Assignments Labs Investigations CWA Teacher Observation Timed Test Interactive Notebook Workbook Text Analysis DBQ’s 65% will be proficient by December 25 point increase each month 60% of Special Education students.
• • • • Primary focus of School Improvement is School SMART goals: F = 30%/A = 70% Our PLC Goals align to and support our School SMART goals: F = 33%/A = 61% Our school continuously monitors learning progress using SMART Goal Tree: F = 37%/A = 57% Our SMART Leadership Team guides the implementation of the SMART School Improvement Process: F = 26%/A = 70% Our school conducts self-assessments to check our adherence to the SMART School Improvement Process: F = 41%/A = 46% We use data to monitor progress toward our School SMART Goal: F = 37%/A = 59% We use data across grade levels and/or departments to lead our School Improvement Process: F = 42%/A = 37% Our school’s PD plan is driven by our SMART School Improvement Process: F = 26%/A = 64% We use data to make strategic instructional and resource decisions: F = 42%/A = 53% We use our School SMART goal to close the achievement gaps in our GAN: F = 44%/A = 48% We have agreed upon a core set of values and norms for how we will work together: F = 31%/A = 61% We adhere to our norms: F = 52%/A = 39% We hold ourselves accountable for having open and honest dialogue about school improvement: F = 35%/A = 57% We share responsibility for the achievement of our School SMART Goals: F = 46%/A = 48% As a school community, we continuously learn through examination of our collective practice: F = 52%/A = 43% RESA Spring SMART Survey Results
• There is a lot of collaboration among grade level PLCs but not across grade levels (vertical articulation) • Is “we” the PLC team, department, grade level? Some confusion with this but this person answered under the assumption that “we” meant PLC. • “Our school SMART goals are the foundations for our PLCs and our specific instructional planning. ” • “The SMART goal process has too much jargon that can hide what we’re really trying to do. The process makes sense, but to me the language gets in the way. ” RESA Spring SMART Survey Comments
• “We have come a long way this year. Information has been relayed to all staff so they know why decisions are being made and how it relates to them. ” • “I think we are on the right path…we have had a few staff members resist but more are coming on board…I am excited about how far we have come but also about where we are going. We have created a foundation that will serve us well in the near future and beyond. ” RESA Spring SMART Survey Comments
• “As a special ed teacher, it is very difficult to co-teach and adhere to the SMART goals. We might only see the student who is having problems once a day, and that’s the only time we teach in that grade level. This gives us a limited amount of time to work with that student. This does not include our special ed students. We are required to take on a regular ed student who is struggling as well as our special ed students. This is another responsibility for special education teachers. We are spread very thin. WE often have 3 to 4 preps, often in different grade levels and different subjects. We are assigned a PLC group, however our responsibilities are not limited to that group. It’s difficult to find the time. ” RESA Spring SMART Survey Comments