REPRESENTATION OF ION DENSITIES IN IRI Vladimir Truhlik


- Slides: 22

REPRESENTATION OF ION DENSITIES IN IRI Vladimir Truhlik Department of the Upper Atmosphere Institute of Atmospheric Physics, Academy of Sciences of the Czech Republic Praha, Czech Republic Email : vtr@ufa. cas. cz

Outline • Ion composition –Theory and basic processes –Representation in IRI • The upper transition height –Increase accuracy of the model • Conclusions COSPAR CBW 2

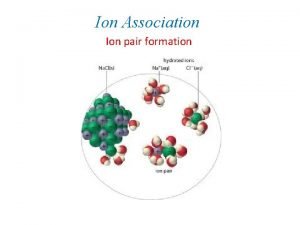
Ion composition Neutral atmosphere - MSIS Photoionization O, N, O 2, N 2, He O+, N+, O 2+, N 2+, He+, … COSPAR CBW 3

Ion composition – ion molecule reactions O 2+ O+ N+ He+ O++ N 2+ COSPAR CBW Plasmasphere formation 4

Ion composition • Generally plasma moves – photochemical equilibrium not enough (F region and above) • Field aligned transport (F region, topside, plasmasphere) • Continuity equation (for the sth ion) n-density A-cross section of the flux tube u-velocity of particles P, L - Production and loss • Momentum equation n-density u-velocity of particles D-diffusion coefficient F-external forces (gravity, drag etc. • To solve these equations - plasma temperatures are needed (plus neutral composition and temperature, winds and drifts) COSPAR CBW 5

IRI - ion composition • Necessary to have an empirical representation – e. g. for initial and boundary conditions for theoretical models • IRI (2016 latest version, 2012 and 2007 previous versions) • Topside (above F 2 up to 2000 km - relative density of O+, He+, N+ in dependence on geophysical parameters) : – TBT-15 (Truhlik, Bilitza, Triskova, ASR 2015) – DY-1985 (Danilov and Yaichnikov, 1985) • Bottomside (up to F 2, relative density O+, NO+, O 2+, N+) – RBV-2010 (Richards, Bilitza, and Voglozin, RS, 2010) – DS-1995 (Danilov and Smirnova, ASR, 1995) • IRI option – FORTRAN code - JF switch - JF(6) –. true. DS-1995 & DY-1985 –. false. RBV-2010 & TBT-15(recommended) COSPAR CBW 6

Ion composition An example of ion composition measurement onboard IK 24 COSPAR CBW 7

IRI topside ion composition model TBT-15 (Truhlik, Bilitza, Triskova, ASR 2015, included in IRI from v. 2016) Empirical model of O+, He+, N+ relative densities Evolved from TTS-03 (Triskova, Truhlik, Smilauer, (ASR Vol. 31, No. 3, 653, 2003) Data used: TBT-15 also includes results from C/NOFS at low latitudes The full model consists of sub-models for individual altitude ranges and seasons HSA: 550 ± 80 km, 900 ± 100 km, 1500 ± 150 km, and 2250 ± 250 km LSA: 400 ± 50 km, 550 ± 70 km, 750 ± 90 km, and 1000 ± 150 km COSPAR CBW 8

Ion composition maps (LT vs latitude) COSPAR CBW Example of contour plots 9

Vertical profiles Examples of equinoctial vertical profiles of the relative ion densities calculated from the TTS model for high (F 10. 7=200) and low solar activity (F 10. 7=85) and for two local times (12 h and 22 h) and two latitudes (0 and 30 deg). COSPAR CBW 10

Solar activity dependence Absolute densities of individual ions on log scale are close to linear dependence on solar activity (F 10. 7 index). Dependence of the logarithm of the individual ion densities from Atmosphere Explorer C&E and Intercosmos 24, and of the relative ion densities on the solar activity level characterized by the actual day values of the F 10. 7 index. Example for equinox, equator± 15 deg, mid-latitudes 50± 15 deg, altitude of 850± 90 km, daytime and nighttime. Pointsmeasured values, lines-values fitting. (Truhlik et al. , Ann. Geophys, 2005)

+ + + He vs. H and He dominance He+ is usually a minor ion in the topside ionosphere and plasmasphere -low solar activity [He+]/[H+] ≈ 0. 1 but -high solar activity [He+]/[H+] in the topside ionosphere can be >1 and even at the same time [He+]/[O+] >1 => He+ is dominant IRI TTS-03 -middle-latitudes at nighttime COSPAR CBW 12

IRI bottomside RBV-2010 Richards, Bilitza, and Voglozin, RS, 2010 Comparison of ion and electron densities for the down leg and up leg portions of AE-C Orbit 3156 on 12 September 1974. (a) The IDC (=RBV-2010) model (lines) and AE-C MIMS data (symbols) for the down leg with the IDC model using the MIMS measured electron densities and the OSS measured neutral densities. (b) The IDC and IRI model densities for the down leg with IDC using the IRI electron densities and the NRLMSISE -00 model neutral densities. (c and d) The same comparisons as Figures 2 a and 2 b for the up leg. The large diamond shows the Nm. F 2 measured by the Canberra ionosonde. COSPAR CBW 13

IRI-2016 topside+bottomside H+ N+ Ne O+ He+ NO+ O 2+ COSPAR CBW 14

The upper transition height Altitude where the distribution of the dominant ions changes from the topside ionosphere (O+) to the plasmasphere (H+ and He+) Lower boundary of the plasmasphere O+/H+ or O+/light ions (sum H+ and He+) Low solar activity – He+ negligible – both heights almost identical High solar activity – both heights can differ by about several tens km or by 10% (Triskova et al. , ASR, 1998) COSPAR CBW 15

The upper transition height Chemical equilibrium: COSPAR CBW k 1=2, 5. 10 -11 Tn 0, 5 k 2=2, 2. 10 -11 Ti 0, 5 [O]=9/8*[H] Very good approx. at night 16

IRI - The upper transition height IRI 2007 IRI 2012 Equatorial upper transition height from the IRI 2007/TTS-03 and IRI 2012/TTS-03 (removed upper and lower threshold F 10. 7=85 and 200) model (solid color lines) and from the DY-85 model for years from 2000 (solar maximum) to 2009 (solar minimum). h. T from DY-85 exhibits no dependence on solar activity and at daytime is about 1000 km. h. T from TTS-03 shows a dramatic change; the lowest daytime values at solar minimum are about ~860 km for IRI 2012/TTS-03 which is still above values from the C/NOFS measurements. This means that IRI ion composition models overestimate the fraction of O+ or/and underestimate the fraction of H+ in the topside ionosphere during very low solar activity (F 10. 7 about 65). COSPAR CBW 17

IRI – ion composition improvement IRI 2007 - IRI 2012 – IRI 2016 TTS-03* TBT-15 h. T C/NOFS measurement Ratio between IRI predictions and C/NOFS-CINDI measurements of O+ (blue) and H+ (red) densities versus the F 10. 7 monthly solar index for IRI-2012 and the new IRI-2016. Note the large improvement at low solar activities. Topside ion composition with the IRI-2007 (dotted curves), IRI-2012 (dashed curves), and the new IRI-2016 models (solid curves). Note the steady decrease in upper transition height ht from close to 1000 km in IRI-2007 to close to 700 km in IRI 2016. COSPAR CBW 18

h. T – anchor point - model correction log COSPAR CBW 19

Analysis of Ne profile with O+/H+ transition height within plasmasphere. Ne fit O+ fit Sounder Ne Transition height H+ fit

Method to obtain h. T from Ne profiles Fitting Procedure to determine H+ and O+ from Ionospheric Topside Ne Profiles P. A. Webb, R. F. Benson, and J. M. Grebowsky, Radio Science, 2006 Assumes diffusive-equilibrium Uses electron temperature model (IRI) as an input Neglects density of He+ Least-square fit to Ne profiles to determine ion profiles and from them h. T Removed unsuccessful fits and fits with high normalized chi-squared values (>3)

Conclusions • Global models of ion composition included in IRI • These models include most important dependencies (on latitude, altitude, local time, and solar activity) • Only limited spatial resolution - up to 6 th of spherical harmonics in topside • More data is needed to better describe small scale features (anomalies, enhancements, troughs, longitudinal dependency etc. ) • Better description of parameters depending on solar/magnetic activity variation especially during period of current very different solar cycles from those which were known during previous decades • Real time updating might be possible if adequate real time data is available (FORMOSAT/COSMIC) COSPAR CBW 22
 Why do gases have low densities
 Material densities
 Fcc 100 plane
 Ejemplo de fuerza ion ion
 Dipolo dipolo inducido
 Dipolos instantaneos
 Dispersion forces
 Iri data library
 Panunuran
 Seasonal plants examples
 Iri construction
 Iri data library
 Cfs format
 Formal reading assessments
 Iri buz taneleri şeklinde yağan yağış biçimi nedir
 Iri measurement
 Iri data library
 Punto articulatorio fonema /rr
 Iri multi-model probability forecast for precipitation
 Pikas mal plus haus
 Lisa goddard iri
 Iri columbia seasonal forecast
 Iri cpt


