
REPETITIVE CROSSBORDER MERGERS ACQUISITIONS Amrita Nain Kyeong Lee
REPETITIVE CROSS-BORDER MERGERS & ACQUISITIONS Amrita Nain, Kyeong Lee, and Emma Xu 2014 LFE Workshop in Financial Economics Higher School of Economics, ICEF
Motivation Cross-border mergers and acquisitions (M&A) • Recent trend: • Total value of M&A is $2. 6 trillion • 36% is CBMA (Thompson Reuter, 2012) • Many complexities and risks • Cultural difference (Barkema et al. , 1996; Ahern et al. 2012) • Information environment (Louis, 2013) • Economic nationalism (Dixit, 2011; Dinc and Erel, 2013) • Law and regulation (Rossi and Volpin, 2004; Dikova et al. 2010)
Motivation Yet, many firms repeat cross-border deals in the same target country despite the risk and complexity. Why?

Unlike other papers, We examine SERIAL cross-border M&As. • The effect of firms’ repetitive deal making on deal structure and shareholder wealth. • Whether learning is induced from repetitive acquisitions in the same country. • Or managerial hubris?
Main findings As acquirers make more deals in the same country, • The time between successive deals declines • The percentage of ownership stake acquired increases • The percentage of cash payment increases Evidence of learning: • Where learning gains exist, • The time between deals declines more sharply and, • bidder announcement returns increase as they make more deals

Contributions • Learning in M&A • Repeat cross-border M&A is an ideal setup • What firms do in the face of risks in foreign countries? • Explain why many firms go back despite risks • The value of cross-border M&A • Bidder CAR can vary across different stages of learning
Data • Cross-border M&A deals between 50 countries during 1990 - 2010 • SDC: deal-specific information e. g. , announcement date, payment, etc. • Stock returns • CRSP for US firms • Datastream for non-US firms • Financial statement • Compustat for US firms • Datastream for non-US firms • Macro-level variables • Datastream MSCI: Stock market index returns • World Bank: GDP • Penn World Table: Currency
Empirical specification • Deal order number in the same target country (DONC) • Time between successive deals (TBD) • Percentage of ownership stake acquired • Percentage of consideration paid in cash • Bidder announcement returns
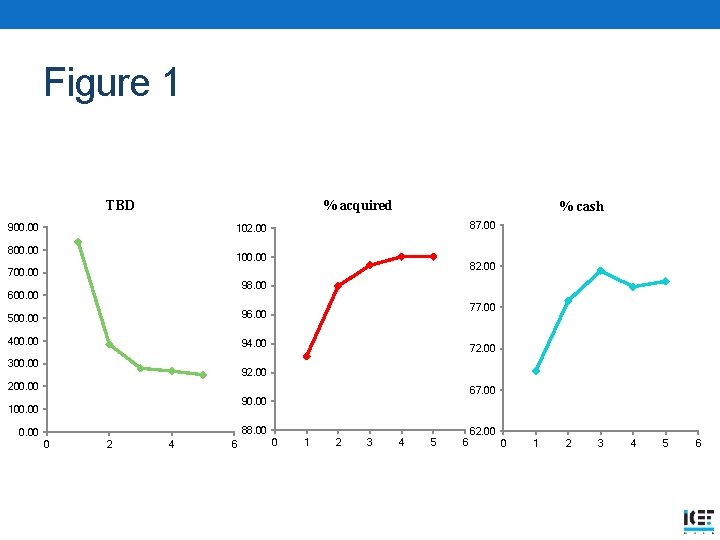
Figure 1 % acquired TBD 900. 00 % cash 87. 00 102. 00 800. 00 100. 00 82. 00 700. 00 98. 00 600. 00 500. 00 96. 00 400. 00 94. 00 300. 00 77. 00 72. 00 92. 00 200. 00 67. 00 90. 00 100. 00 88. 00 0 2 4 6 0 1 2 3 4 5 6 62. 00 0 1 2 3 4 5 6
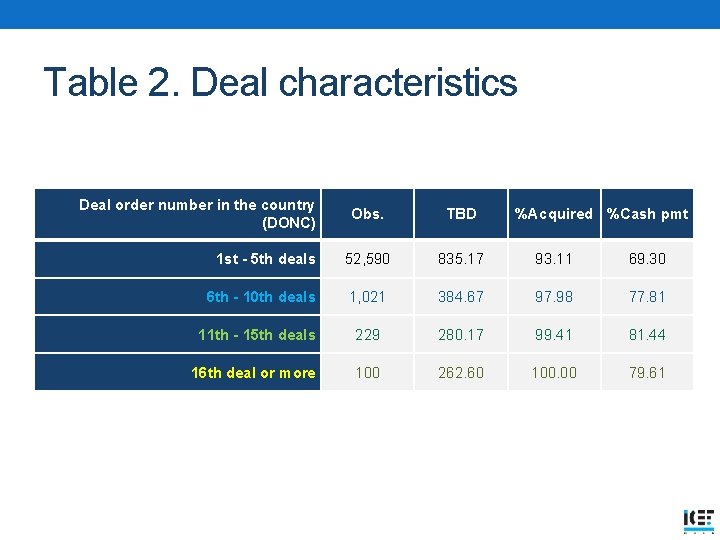
Table 2. Deal characteristics Deal order number in the country (DONC) Obs. TBD %Acquired %Cash pmt 1 st - 5 th deals 52, 590 835. 17 93. 11 69. 30 6 th - 10 th deals 1, 021 384. 67 97. 98 77. 81 11 th - 15 th deals 229 280. 17 99. 41 81. 44 16 th deal or more 100 262. 60 100. 00 79. 61
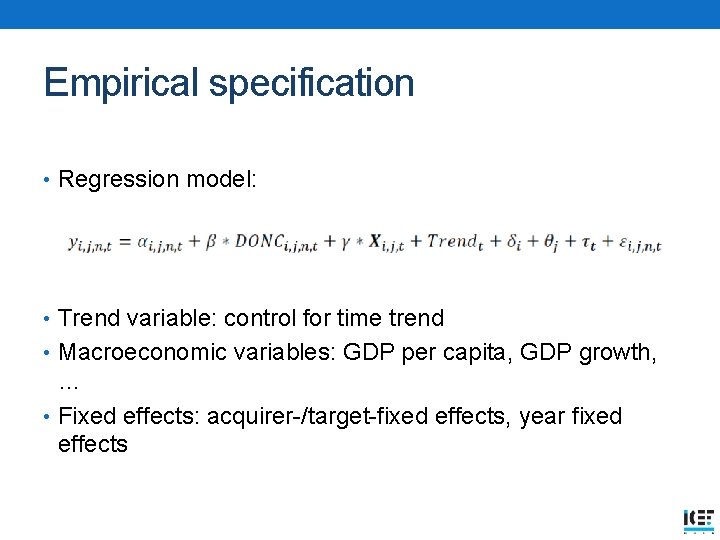
Empirical specification • Regression model: • Trend variable: control for time trend • Macroeconomic variables: GDP per capita, GDP growth, … • Fixed effects: acquirer-/target-fixed effects, year fixed effects
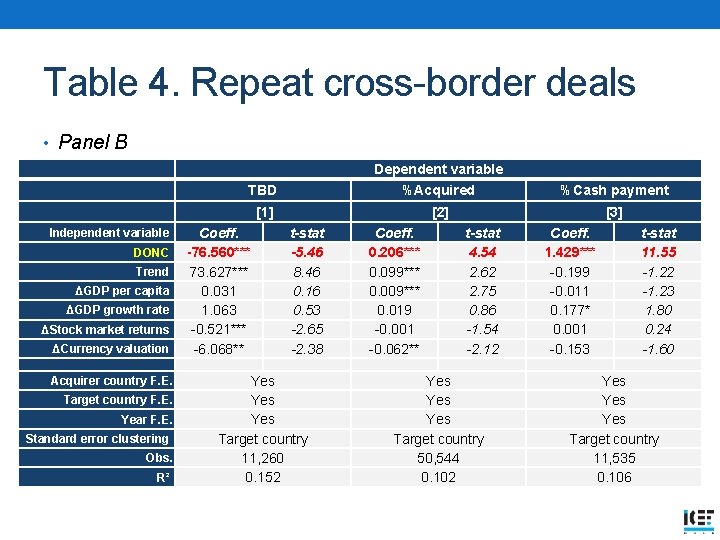
Table 4. Repeat cross-border deals • Panel B TBD Dependent variable %Acquired %Cash payment [1] [2] [3] Coeff. DONC -76. 560*** Trend 73. 627*** ΔGDP per capita 0. 031 ΔGDP growth rate 1. 063 ΔStock market returns -0. 521*** ΔCurrency valuation -6. 068** Independent variable Acquirer country F. E. Target country F. E. Year F. E. Standard error clustering Obs. R² t-stat -5. 46 8. 46 0. 16 0. 53 -2. 65 -2. 38 Yes Yes Target country 11, 260 0. 152 Coeff. 0. 206*** 0. 099*** 0. 009*** 0. 019 -0. 001 -0. 062** t-stat 4. 54 2. 62 2. 75 0. 86 -1. 54 -2. 12 Yes Yes Target country 50, 544 0. 102 Coeff. 1. 429*** -0. 199 -0. 011 0. 177* 0. 001 -0. 153 t-stat 11. 55 -1. 22 -1. 23 1. 80 0. 24 -1. 60 Yes Yes Target country 11, 535 0. 106
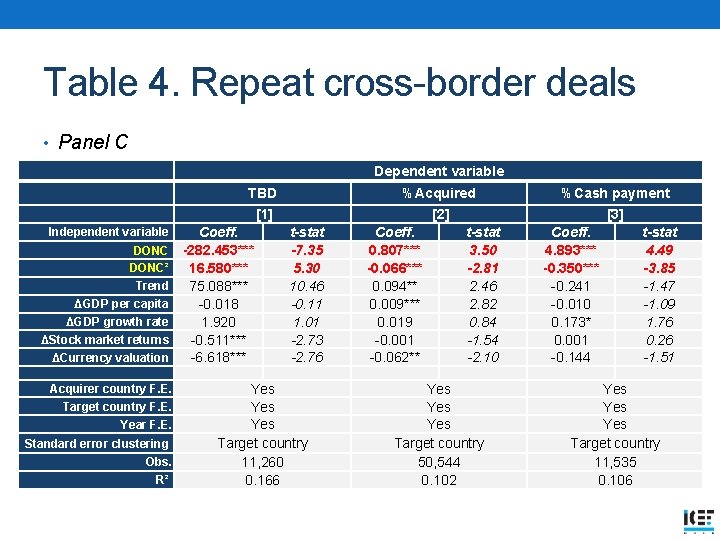
Table 4. Repeat cross-border deals • Panel C Dependent variable TBD [1] Independent variable DONC² Trend ΔGDP per capita ΔGDP growth rate ΔStock market returns ΔCurrency valuation Acquirer country F. E. Target country F. E. Year F. E. Standard error clustering Obs. R² Coeff. -282. 453*** 16. 580*** 75. 088*** -0. 018 1. 920 -0. 511*** -6. 618*** t-stat -7. 35 5. 30 10. 46 -0. 11 1. 01 -2. 73 -2. 76 Yes Yes Target country 11, 260 0. 166 %Acquired [2] Coeff. t-stat 0. 807*** 3. 50 -0. 066*** -2. 81 0. 094** 2. 46 0. 009*** 2. 82 0. 019 0. 84 -0. 001 -1. 54 -0. 062** -2. 10 Yes Yes Target country 50, 544 0. 102 %Cash payment [3] Coeff. t-stat 4. 893*** 4. 49 -0. 350*** -3. 85 -0. 241 -1. 47 -0. 010 -1. 09 0. 173* 1. 76 0. 001 0. 26 -0. 144 -1. 51 Yes Yes Target country 11, 535 0. 106
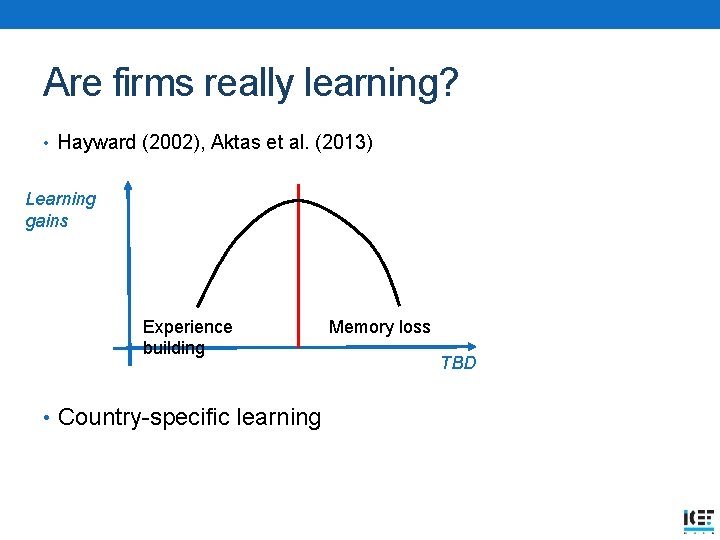
Are firms really learning? • Hayward (2002), Aktas et al. (2013) Learning gains Experience building • Country-specific learning Memory loss TBD
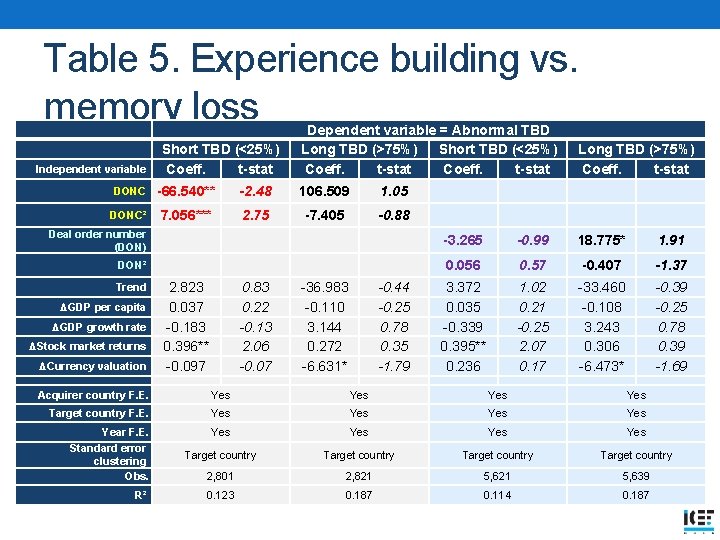
Table 5. Experience building vs. memory loss Independent variable Short TBD (<25%) Coeff. t-stat Dependent variable = Abnormal TBD Long TBD (>75%) Short TBD (<25%) Coeff. t-stat DONC -66. 540** -2. 48 106. 509 1. 05 DONC² 7. 056*** 2. 75 -7. 405 -0. 88 Long TBD (>75%) Coeff. t-stat Deal order number (DON) -3. 265 -0. 99 18. 775* 1. 91 DON² 0. 056 0. 57 -0. 407 -1. 37 3. 372 0. 035 -0. 339 0. 395** 0. 236 1. 02 0. 21 -0. 25 2. 07 0. 17 -33. 460 -0. 108 3. 243 0. 306 -6. 473* -0. 39 -0. 25 0. 78 0. 39 -1. 69 Trend ΔGDP per capita ΔGDP growth rate ΔStock market returns ΔCurrency valuation 2. 823 0. 037 -0. 183 0. 396** -0. 097 0. 83 0. 22 -0. 13 2. 06 -0. 07 -36. 983 -0. 110 3. 144 0. 272 -6. 631* -0. 44 -0. 25 0. 78 0. 35 -1. 79 Acquirer country F. E. Yes Yes Target country F. E. Yes Yes Year F. E. Standard error clustering Obs. Yes Yes Target country 2, 801 2, 821 5, 639 0. 123 0. 187 0. 114 0. 187 R²
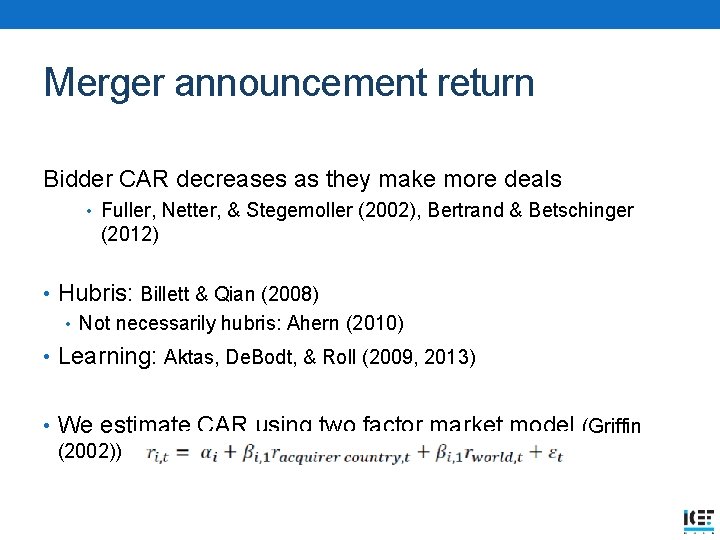
Merger announcement return Bidder CAR decreases as they make more deals • Fuller, Netter, & Stegemoller (2002), Bertrand & Betschinger (2012) • Hubris: Billett & Qian (2008) • Not necessarily hubris: Ahern (2010) • Learning: Aktas, De. Bodt, & Roll (2009, 2013) • We estimate CAR using two factor market model (Griffin (2002))
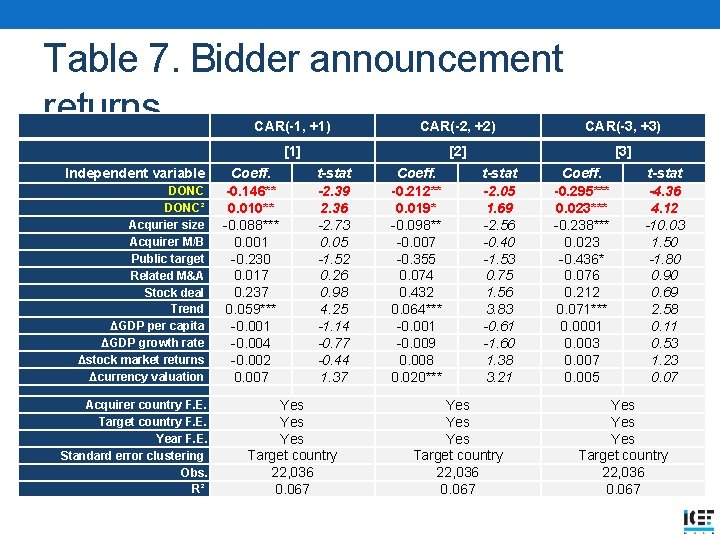
Table 7. Bidder announcement returns Independent variable DONC² Acqurier size Acquirer M/B Public target Related M&A Stock deal Trend ΔGDP per capita ΔGDP growth rate Δstock market returns Δcurrency valuation Acquirer country F. E. Target country F. E. Year F. E. Standard error clustering Obs. R² CAR(-1, +1) CAR(-2, +2) CAR(-3, +3) [1] [2] [3] Coeff. -0. 146** 0. 010** -0. 088*** 0. 001 -0. 230 0. 017 0. 237 0. 059*** -0. 001 -0. 004 -0. 002 0. 007 t-stat -2. 39 2. 36 -2. 73 0. 05 -1. 52 0. 26 0. 98 4. 25 -1. 14 -0. 77 -0. 44 1. 37 Yes Yes Target country 22, 036 0. 067 Coeff. -0. 212** 0. 019* -0. 098** -0. 007 -0. 355 0. 074 0. 432 0. 064*** -0. 001 -0. 009 0. 008 0. 020*** t-stat -2. 05 1. 69 -2. 56 -0. 40 -1. 53 0. 75 1. 56 3. 83 -0. 61 -1. 60 1. 38 3. 21 Yes Yes Target country 22, 036 0. 067 Coeff. -0. 295*** 0. 023*** -0. 238*** 0. 023 -0. 436* 0. 076 0. 212 0. 071*** 0. 0001 0. 003 0. 007 0. 005 t-stat -4. 36 4. 12 -10. 03 1. 50 -1. 80 0. 90 0. 69 2. 58 0. 11 0. 53 1. 23 0. 07 Yes Yes Target country 22, 036 0. 067
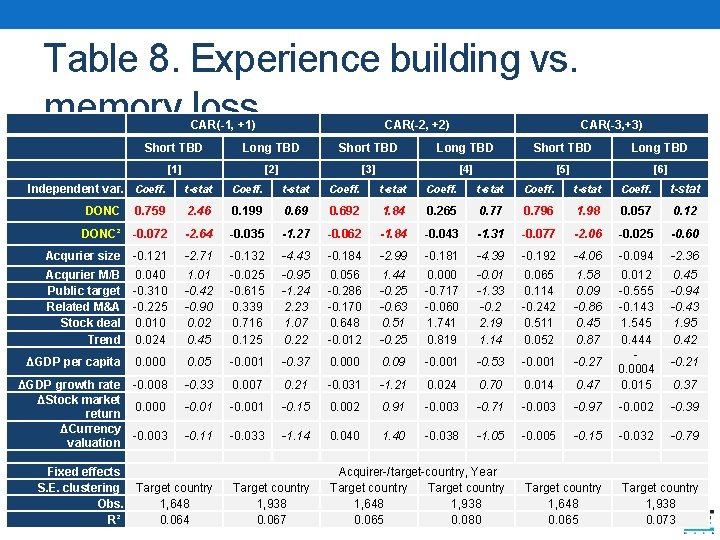
Table 8. Experience building vs. memory loss CAR(-1, +1) CAR(-2, +2) CAR(-3, +3) Short TBD Long TBD [1] [2] [3] [4] [5] [6] Independent var. Coeff. t-stat DONC 0. 759 2. 46 0. 199 0. 692 1. 84 0. 265 0. 77 0. 796 1. 98 0. 057 0. 12 DONC² -0. 072 -2. 64 -0. 035 -1. 27 -0. 062 -1. 84 -0. 043 -1. 31 -0. 077 -2. 06 -0. 025 -0. 60 Acqurier size -0. 121 -2. 71 -0. 132 -4. 43 -0. 184 -2. 99 -0. 181 -4. 39 -0. 192 -4. 06 -0. 094 -2. 36 Acqurier M/B Public target Related M&A Stock deal Trend 0. 040 -0. 310 -0. 225 0. 010 0. 024 1. 01 -0. 42 -0. 90 0. 02 0. 45 -0. 025 -0. 615 0. 339 0. 716 0. 125 -0. 95 -1. 24 2. 23 1. 07 0. 22 0. 056 -0. 286 -0. 170 0. 648 -0. 012 1. 44 -0. 25 -0. 63 0. 51 -0. 25 0. 000 -0. 717 -0. 060 1. 741 0. 819 -0. 01 -1. 33 -0. 2 2. 19 1. 14 0. 065 0. 114 -0. 242 0. 511 0. 052 1. 58 0. 09 -0. 86 0. 45 0. 87 0. 45 -0. 94 -0. 43 1. 95 0. 42 ΔGDP per capita 0. 000 0. 05 -0. 001 -0. 37 0. 000 0. 09 -0. 001 -0. 53 -0. 001 -0. 27 ΔGDP growth rate -0. 008 ΔStock market 0. 000 return ΔCurrency -0. 003 valuation -0. 33 0. 007 0. 21 -0. 031 -1. 21 0. 024 0. 70 0. 014 0. 47 0. 012 -0. 555 -0. 143 1. 545 0. 444 0. 0004 0. 015 -0. 01 -0. 001 -0. 15 0. 002 0. 91 -0. 003 -0. 71 -0. 003 -0. 97 -0. 002 -0. 39 -0. 11 -0. 033 -1. 14 0. 040 1. 40 -0. 038 -1. 05 -0. 005 -0. 15 -0. 032 -0. 79 Fixed effects S. E. clustering Target country Obs. 1, 648 R² 0. 064 Target country 1, 938 0. 067 Acquirer-/target-country, Year Target country 1, 648 1, 938 0. 065 0. 080 Target country 1, 648 0. 065 -0. 21 0. 37 Target country 1, 938 0. 073
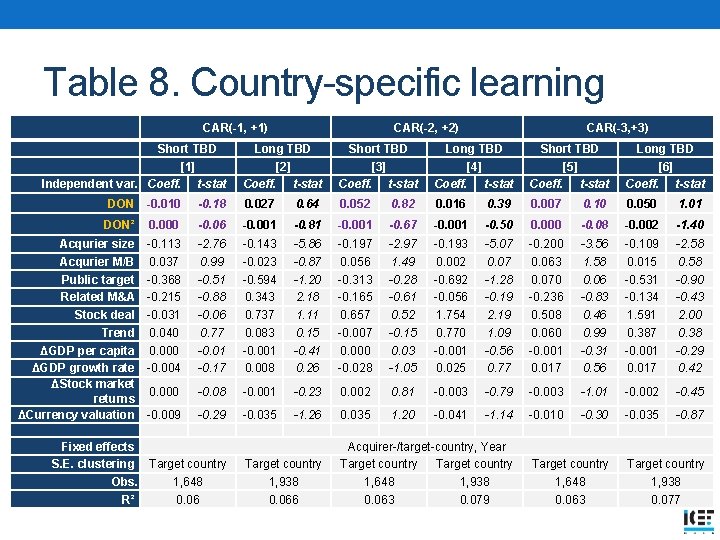
Table 8. Country-specific learning CAR(-1, +1) Short TBD [1] Independent var. Coeff. t-stat DON -0. 010 CAR(-2, +2) CAR(-3, +3) Long TBD [2] Coeff. t-stat Short TBD [3] Coeff. t-stat Long TBD [4] Coeff. t-stat Short TBD [5] Coeff. t-stat Long TBD [6] Coeff. t-stat -0. 18 0. 027 0. 64 0. 052 0. 82 0. 016 0. 39 0. 007 0. 10 0. 050 1. 01 DON² 0. 000 -0. 06 -0. 001 -0. 81 -0. 001 -0. 67 -0. 001 -0. 50 0. 000 -0. 08 -0. 002 -1. 40 Acqurier size Acqurier M/B Public target Related M&A Stock deal Trend ΔGDP per capita ΔGDP growth rate ΔStock market returns ΔCurrency valuation -0. 113 0. 037 -0. 368 -0. 215 -0. 031 0. 040 0. 000 -0. 004 -2. 76 0. 99 -0. 51 -0. 88 -0. 06 0. 77 -0. 01 -0. 17 -0. 143 -0. 023 -0. 594 0. 343 0. 737 0. 083 -0. 001 0. 008 -5. 86 -0. 87 -1. 20 2. 18 1. 11 0. 15 -0. 41 0. 26 -0. 197 0. 056 -0. 313 -0. 165 0. 657 -0. 007 0. 000 -0. 028 -2. 97 1. 49 -0. 28 -0. 61 0. 52 -0. 15 0. 03 -1. 05 -0. 193 0. 002 -0. 692 -0. 056 1. 754 0. 770 -0. 001 0. 025 -5. 07 0. 07 -1. 28 -0. 19 2. 19 1. 09 -0. 56 0. 77 -0. 200 0. 063 0. 070 -0. 236 0. 508 0. 060 -0. 001 0. 017 -3. 56 1. 58 0. 06 -0. 83 0. 46 0. 99 -0. 31 0. 56 -0. 109 0. 015 -0. 531 -0. 134 1. 591 0. 387 -0. 001 0. 017 -2. 58 0. 58 -0. 90 -0. 43 2. 00 0. 38 -0. 29 0. 42 0. 000 -0. 08 -0. 001 -0. 23 0. 002 0. 81 -0. 003 -0. 79 -0. 003 -1. 01 -0. 002 -0. 45 -0. 009 -0. 29 -0. 035 -1. 26 0. 035 1. 20 -0. 041 -1. 14 -0. 010 -0. 30 -0. 035 -0. 87 Fixed effects S. E. clustering Target country Obs. 1, 648 R² 0. 06 Target country 1, 938 0. 066 Acquirer-/target-country, Year Target country 1, 648 1, 938 0. 063 0. 079 Target country 1, 648 0. 063 Target country 1, 938 0. 077
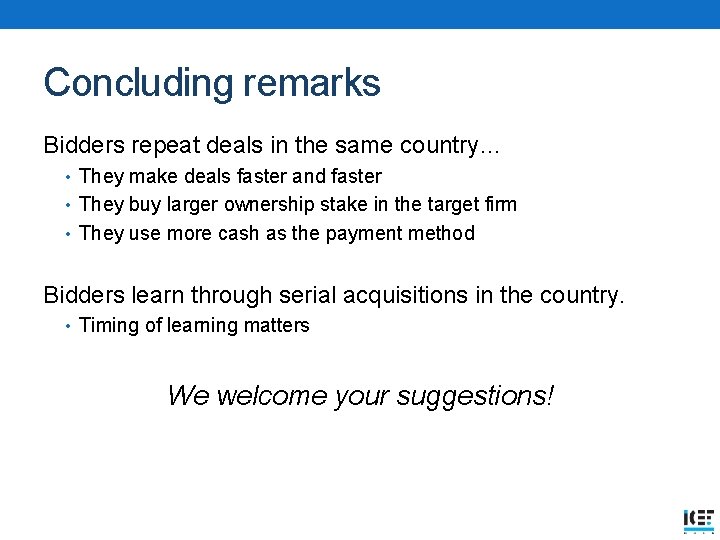
Concluding remarks Bidders repeat deals in the same country… • They make deals faster and faster • They buy larger ownership stake in the target firm • They use more cash as the payment method Bidders learn through serial acquisitions in the country. • Timing of learning matters We welcome your suggestions!
- Slides: 20