RENEWABLE ENERGY AS Source Of Clean Electrical Generation

RENEWABLE ENERGY AS Source Of Clean Electrical Generation By Prof. Mohamed A. H. El-Sayed

World Electricity Consumption 2003 -2030

World CO 2 Emission

Challenges l l l Increase amount of CO 2 as a result of fossil fuel combustion. Doubling CO 2 content in atmosphere leads to temperature rise of 4. 5 o C The fossil fuel world economy has 2 C/C: -Fossil fuel resources are finite and run out in 40 a. -Reserves of fossil fuels are found at limited number of location and require transmission to load centers.

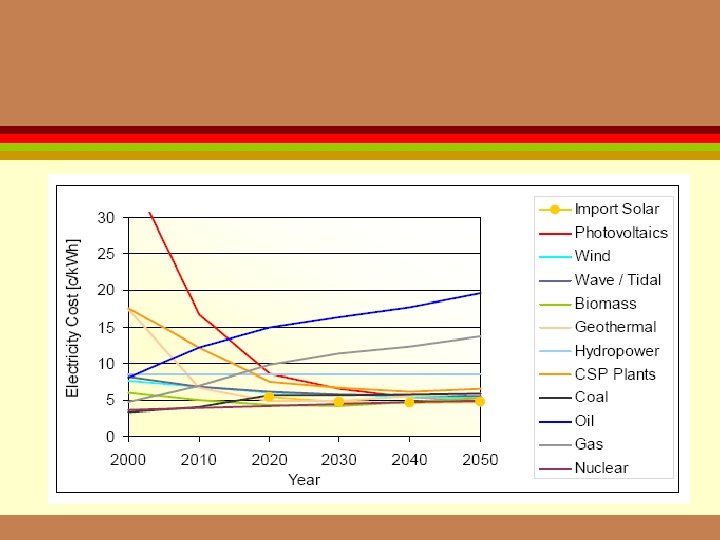
Alternatives to Fossil Fuels l The alternatives to fossil fuels are renewable energy including: • Solar energy • Wind energy • Fuel cells l l Shell’s study indicated that half of the world’s energy need in year 2050 will be supplied by renewable resources. Therefore, a lot of R&D work still remains to be done in this area such as cost reduction, efficient and optimal mode of operation.

Development of cumulative PV Power
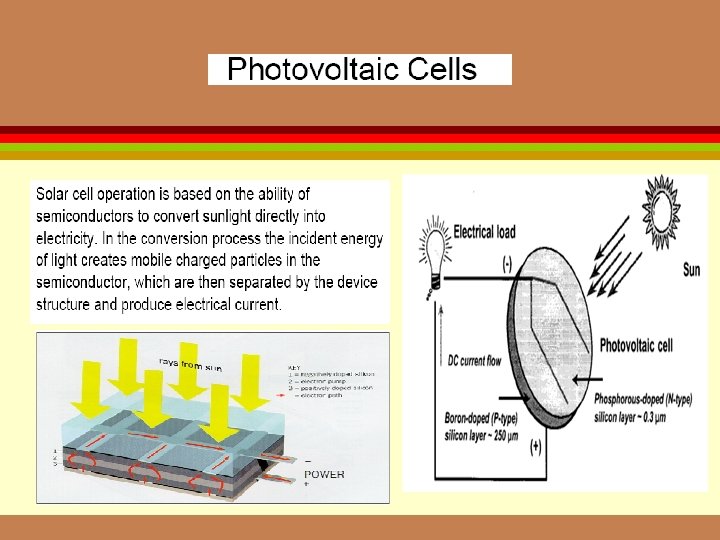

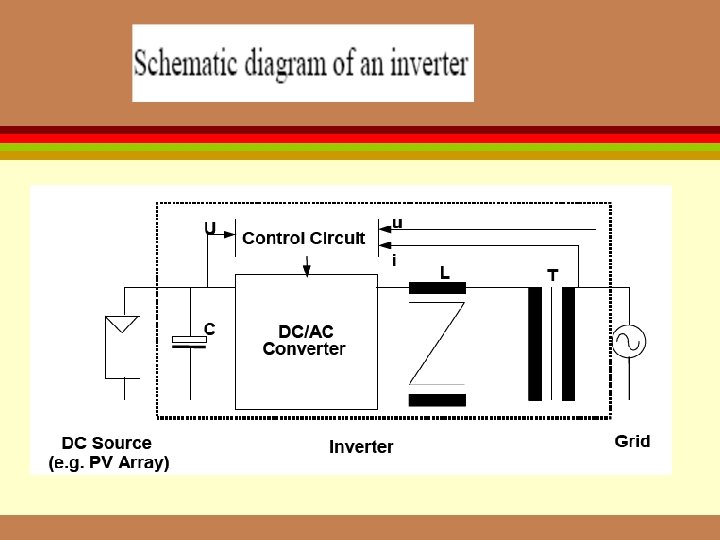
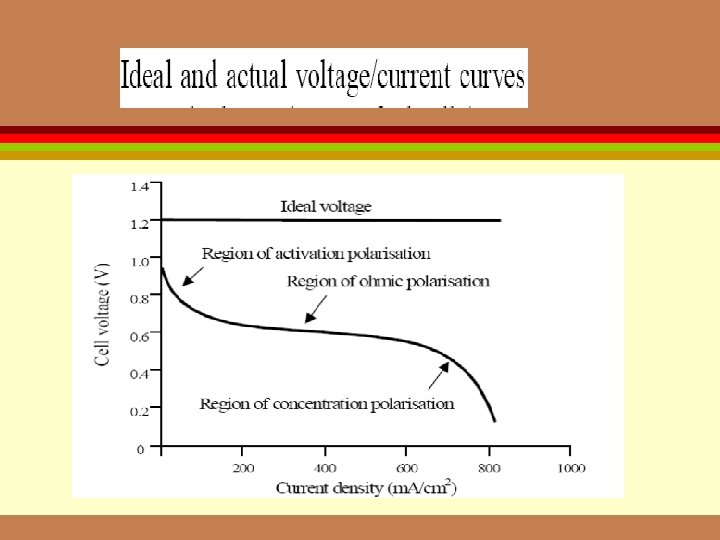
Equivalent Circuit for PV Cell

Maximum point tracking Using ANN

Basic Structure of FLC

Proposed digital MPP Control

Membership Functions

Rule Base of FLC

γ Performance with FLC

Power Performance with FLC

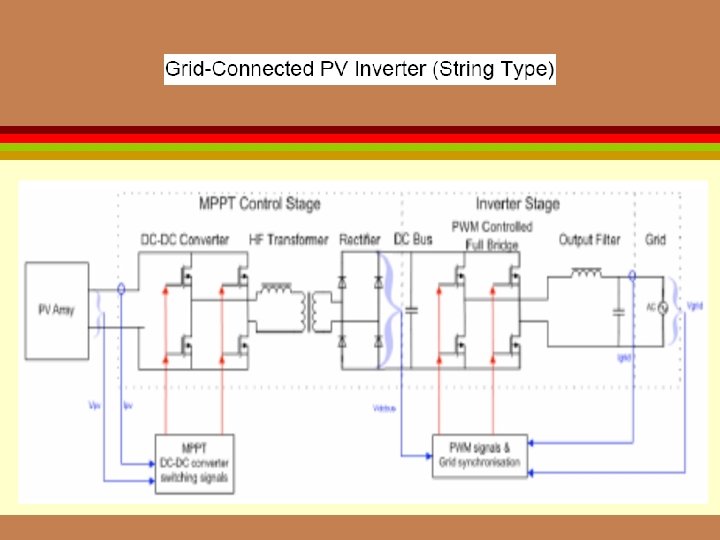
Basic Configuration of PV/Grid Energy System
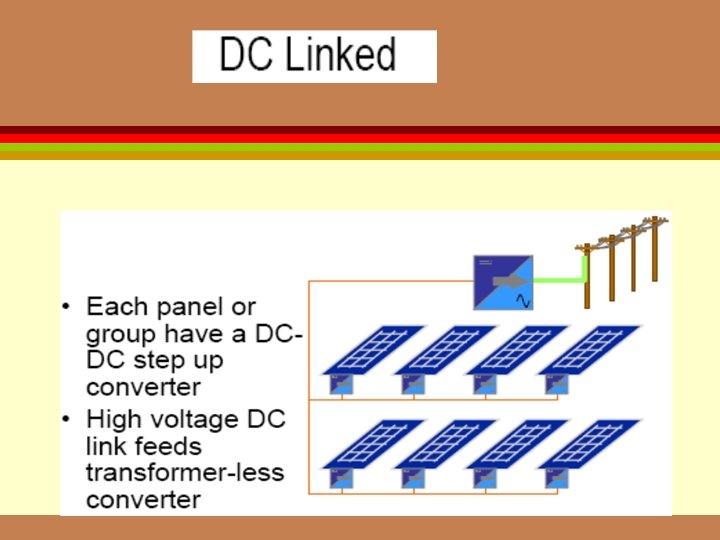
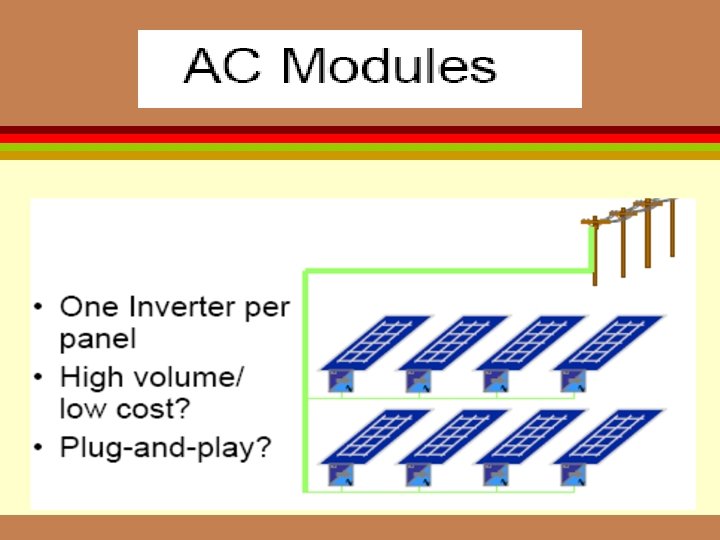
 • Multiple Small")
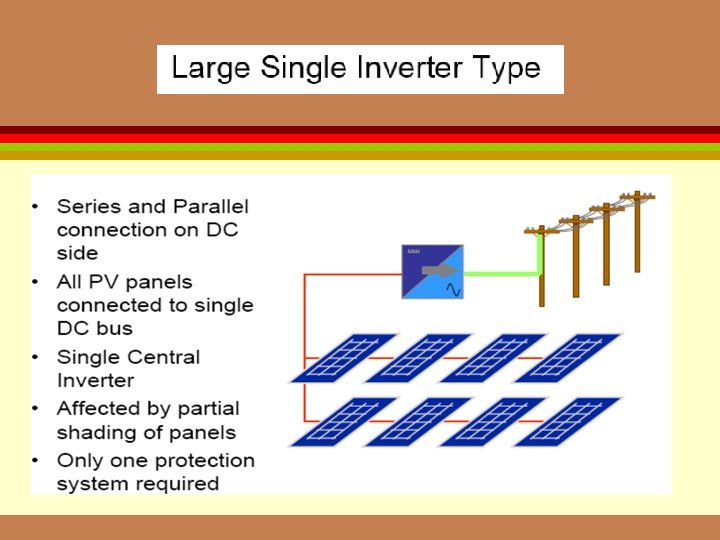
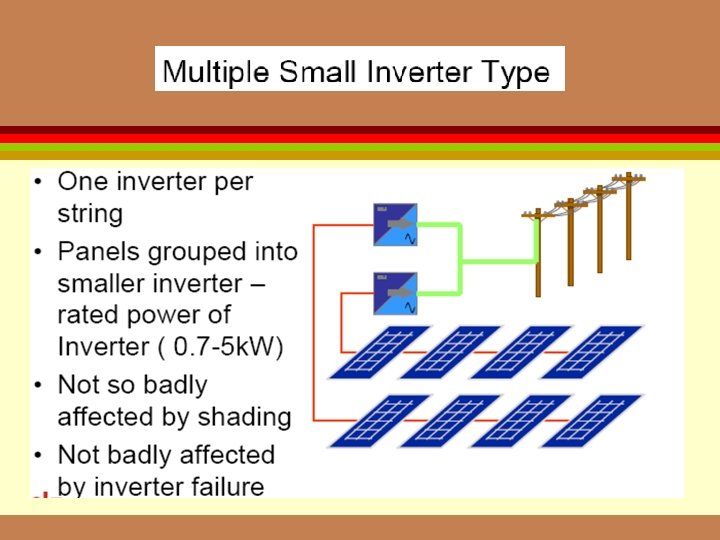
PV/Grid Energy System Configurations • Large Single Inverter Type (Central Inverter) • Multiple Small Inverter Type (String Inverter) • DC Bus (Multi-string Inverter) • “AC” Module
")
PV Applications in Egypt (5 MW)

Solar Thermal Generation

Solar Thermal Generation

Kuraymat Hybrid Solar Thermal Plant l l l The project site 90 km south Cairo 2 x 150 MW An uninhabited flat desert land. High intensity direct solar radiation reaches to 2400 k. Wh /m 2 / year. An extended unified power grid and expanded natural gas pipelines. Near to the sources of water.

Hybrid Solar Combined Plant

Solar Field l l The total area of the solar collectors is about 130000 m 2 tracking the sun from east to west while rotating on a northsouth axis. A heat transfer fluid (HTF), (typically synthetic oil) heated to a temperature up to 400 o. C. The fluid is pumped to a heat exchanger to generate steam introducing it to the Steam Turbine (ST) to generate electricity.

Power Block. Combined Cycle power plant consists of : -Two natural gas Turbines of about 41. 5 MW -Two Heat Recovery Steam Generators. -One steam turbine of about 68 MW. -Cooling system
 Capacity of gas turbine (MW) Capacity of")
Technical Design Capacity of Solar portion (MW) Capacity of gas turbine (MW) Capacity of steam turbine (MW) Net electric energy (GWh/a) Solar generation (GWh/a) 30 2 X 41. 5 68 985 65 Solar share(%) Fuel saving (T. O. E / a) CO 2 reduction (T / a) 6. 6 14000 38000

Wind Energy Advantages: -Clean source of Energy. -Lowest-priced renewable technologies 4 to 6 cent/k. Wh. Disadvantages: -Noise produced by the rotor blades. -Birds have been killed by flying into the rotors. These problems have been resolved by properly sitting wind plants.

Rabid Growth of Wind Capacity

Horizontal- Vertical-axis turbines

Wind Turbines Type of Wind Turbines: - - -Most of Wind turbines being used today are horizontal-axis type. -Horizontal-axis wind turbines typically either have two or three blades. -Utility-scale turbines range in size from 100 k. W to several MW. -Larger turbines are grouped together into wind farm, which provide bulk power to electrical grid.

Wind Turbines

Development of Horizontal Axis Wind Turbine

Wind Power Calculation. Available power Power coefficient Tip-speed ratio Wind speed changes Generator speed has to be changed from 1000 to 2000 rpm from 7 to 13 m/s

Wind Energy Conversion System
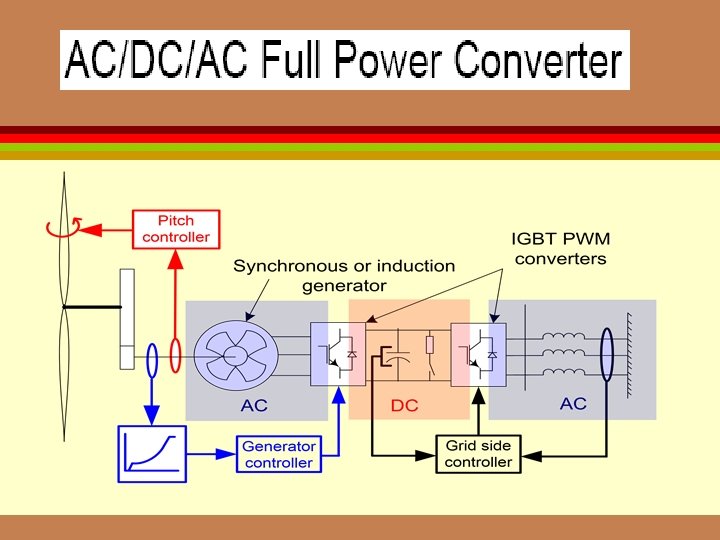

Variable speed Double Fed IG


Wind Atlas of Egypt

Wind Speed of Zafarana in Egypt
 -Average Wind Speed (M/s) -Firm")
Technical Indicators of 2003/2004 Zafarana Wind Farm (140 MW) -Average Wind Speed (M/s) -Firm Capacity Factor (%) -Availability Factor (%) -Generated Electricity/year (GWh) -Fuel Saving (Thou. Ton) -CO 2 Reduction (Thou. Ton) 9 43 98. 8 378 82 204

NREA’ site at Zafarana

Wind Energy Plan in Egypt

Long Term Wind Energy Plan in EGYPT
 300 600 900 (MW)")
Substitution Capacity of Wind Energy WTGs Conv. Cap. Subs. (MW) 300 600 900 (MW) 150 260 347
 = Cumulative probability of X")
Impact of wind energy on system reliability Where: CPROBold(X) = Cumulative probability of X MW on outage for the existing table CPROBNEW(X) = Cumulative probability of X MW on outage for the new table

Reliability Indices yearly EENS=

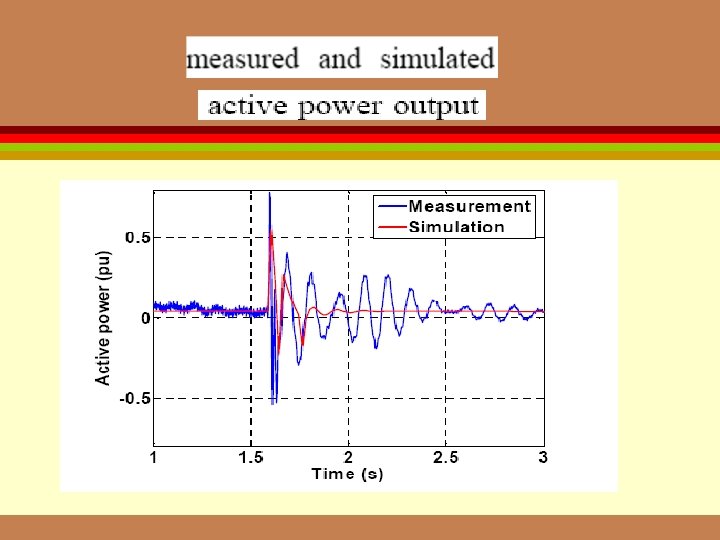
Frequency Response due to Wind Farm Outage

Saved Natural Gas and CO 2
")
Cost Analysis of Wind Farm (Environment as driving factor)

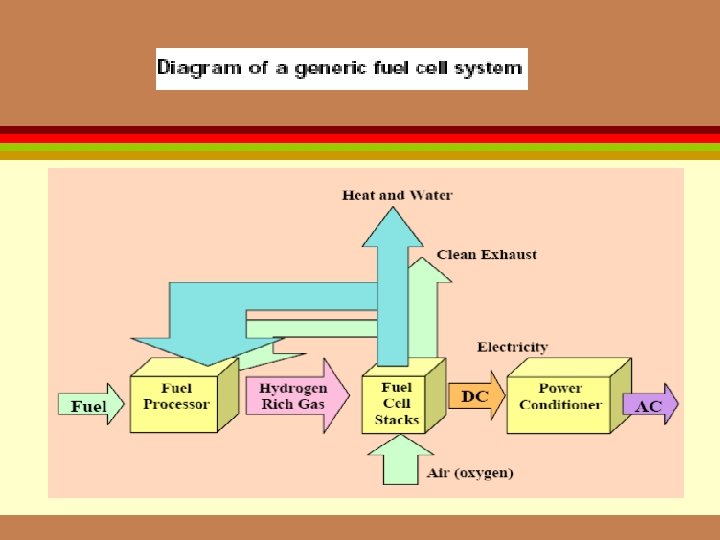
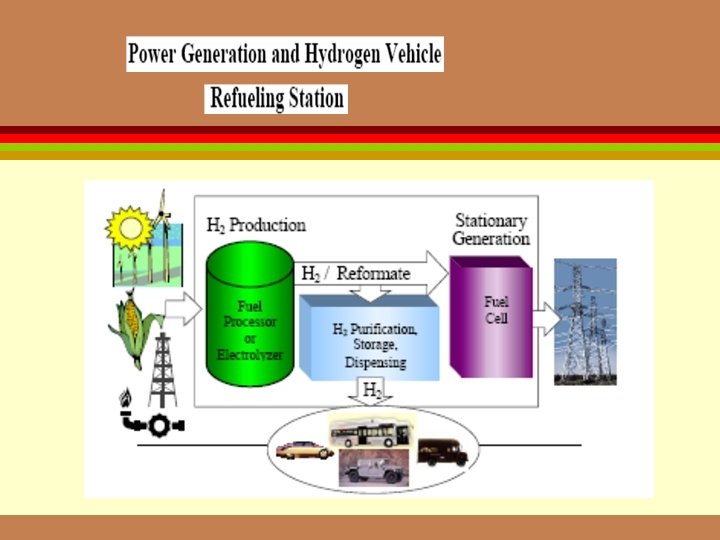
Fuel Cells as Future generation of Electrical Energy l l l Fuel cells are electrochemical devices, which efficiently convert energy in a hydrocarbon fuel directly into electricity without prior combustion and with no moving parts. The process is the opposite of electrolysis. Most fuel cells operate on hydrogen and oxygen.

What is a Fuel Cell?

Fuel Cell Stack

Main Advantages of FC l Compared to ICE’s • • • l High efficiencies. . Silent operation Low or nonexistent emissions Fuel Cells have excellent partial-load characteristics No moving mechanical parts less wear & long lifetimes. (more than 40, 000 hours). Compared to Batteries • • Significantly greater energy density. Instant refilling

Fuel Cell Types

FC Progress

FC as Stationary Power supply

Proposed FC control of Transportation System Power System of the Fuel Cell Control Valve H 2 Tank O 2 Tank PEM Fuel Cell DC power PWM Inverter Control System (FLC or PI controller) AC power Induction Motor Mechanical power

Simulation of PEM FC

V-I Characteristics at different pressure

V-I Characteristic at Different Temperature

PI-Controller The input signal to PI is error desired load power PL load power PI output control signal for control valve Vc.

Membership Functions of FLC

Rule Base for FLC e e NB NM NS ZE PS PM PB NB NB NM NS ZE NB NB NB NM NS ZE PS NB NB NB NS ZE PS PM NB NM NS ZE PS PM PB PB PB PB

Response of the output power
 0. 49 0. 41")
Comparison between PI-FLC Controller Spec. PI FLC Rise Time (s) 0. 49 0. 41 Settling time (s) 2. 3 1. 5 Max Overshoot (%) 28 16 Integral error square 6. 2 E 8 4. 6 E 8

Comparison bet. FC and Diesel using Homer Simulation Model
 NG(MCF/d) Barbados")
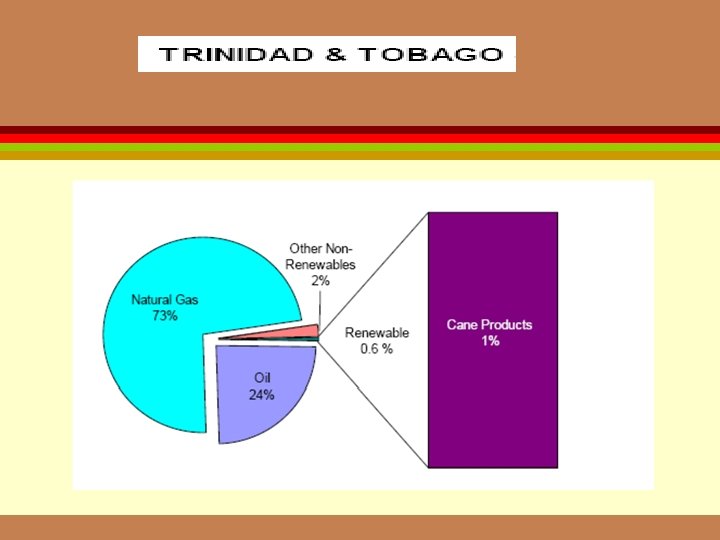
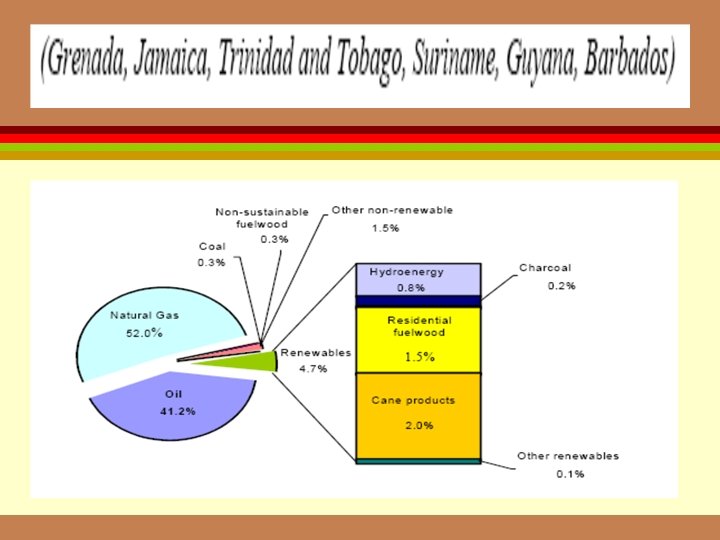
TT Greatest producer of Oil & NG in Caribbean Region Production Oil(b/d) NG(MCF/d) Barbados 1000 9. 5 Cuba 30000 14. 5 TT 129000 3087 -----------------------------------TT gas intensive industries such as steel, fertilizer and Petrochemicals
")
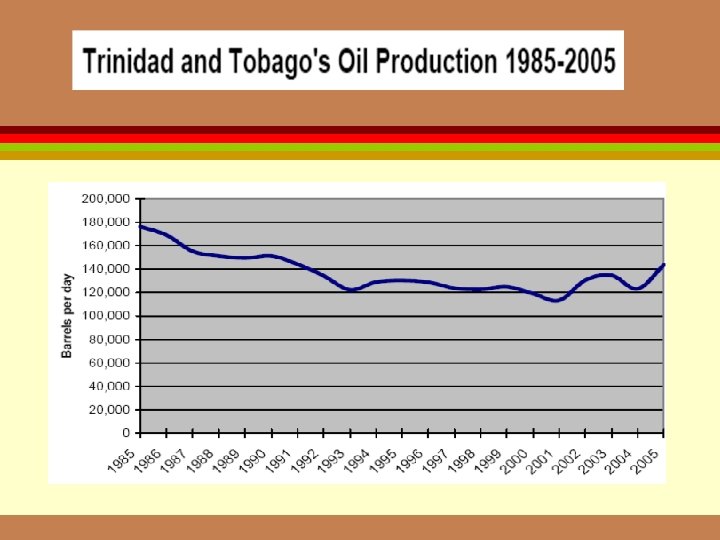
Gas Production in Trinidad and Tobago (2005)

Renewable Energy in Trinidad and Tobago >PM Patrick Manning stated: Alternative energy is a question that we are going to consider in future. ØPilot project to introduce solar heating systems in tourism (Host Home) sector (1/2006 -4/2008). Ø Research projects for developing polymer electrolyte membranes for PEM-FC and direct methanol DMFC. ØResearch Projects to develop lithium battery electrolyte material.

Wind Energy Research Requirements in Trinidad and Tobago

Solar Energy Research Requirements in Trinidad and Tobago >National Policies that will promote use of solar heaters >Funding programs that will promote the use of solar crop dryers and solar pumps for irrigation. ØDecision by utility companies to use solar energy when best suited e. g. . street lighting

Related PS Research Areas Distribution Network Planning: -Upgrade existing Network With DG -Invest in DG using Renewable Energy Stochastic Generation Planning in free market: -Uncertain input data by unit commitment -Probabilistic Scenario Tree

Modeling of Distribution Network Modeling of distribution network Complete model of distribution network containing DG DG optimal size & site from an investment point of view Modeling of DG Optimization technique (SQP)
 Wind Gen. Photovoltaic Fuel cell (PV bus)")
Distributed Generators DG type DG size (MW) Wind Gen. Photovoltaic Fuel cell (PV bus) 2 0. 5 0. 4 Microturbine (PQ bus) 0. 5

Comparison between different scenarios

Microgrid Benefits -Improved Power reliability and Quality -Ability to allow high penetration of renewable generation. -T&D support in Distribution areas. -Emission reduction compared to centralized utility. -Economic potential and high efficiency.

Uncertainties in Optimization Process

Discretization of Distribution Function

Probability Time Dependence Tree

Conditional Value at Risk

Distribution Function of Contribution

Stochastic Planning and Risk Management -Stochastic multi-Stage optimization represents an efficient technique for considering uncertainties in generation and trading planning. -A second integrated risk management shall plan the generation and trading and manage the risks at the same time.

THANK YOU
- Slides: 103