
Rene De Vaughn Professional Communications Class 5 Chapter
- Slides: 20
Reneé De. Vaughn Professional Communications Class 5 - Chapter 12 Presentation July 9, 2012
Designing Visual Communication 2 2
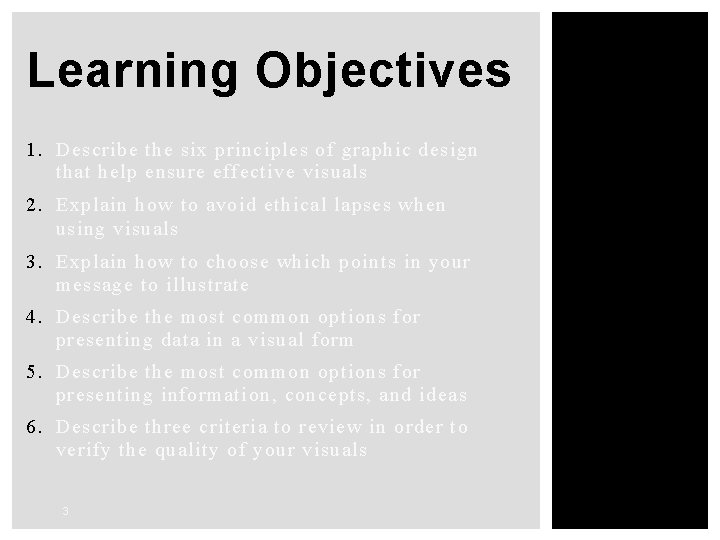
Learning Objectives 1. Describe the six principles of graphic design that help ensure effective visuals 2. Explain how to avoid ethical lapses when using visuals 3. Explain how to choose which points in your message to illustrate 4. Describe the most common options for presenting data in a visual form 5. Describe the most common options for presenting information, concepts, and ideas 6. Describe three criteria to review in order to verify the quality of your visuals 3 3
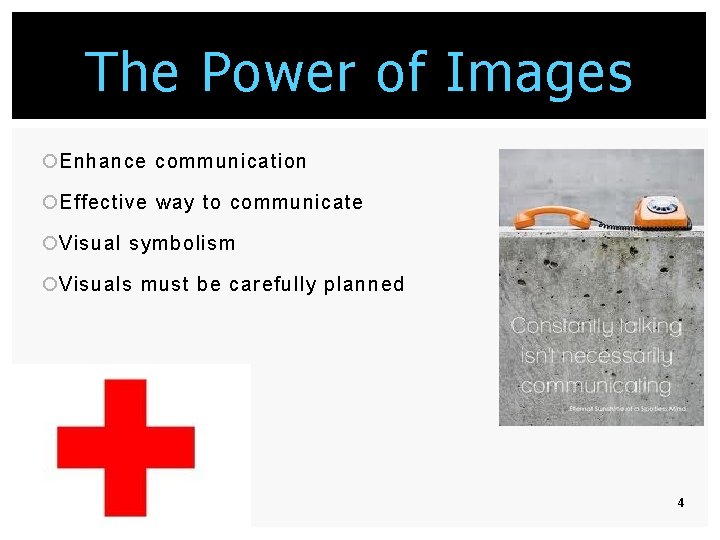
The Power of Images ¡Enhance communication ¡Effective way to communicate ¡Visual symbolism ¡Visuals must be carefully planned 4
Visual Evolution ¡Advances in technology ¡Global reach of the internet ¡Wireless networking ¡Changes that will affect communication ¡Visual literacy 5
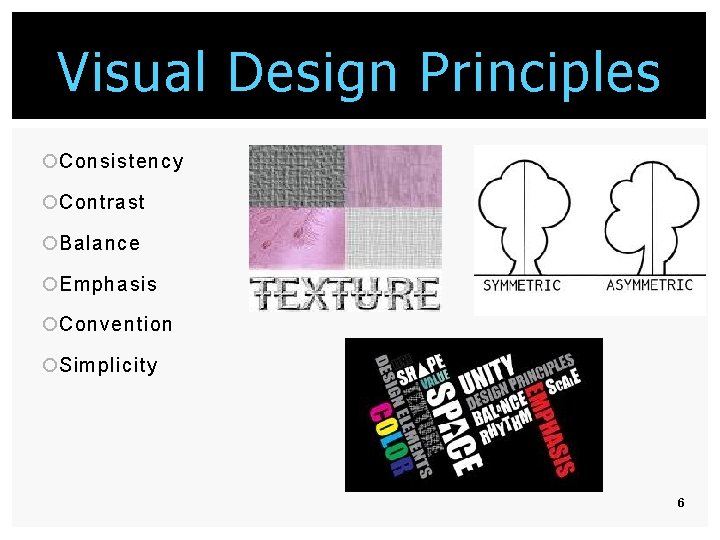
Visual Design Principles ¡Consistency ¡Contrast ¡Balance ¡Emphasis ¡Convention ¡Simplicity 6
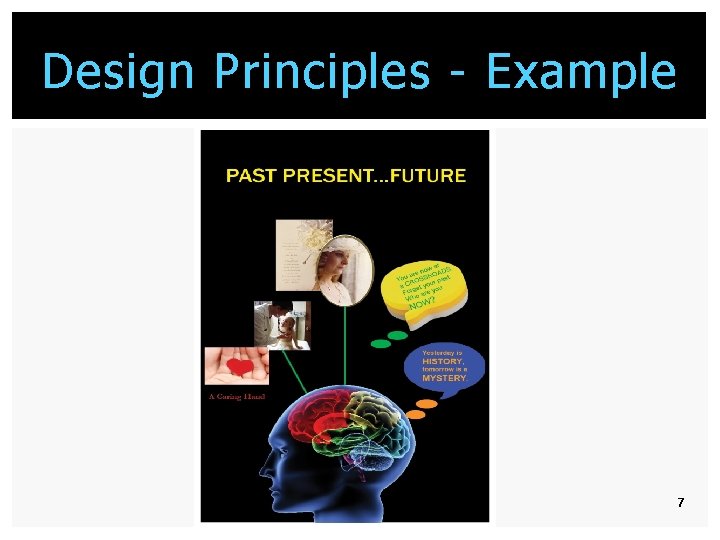
Design Principles - Example 7
Visual Communication Ethics § Consider all interpretations - misinterpretations § Provide content § Don’t hide or minimize negative information § Don’t oversimplify complex situations § Don’t imply cause-and-effect relationships § Avoid emotional manipulation and coercion 8
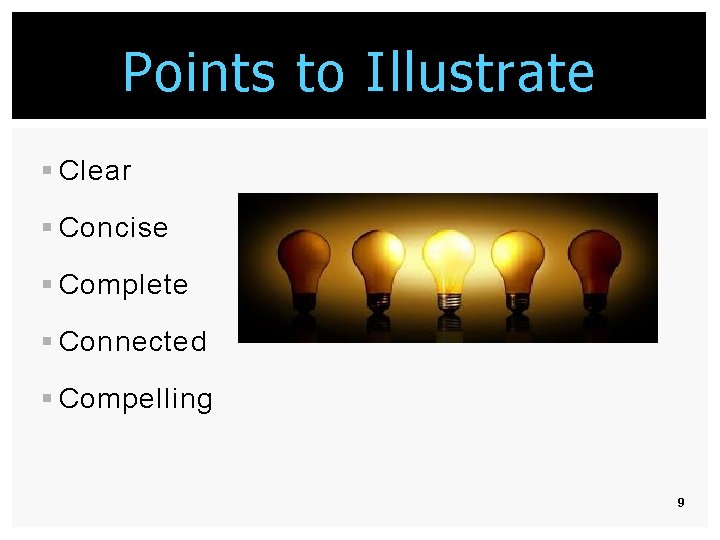
Points to Illustrate § Clear § Concise § Complete § Connected § Compelling 9
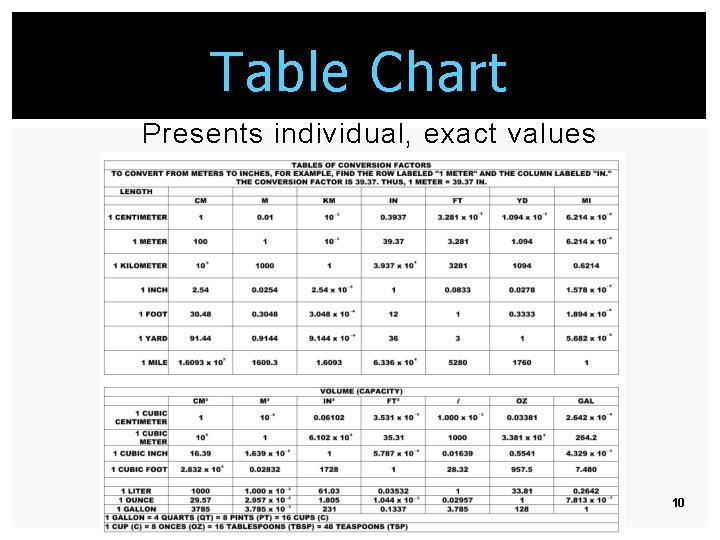
Table Chart Presents individual, exact values 10
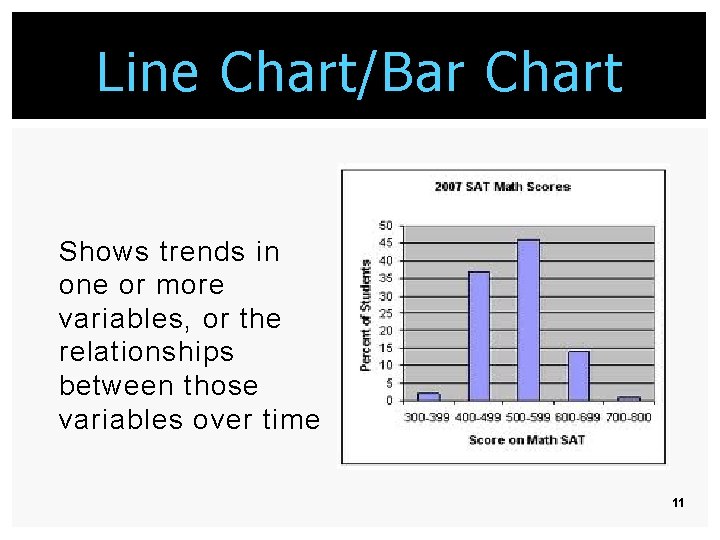
Line Chart/Bar Chart Shows trends in one or more variables, or the relationships between those variables over time 11
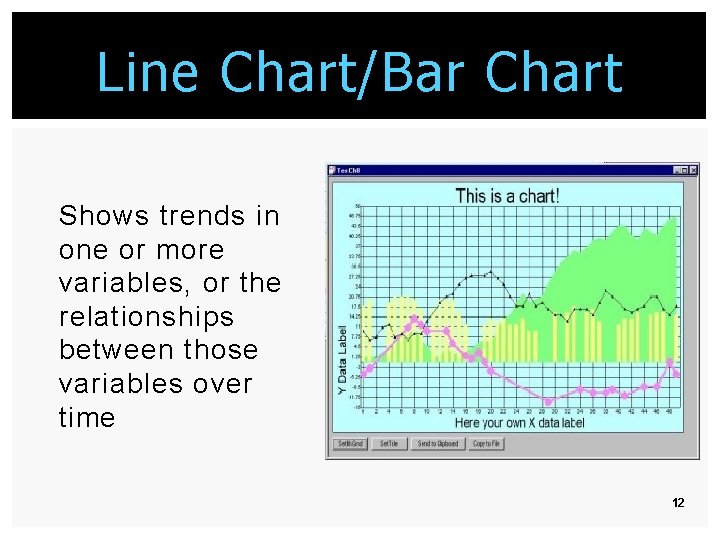
Line Chart/Bar Chart Shows trends in one or more variables, or the relationships between those variables over time 12
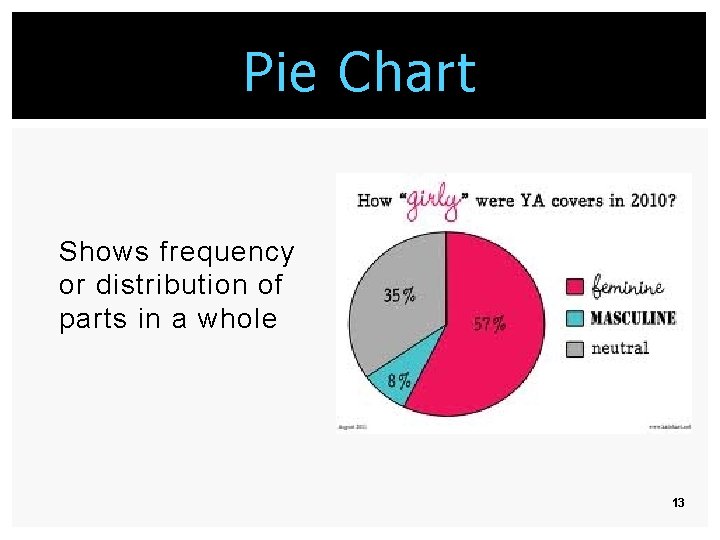
Pie Chart Shows frequency or distribution of parts in a whole 13
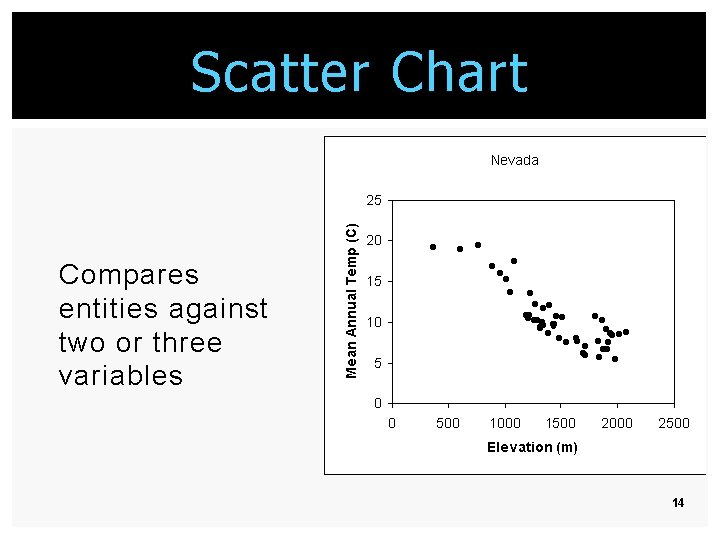
Scatter Chart Compares entities against two or three variables 14
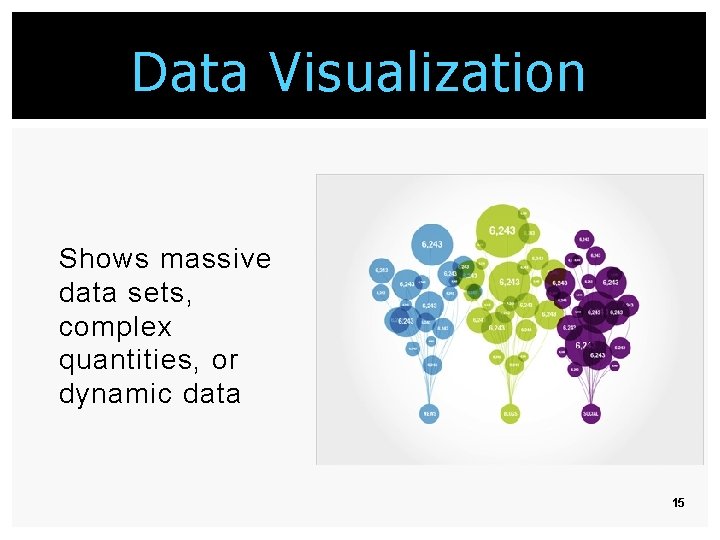
Data Visualization Shows massive data sets, complex quantities, or dynamic data 15
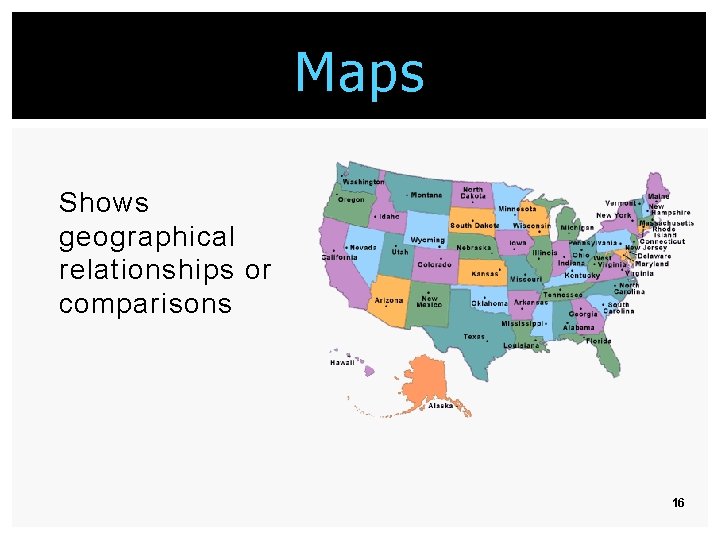
Maps Shows geographical relationships or comparisons 16
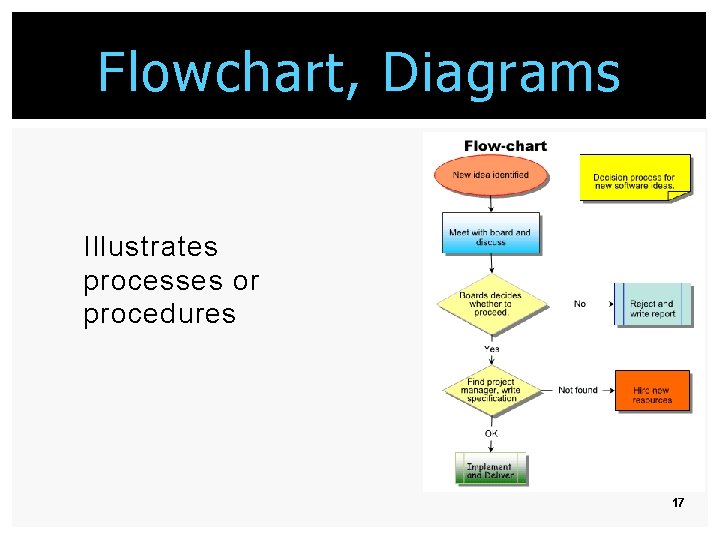
Flowchart, Diagrams Illustrates processes or procedures 17
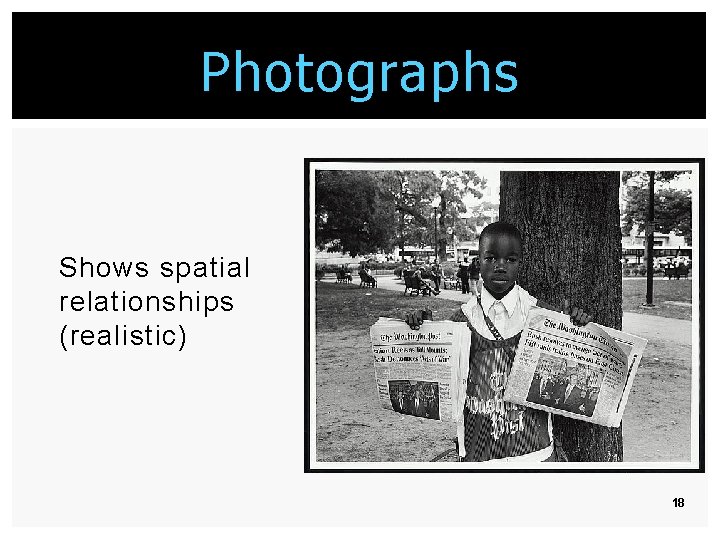
Photographs Shows spatial relationships (realistic) 18
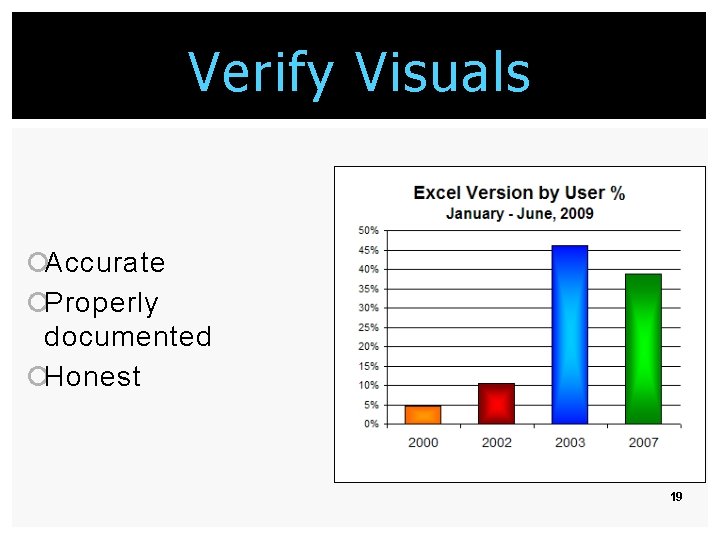
Verify Visuals ¡Accurate ¡Properly documented ¡Honest 19
Works Cited Bovee, Courtland R. and John V. Thill. Business Communications Today. 10 th Edition. New Jersey: Pearson/Prentice Hall, 2010. 20