Remote Sensing Imagery of Cyclone Gonu and Areas

")


- Slides: 23
Remote Sensing Imagery of Cyclone Gonu and Areas Affected
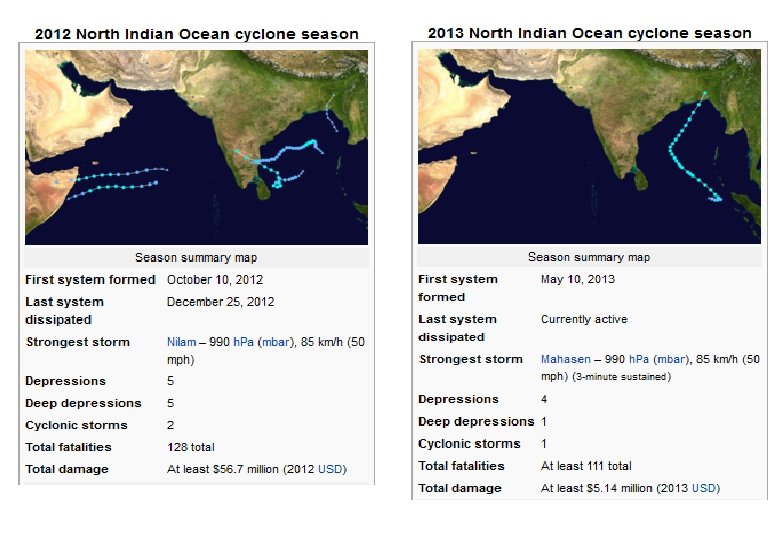
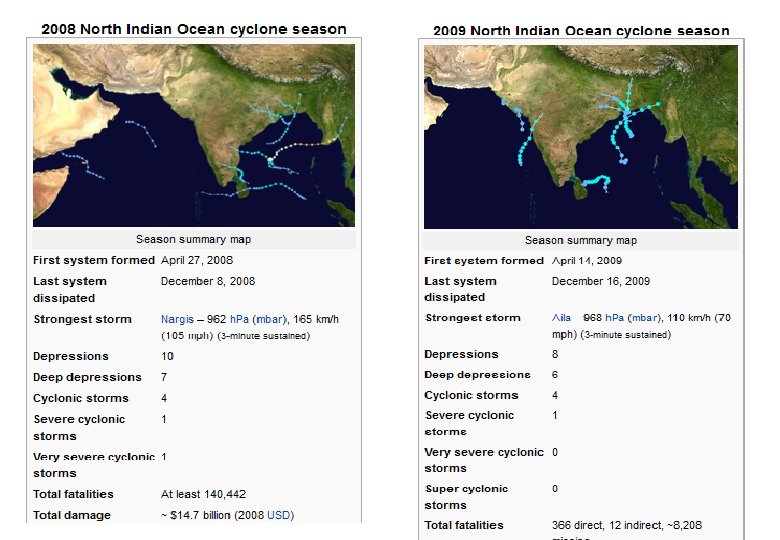
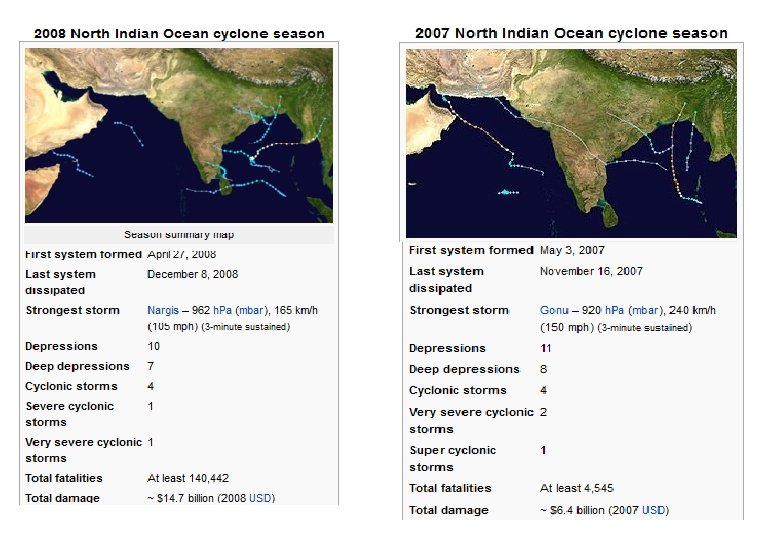
History of Tropical Cyclones in the North Indian Ocean (1984 -2013)
1984 -2005
Storms in 2007
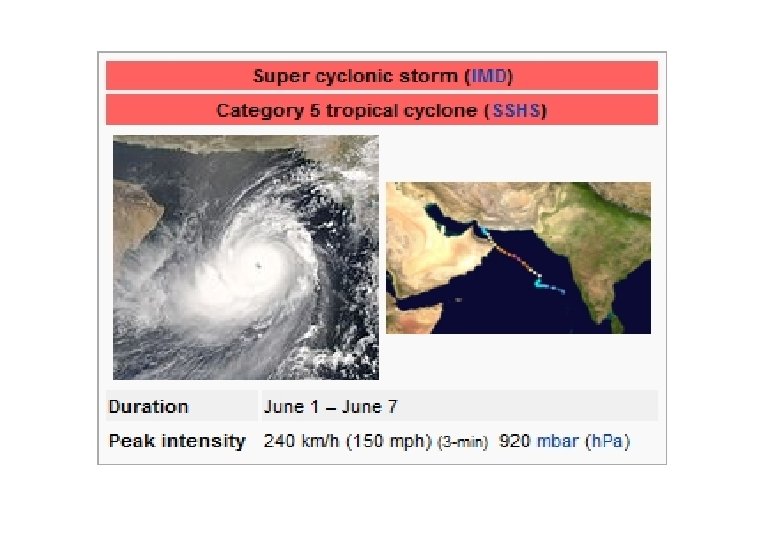
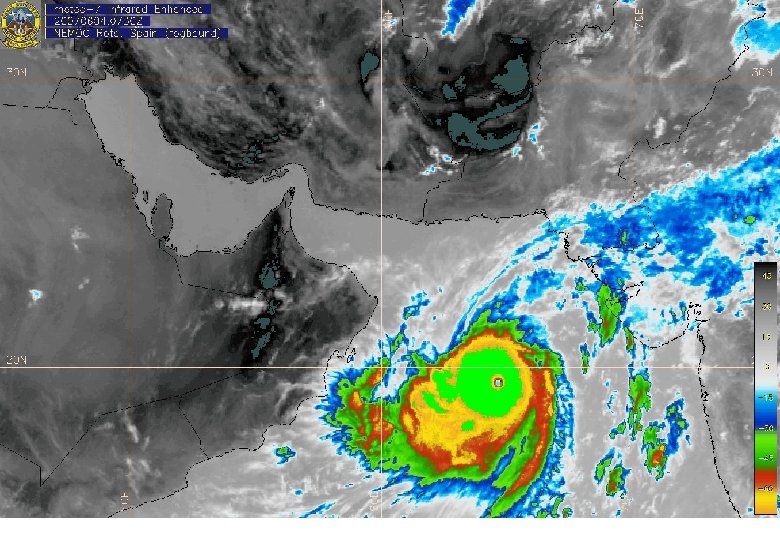
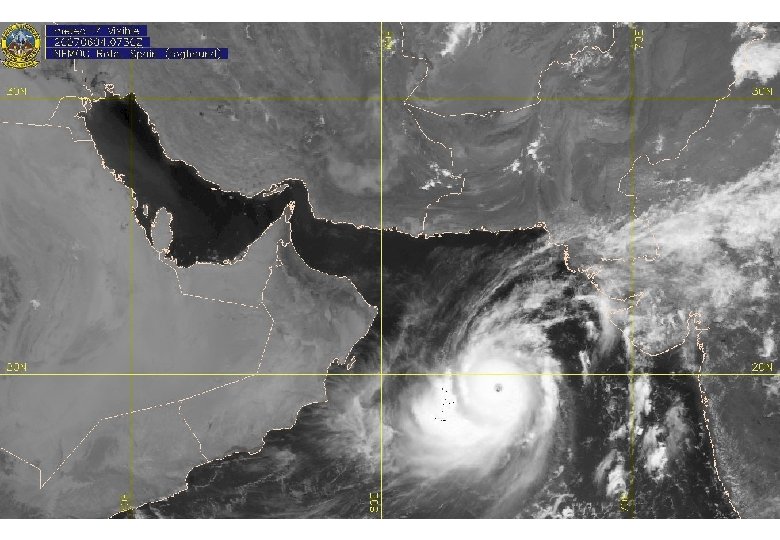
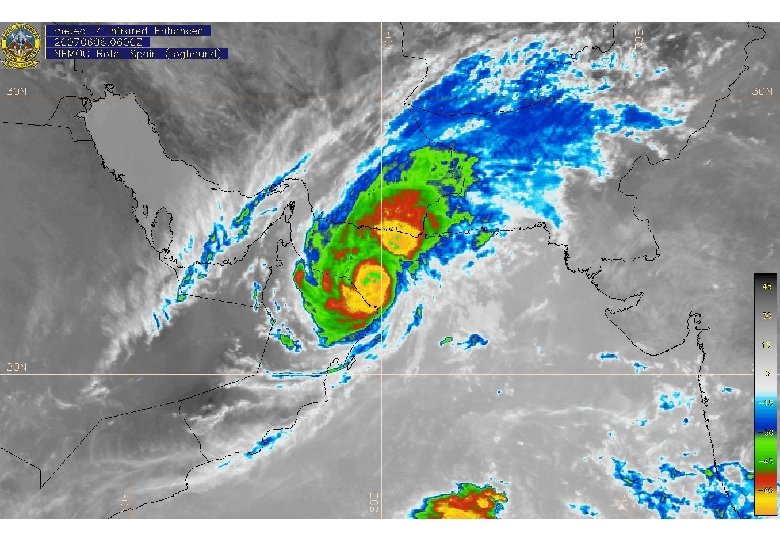
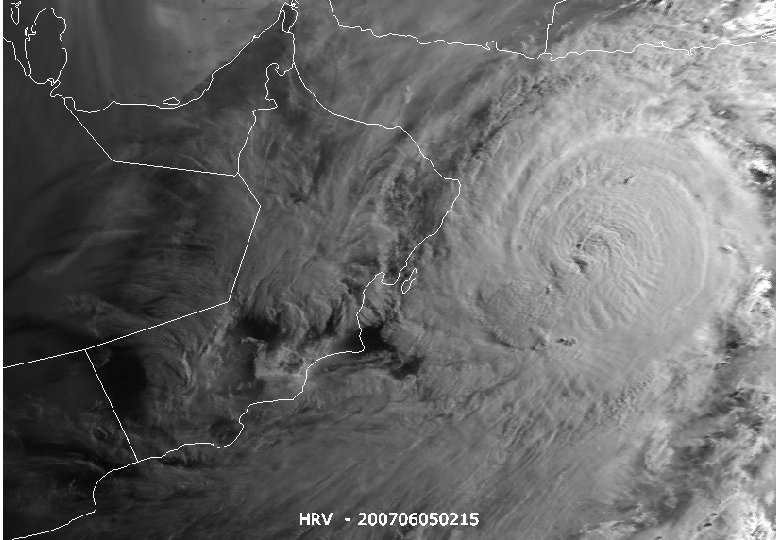
Cyclone Gonu Ø Strongest tropical cyclone to hit the Arabian Peninsula during last decade Ø First observed as tropical depression in the Indian Ocean on May 27 by weather satellites Ø Affected the eastern parts of Oman on June 4, 2007 Ø Gonu peaked to category 5 on June 6 Ø Brought along strong and torrential rains, high waves, and strong winds Ø As the storm weakened, it moved through the Arabian Sea and made a landfall in Iran on at 0. 00 GMT on June 7, 2007 Ø Gonu was downgraded to category 1 by June 8, 2007
Timeline of Cyclone Gonu 0400/07 1600/06 1900/05 1000/05 2200/04 1600/04 1000/04 2200/03 1600/03 Gonu Track 0700/03
Cyclone Gonu • Gonu dropped heavy rainfall near the eastern coastline, reaching up to 610 mm (24 inches) which caused flooding and heavy damage. • The cyclone caused about $4 billion in damage (2007 USD) and 49 deaths in Oman, where the cyclone was considered the nation's worst natural disaster. • In Iran, the cyclone caused 23 deaths and $215 million in damage (2007 USD). Source: wikipedia
Monitoring and early warning
Monitoring of Tropical Cyclones Using MSG • IR 10. 8 to get info on cloud top temperature/height • HRVIS to see detailed structures • NIR 1. 6 and IR 3. 9 (solar component) to get information on phase and particle size • IR 3. 9 - IR 10. 8 to find areas with most intense development/precipitation • RGB 01/03/09 (Day) or RGB 01/04/09 (Day) and RGB 10 -09/09 -04/09 (Night) to monitor cloud types and convective development • RGB 05 -06/04 -09/03 -01 to monitor convective development 14
Evaluation of damaged area
Qurum National Park, Oman Ikonos bands 3, 2 and 1; March 2, 2006
Qurum National Park, Oman Ikonos bands 3, 2 and 1; June 12, 2007
Remote Sensing Satellites ØSatellites are major contributors to weather and climate studies ØMeteorological and environmental satellites provide techniques for operational monitoring of the phenomenon on a continuous basis ØImagery provided by European Meteorological Satellites (EUMETSAT) are key input in all early warning systems of Tropical Cyclone
Remote Sensing Techniques Ø During natural disasters, accessibility and other infrastructure may not be in place to acquire valuable information from affected sites Ø Medium to high-resolution imagery necessary for mapping and evaluation of major disasters Ø Cyclone Gonu is example of the usefulness of satellites to monitor, forecast and to study this damaging phenomenon