Remote sensing for crop monitoring Castile and Len

 in north-western")


 • Between 8 -12")
 • One")


 (20 m) 5 crops cover")


- Slides: 22
Remote sensing for crop monitoring -Castile and León Regional Ministry of Agriculture- David A. Nafría
Castile and León • Castile and León is an autonomous community (State) in north-western Spain. • It is the largest autonomous region in Spain (94, 223 km 2) although the population is relatively low. • Geographically it comprises a dry and high plain, with an average altitude of 800 m, surrounded by mountains. • Most of the arable land (55, 000 km 2) is located in the center of the plateau where rain averages 500 mm. • Mediterranean (continental version) climate: Winters are long and cold, with average temperatures between 4 °C and 7 °C. Summers are hot with four dry months. • Dryland farming is based in winter crops such cereals (wheat and barley) and forage. • Ten percent of the arable land is irrigated in summer. The main irrigated crops are maize, wheat, sugar beet, alfalfa and potato. • Among permanent crops vineyards are the most important.
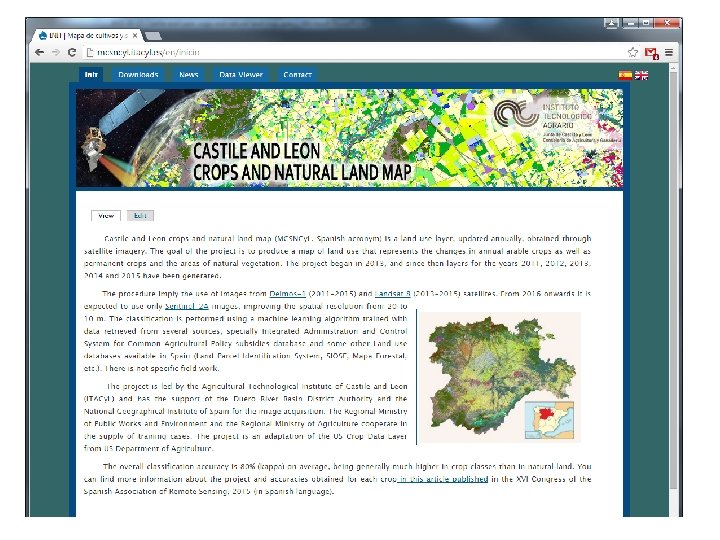
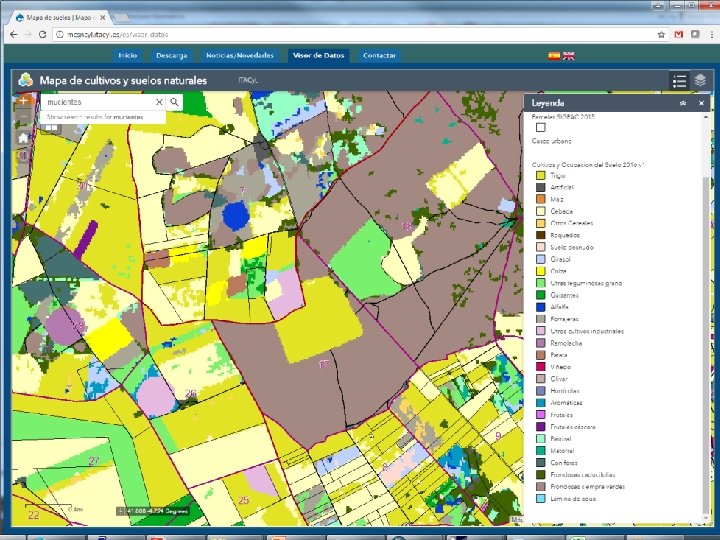
Castile and León crops and natural land map
Legend Includes irrigation and nonirrigation discriminati on for crops that could be grown under both conditions. The classification is done with 147 classes, 40 of them for crops
Objetives • Create a annual raster dataset with annual crops and land identification (Linked to LPIS) at 20 -10 m GSD without specific field work. • Include pastures and natural vegetation. It improves crop classification quality and add users to the product. • Use the classification as a general purpose layer in multiple projects: – Water use planning and water balances in aquifers. • Discrimination between irrigated and non irrigated land. • Estimation of water volumes due to crop and water needs knowledge. Agricultural Statistics (cropped area, common crop rotations, …). Environment monitoring (NATURA 2000). Agribusiness information (supply, monitoring, etc. ) Other remote sensing and crop modeling projects that require crop specific information. – CAP Subsidies controls. – – • On the spot checks. • LPIS land use update.
Methodology Training cases obtained from government databases e. g. CAP Applications Machine learning algorithm cope with the errors introduced due to the fact that there is not absolute truth in these databases. -Independent variables-Satellite imagery -Height , aspect Slope -Climate data -LPIS class Decision tree classifier Classified cases: Píxels with assigned class
Satellite imagery DE 01 -2014 -06 -GRNIR Deimos-1 (2011 -2016) • Between 8 -12 coverages per season. • Resampled to 20 m GSD defined project’s frame. • Acquisition dates accurately selected to achieve irrigation discrimination on winter crops. L 8 -202 -2014 -224 -765 Landsat- 8 (2013 -2016) • Intensively processed in order to be adapted to project frame (including pan-sharpening) • Complements Deimos-1 data with more spectral bands (helps in crops identification)
Satellite imagery S-1 -2016 -09 -29 S 2_R 137_20160626_832 Sentinel-2 (2016 -2018) • One satellite it’s not enough to replace Deimos-1. Two in the rampup period not satisfactory enough. • New Project frame with 10 m de GSD in 2017. Sentinel-1 • Still pending.
Geocoding of sources Deimos-1 junio 2016 Landsat-8 junio 2016 Aerial 2014 Sentinel-2 A junio 2016
Layers for classification Satellite scenes per year: 2011 2012 2013 2014 2015 2016 Deimos-1 28 17 16 21 31 11 Land. Sat-8 0 0 75 80 128 68 Sentinel-2 0 0 0 396 Independent variables per year: 2011 2012 2013 2014 2015 2016 29 26 203 225 341 323
Data access and download at http: //mcsncyl. itacyl. es
Accuracy 2016 layer (based on LPIS land cover class) (20 m) 5 crops cover 79% of applications (77% area) HORIZON 2020 SENSAGRI overview. European Commission. Brussels. 17/11/2017 3
2017 Copernicus experience • 2017 first year based only in Sentinel-2 – Improved resolution: 20 to 10 m GSD. Using only 4 bands. – Lower thematic overall accuracy (146 classes): 81% to 75%. Less 50% images available in spring compared to 2016. – +60, 000 € savings (DMC Images Acquisitions) – Problems with L 2 C: SEN 2 COR vs MAJA
Conclusions from 2011 -2017 • Good general accuracy 82%. Worst in natural landscapes than in crops (over 90%) without specific field work. It is fast and cheap. It is an operational product issued in July and December (definitive). • Feasible at a Country scale (several sensor, orbits, clouds) • Based in the overwhelming truth contained in farmers applications and other sources. • Participation in H 2020 Space EO-3 -2016: Evolution of Copernicus Services • NO role within IACS cycle or LPIS update I. e. 100% Wheat in farmer applications is 90% wheat, 6% Barley, 1% other cereals according to Remote sensing at pixel level
2017 version: CAP Monitoring • New opportunities arises for implementing solutions based in the crop map experience. • Fast movements in order to support some activities related to CAP in 2017: – LPIS Land cover update: Pixel based classification • Special version of crop map issued in August. (removing LPIS land cover class as an independent variable). Less precision in permanent crops. • Monthly Ir. RG mosaics for visual interpretation. Will be used supporting the 2018 Geospatial Aid Application – First exercises on monitoring with object based classification procedures. Two initial targets: Object based classification • Address the amount of burden that the new system could generate by monitoring 100% of the expedients. • Compare results with OTSC (On the Spot Checks) in order to select specifics aids that are more suitable for monitoring. 377 different types of land cover has been identified under the perspective of crop diversification and other conditions (Crop, cycle [winter/spring], irrigation [yes/no])
Some final considerations • A general purpose land cover map (with crops, impervious and natural land) could be a more complex product and scientifically more interesting. • The creation of products to support monitoring within IACS is very demanding in terms of reliability. • Without using 2 x. Sentinel-2 satellites is a must. That could imply some degree of fragility for the system.
CAP Monitoring OBJECT BASED CLASSIFICATION PIXEL BASED CLASSIFICATION Zonal statistics with python-rasterstats over GSAA LPIS Update Probabilistic approach Applications monitoring Deterministic approach Decision making process
CAP Monitoring Probabilistic approach FEAT_ID 54446049 RAINFED BARLEY 8% PROBABILITY IRRIGATED WHEAT 84% RAINFED WHEAT 8% Deterministic approach FEAT_ID TYPE 54446049 COUNT PERCENTAGE RAINFED WHEAT 21 10% IRRIGATED WHEAT 190 89% IRRIGATED BARLEY 2 1% OTHER GRAINS 1 0%
CAP Monitoring Probabilistic approach FEAT_ID WHEAT 64142689 5% PROBABILITY BARE SOIL SUNFLOWER 31% 22% VINEYARD 41% Deterministic approach FEAT_ID 64142689 TYPE VINEYARD COUNT 188 PERCENTAGE 100%
David A. Nafría nafgarda@itacyl. es F. Javier Rojo rojrevfr@itacyl. es October 2017