Remington Point TAKS Summary RECOGNIZED 2008 TAKS Highlights


- Slides: 11
Remington Point TAKS Summary RECOGNIZED- 2008
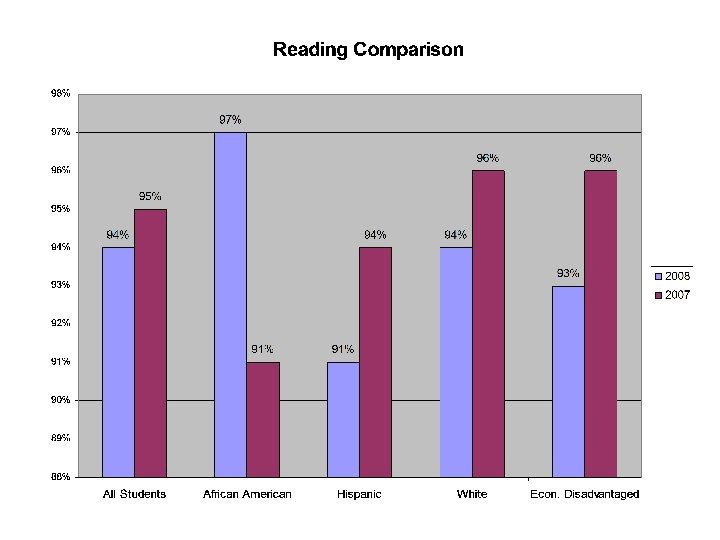
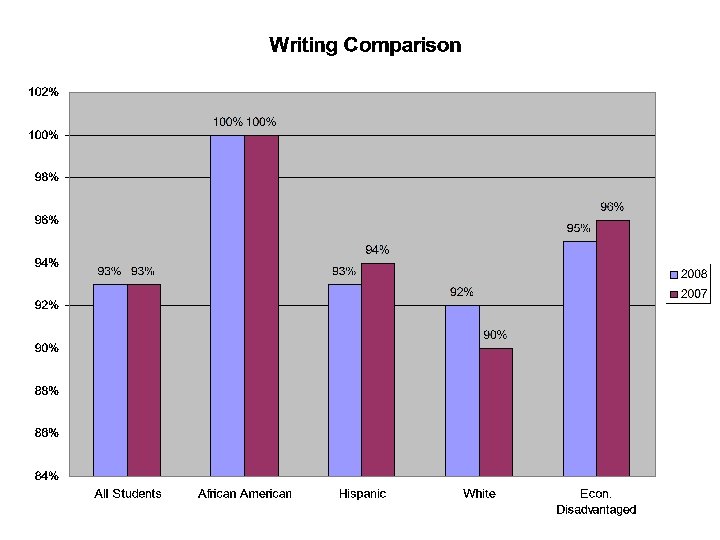
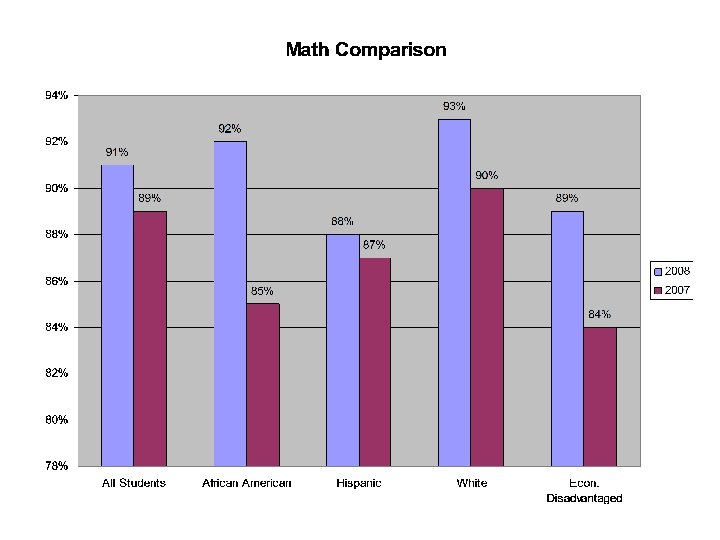
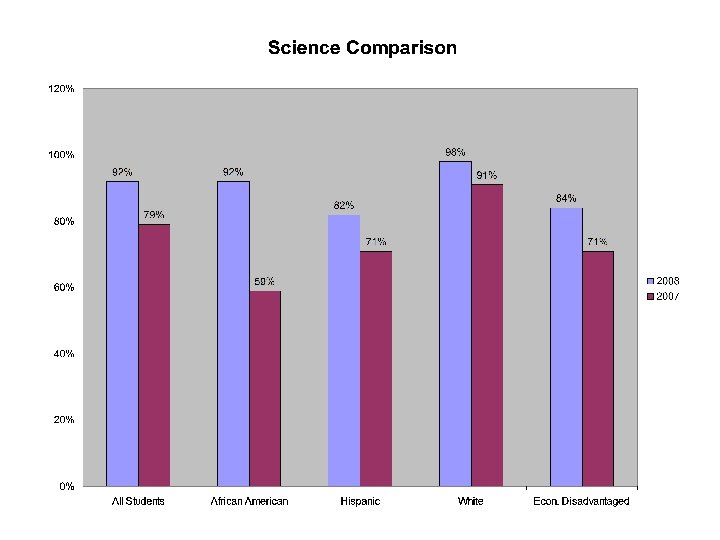
TAKS Highlights • Reading- All Subgroups > 90% • Math- 3 out of 5 Subgroups >90% • Writing- All Subgroups > 90% • Science- 3 out of 5 Subgroups > 90%
Reading Concern • 4 out of 5 subgroups experienced a decrease in number of students passing. • Hispanic • 118 out of 129 passed = 91% • 115 out of 129 passing = 89% • THREE less students passing = Recognized • Econ. Disadvantaged • 99 out of 107 passed = 93% • 95 out of 107 passing = 89% • FOUR less students passing = Recognized
Areas of Concern Math 2008 2007 All Students 91% 89% African American 92% 85% Hispanic 88% 87% White 93% 90% Econ. Disadvantaged 89% 84% Science 2008 2007 All Students 92% 79% African American 92% 59% Hispanic 82% 71% White 98% 91% Econ. Disadvantaged 84% 71%
Subgroups < 90% • Math- Hispanic • 114 out of 129 passed = 88. 4% • 116 out of 129 passing = 90% • TWO more students = EXEMPLARY • Math- Econ. Disadvantaged • 95 out of 107 passed = 88. 8% • 96 out of 107 passing = 90% • ONE more student = EXEMPLARY
Subgroups < 90% • Science- Hispanic • 32 out of 39 passed = 82. 1% • 35 out of 39 passing = 90% • THREE more students = EXEMPLARY • Science- Econ. Disadvantaged • 27 out of 32 passed = 84. 4% • 29 out of 32 passing = 91% • TWO more students = EXEMPLARY
Forecast for 2009 • Continue to increase Math and Science • Redouble efforts in Reading • Become EXEMPLARY!