
RELIABILITY PSY 504 PSYCHOLOGICAL MEASUREMENT CLASSICAL TEST THEORY

RELIABILITY PSY 504: PSYCHOLOGICAL MEASUREMENT
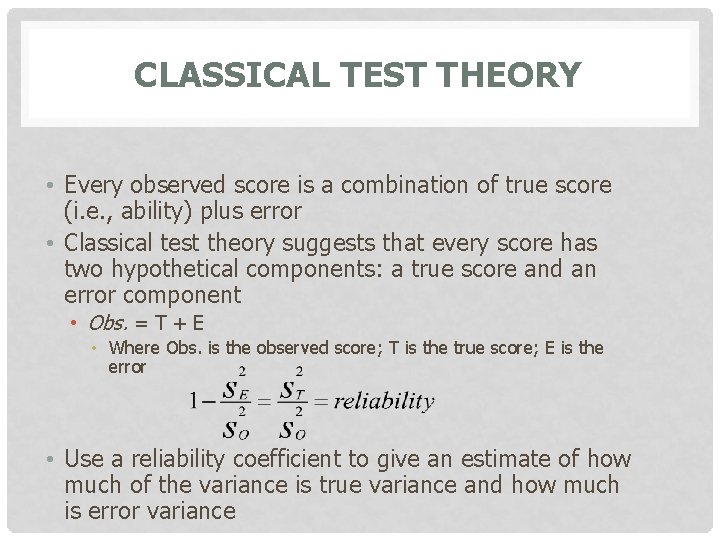
CLASSICAL TEST THEORY • Every observed score is a combination of true score (i. e. , ability) plus error • Classical test theory suggests that every score has two hypothetical components: a true score and an error component • Obs. = T + E • Where Obs. is the observed score; T is the true score; E is the error • Use a reliability coefficient to give an estimate of how much of the variance is true variance and how much is error variance

RELIABILITY • Reliability is: • The consistency of measurements when the testing procedure is repeated on a population of individuals or groups • An estimate of the proportion of total variance that is true variance and the proportion that is error variance • Systematic errors are constant errors that do not fluctuate • Each test taker affected equally • Unsystematic errors are those errors that are not constant • e. g. , administration of the instrument • Reliability only measures unsystematic error (error variance is only unsystematic error)
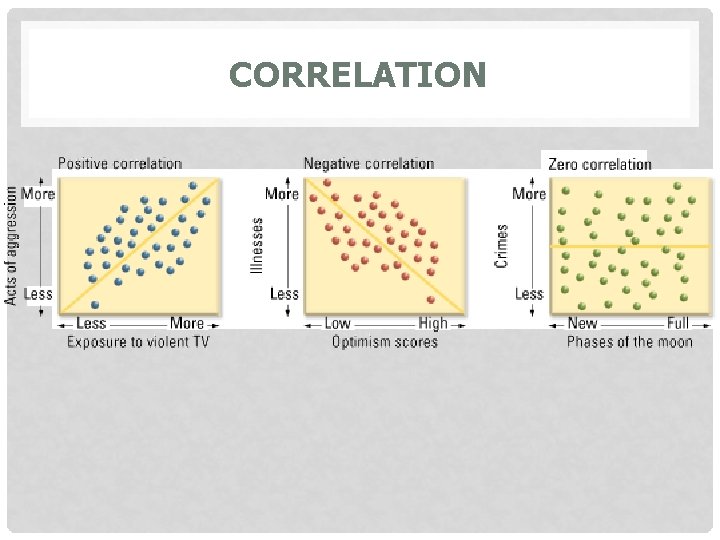
CORRELATION • Correlation – a statistical technique that is often used in estimating reliability by providing an indication of consistency by examining the relationship between two scores • Correlation coefficient – a numerical indicator of the relationship between two sets of data
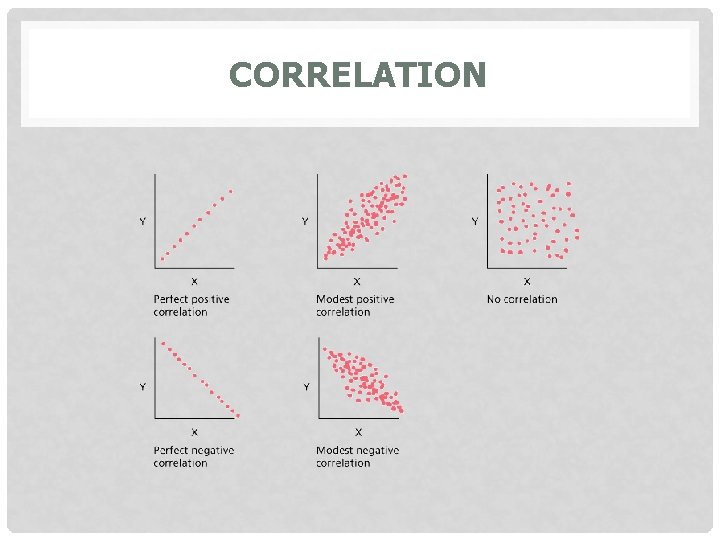
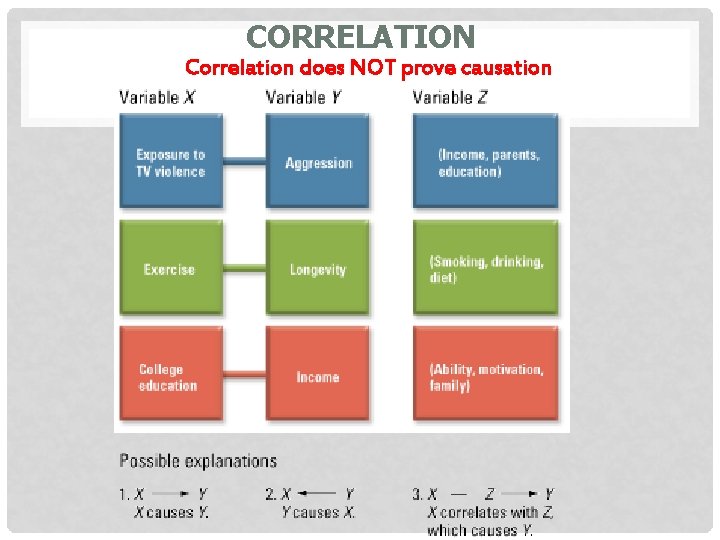
CORRELATION • Correlation coefficient ranges from – 1. 00 to +1. 00 • Closer to 1. 00 or -1. 00, the stronger the relationship between the variables • No correlation = 0. 0 • Perfect correlation = -1. 00 OR +1. 00 • Positive correlation – variables are related in the same direction • As one increases, the other increases; as one decreases, the other decreases • Negative correlation – variables are related in the opposite direction • As one increases, the other decreases • CORRELATION DOES NOT PROVE CAUSATION!!!
CORRELATION
CORRELATION
CORRELATION Correlation does NOT prove causation
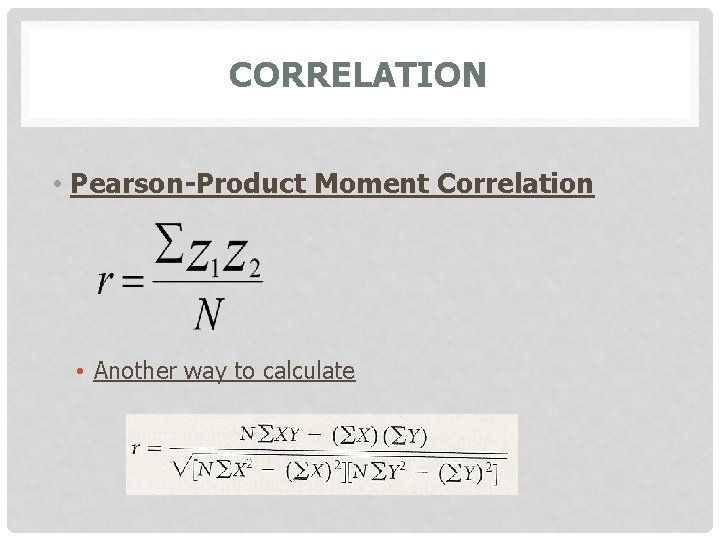
CORRELATION • Pearson-Product Moment Correlation • Another way to calculate
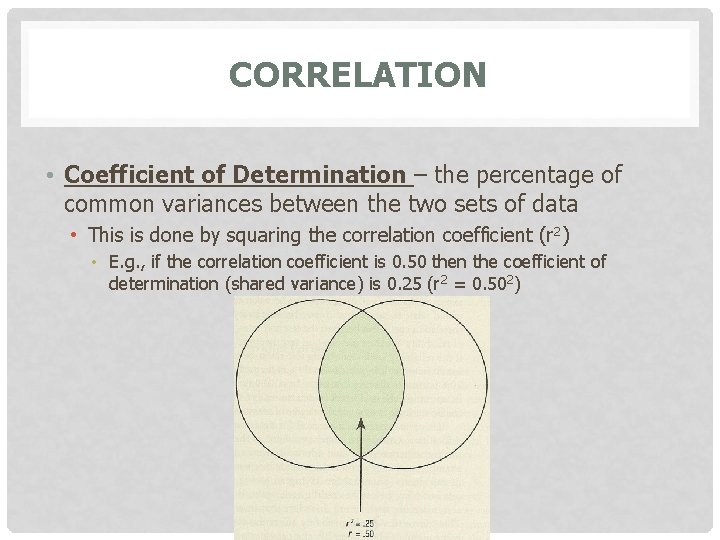
CORRELATION • Coefficient of Determination – the percentage of common variances between the two sets of data • This is done by squaring the correlation coefficient (r 2) • E. g. , if the correlation coefficient is 0. 50 then the coefficient of determination (shared variance) is 0. 25 (r 2 = 0. 502)
TYPES OF RELIABILITY • Test-Retest – reliability coefficient is calculated by correlating the performance on the first administration with the performance of the second administration • Can be affected by “events” that occur between first and second administration • Reliability coefficients tend to decrease as the amount of time between the testing increases • Three assumptions must be met: • The characteristics or trait that is being measured must be stable over time • There should be no differential practice effect • There should be no differential in learning between the test and the retest
TYPES OF RELIABILITY • Parallel-Forms – an individual is given one form of the instrument initially and then assessed with the second (alternate or parallel) form of the instrument; the correlated scores on the two instruments results in an estimate of reliability • Can be given in immediate succession • Avoids many of the difficulties with test-retest • Much care should be taken to make sure the alternate forms to ensure that the two forms are truly parallel • E. g. , make sure one form is not more difficult than the other • Not often seen in counseling because it is difficult to develop even one sound instrument • The first instrument still may have some influence on the administration of the second instrument
TYPES OF RELIABILITY • Inter-Rater – having a sample of tests (i. e. , scores), or observations, independently scored by two or more examiners • The two scores obtained by each test taker are then correlated • This typically used when “judgment of the scorer” is required
TYPES OF RELIABILITY: CONSISTENCY INTERNAL • Split-Half – the instrument is given once and then split in half to determine the reliability • Often divided in half by using the scores form the even items and the scores from the odd items • After the instrument has been divided into two halves, each score on the two halves is correlated • This is a problem because a correlation is influenced by the number observations in the calculation – the larger the number of observations, the larger the correlation coefficient • E. g. , if 50 items, the split-half method provides an estimate of reliability based on 25 items • The Spearman-Brown formula corrects this problem by providing an estimate of what the reliability coefficient would be if the halves were increased to the original length of the instrument • Should only use Spearman-Brown coefficients with other S-B coefficients
TYPES OF RELIABILITY: CONSISTENCY INTERNAL • Kuder-Richardson – used when scoring is dichotomous • KR-20 – appropriate for instruments that are heterogeneous • KR-21 – appropriate for instruments that are homogenous
TYPES OF RELIABILITY: CONSISTENCY INTERNAL • Cronbach’s Alpha (a) – the appropriate method of estimating reliability when the scoring is not dichotomous (e. g. , strongly agree, neutral, disagree, strongly disagree) • Takes into account the variance of each item • Usually low and conservative estimates of reliability • Also known as Coefficient Alpha
EVALUATING RELIABILITY COEFFICIENTS • Examine purpose for using instrument • Have knowledge about the reliability coefficients of other instruments in area • Examine characteristics of particular clients against reliability coefficients • SES • Age • Culture/ethnicity
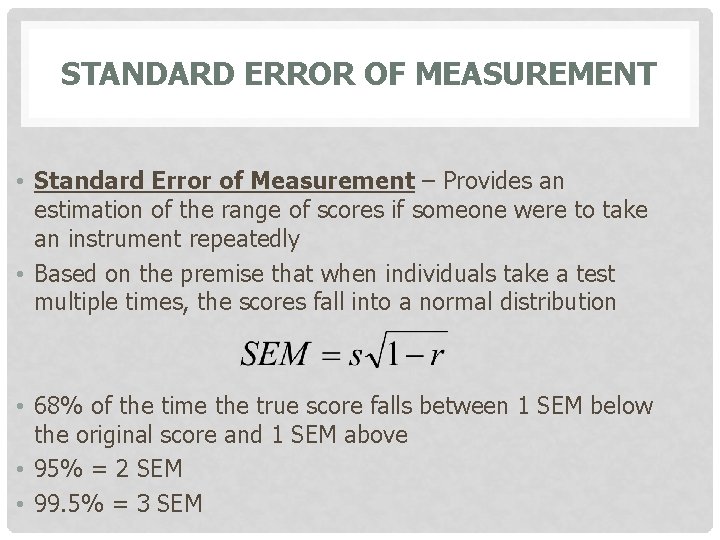
STANDARD ERROR OF MEASUREMENT • Standard Error of Measurement – Provides an estimation of the range of scores if someone were to take an instrument repeatedly • Based on the premise that when individuals take a test multiple times, the scores fall into a normal distribution • 68% of the time the true score falls between 1 SEM below the original score and 1 SEM above • 95% = 2 SEM • 99. 5% = 3 SEM
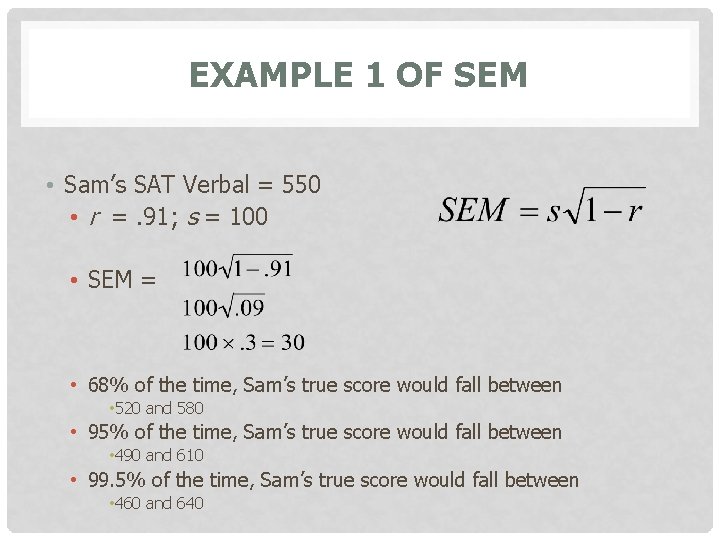
EXAMPLE 1 OF SEM • Sam’s SAT Verbal = 550 • r =. 91; s = 100 • SEM = • 68% of the time, Sam’s true score would fall between • 520 and 580 • 95% of the time, Sam’s true score would fall between • 490 and 610 • 99. 5% of the time, Sam’s true score would fall between • 460 and 640
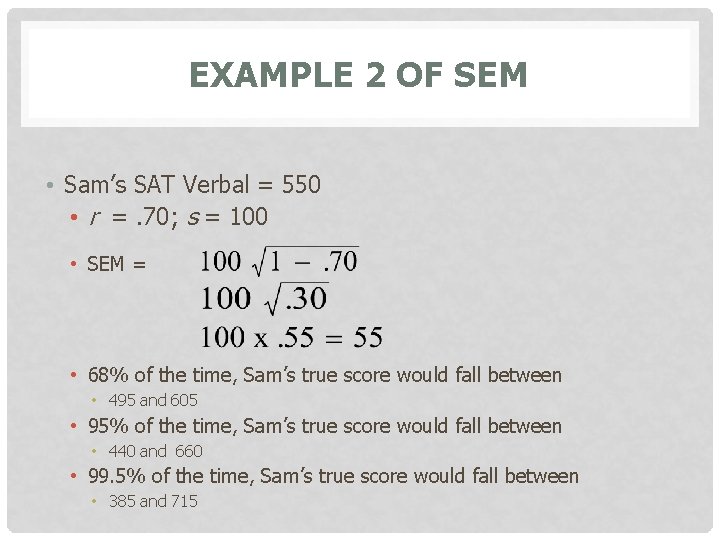
EXAMPLE 2 OF SEM • Sam’s SAT Verbal = 550 • r =. 70; s = 100 • SEM = • 68% of the time, Sam’s true score would fall between • 495 and 605 • 95% of the time, Sam’s true score would fall between • 440 and 660 • 99. 5% of the time, Sam’s true score would fall between • 385 and 715
STANDARD ERROR OF MEASUREMENT • SEM will always increase as reliability decreases • Important to consider if the instrument’s reliability varies depending on ability level, age, or other factors • SEM is more appropriate for individual scores while the reliability coefficient is often best to compare different instruments • Best to provide clients with a range of scores rather than reporting only one score • Assessment results should be interpreted by using a range of scores based on SEM
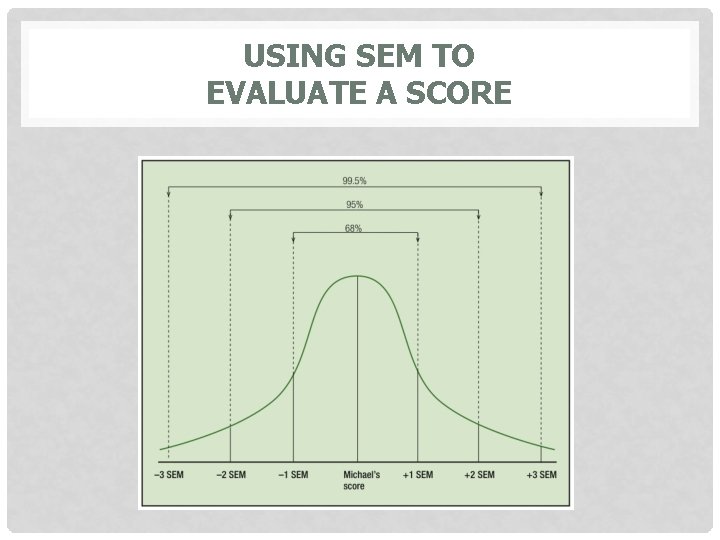
USING SEM TO EVALUATE A SCORE
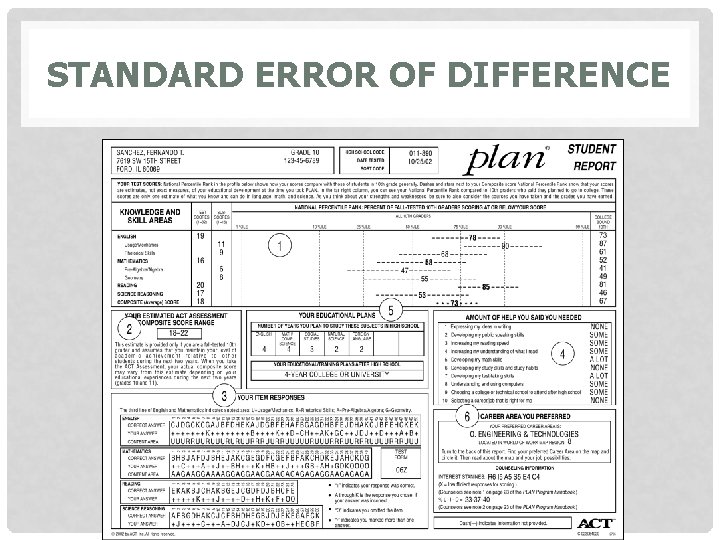
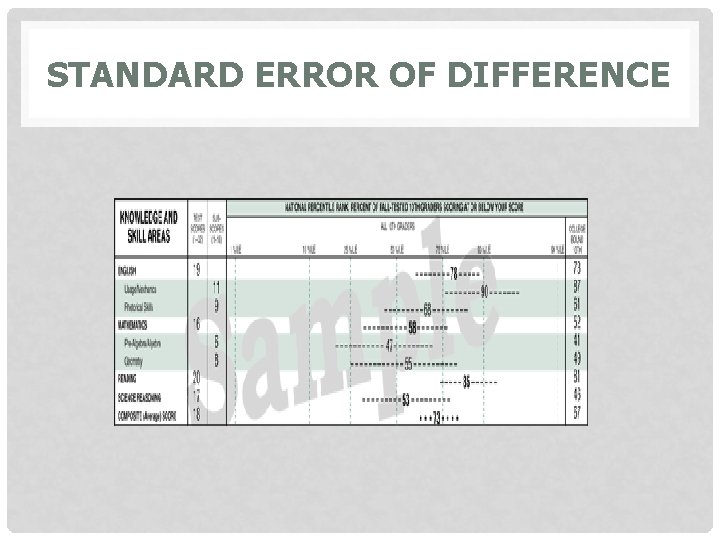
STANDARD ERROR OF DIFFERENCE • Standard Error of Difference – a measure used to examine the difference between two scores and determine if there is a significant difference • In examining the differences between the two scores, counselors need to take into account the errors of measurement from both scores • If the bands overlap, then it should not be concluded that the two scores are different • Differences can be attributed to areas where there is no overlap between bands
STANDARD ERROR OF DIFFERENCE
STANDARD ERROR OF DIFFERENCE
ALTERNATIVE THEORETICAL MODEL • Generalizability Theory (Domain Sampling Theory) • Focus is on estimating the extent to which specific sources of variation under defined conditions are contributing to the score on the instrument. • Stated differently: The focus is on the degree to which scores can be generalized across alternative forms, test administrators, number of items, and other facets of assessment • The term universe score, rather than true score, is used to represent the average of taking the instrument multiple times in the same universe (e. g. , same purpose and same conditions) • Purpose is to identify specific sources of variation, which results in multiple coefficients of generalizability • E. g. , practice effects, examinee’s motivation, administration styles, room temperature • This theory requires multiple reliability coefficients or coefficients of generalizability… combine reliability estimates across studies (metaanalysis) – reliability generalization
- Slides: 26