Reliability Engineering in Mechanical Engineering Project II TEAM
 TEAM 1 20144489, Sunjoo Lee (Multiphase")
Reliability Engineering in Mechanical Engineering (Project - II) TEAM 1 20144489, Sunjoo Lee (Multiphase Flow Lab. ) 20153167, Joon-Seok Kim (Flow Control Lab. ) School of Mechanical and Aerospace Engineering, Department of Mechanical Engineering Korea Advanced Institute of Science and Technology (KAIST) Dec. 1, 2015 Multiphase Flow Lab. 1

Contents u Introduction § Summary of Project I § Determination of Strength / Stress u Reliability Estimations : Using probability density functions § Using Probability Density Functions § Using Standard Normal Distribution Chart u Reliability Estimations : Using only the sample data § Methodology § Using Failure Probability § Using Reliability u Conclusion Multiphase Flow Lab. 2
 μ = 297. 9615 σ = 148.")
Data Set 1 : (n = 26) μ = 297. 9615 σ = 148. 1347 Multiphase Flow Lab. 369 261 401 369 272 289 50 191 470 179 297 365 498 51 123 279 454 319 325 131 546 136 631 163 256 322 Data Set 2 : (n = 27) μ = 338. 0370 σ = 190. 6161 3 614 228 31 415 515 219 421 181 573 19 239 16 304 372 623 250 172 434 554 453 610 444 468 469 72 196 235

Introduction Multiphase Flow Lab. 4
 판단 K-S 검정")
Summary of Project I : Data Set 1 직진성 (R 값) 판단 K-S 검정 Normal distribution (Median rank) § 확률분포 함수 직진성 (R 값) 판단 K-S 검정 § Normal distribution (Median rank) R = 0. 99129 α = 0. 25 Normal distribution 누적분포 함수 적합도 검정으로는 판단하기 힘듦. 정량적으로 비교 가능한 값인 R 값 이용 Median rank ∴ Data set 1 의 누적분포함수는 Median rank 로 추정을 하고, 확률분포는 Normal distribution 을 따른다. Multiphase Flow Lab. 5
 판단 K-S 검정")
Summary of Project I : Data Set 2 직진성 (R 값) 판단 K-S 검정 Normal distribution (Median rank) § 확률분포 함수 직진성 (R 값) 판단 K-S 검정 § Normal distribution (Median rank) R = 0. 98233 α = 0. 25 Normal distribution 누적분포 함수 적합도 검정으로는 판단하기 힘듦. 정량적으로 비교 가능한 값인 R 값 이용 Mean rank ∴ Data set 2 의 누적분포함수는 Mean rank 로 추정을 하고, 확률분포는 Normal distribution 을 따른다. Multiphase Flow Lab. 6
")
Determination of Strength / Stress Data Set 1 Data Set 2 (n = 26) (n = 27) μ 1 = 297. 9615 μ 2 = 338. 0370 σ1 = 148. 1347 σ2 = 190. 6161 μ 1 < μ 2 Data Set 1 : Stress Data Set 2 : Strength Multiphase Flow Lab. 7

Reliability Estimations : Using probability density functions Multiphase Flow Lab. 8
 : Normal distribution | Median rank |")
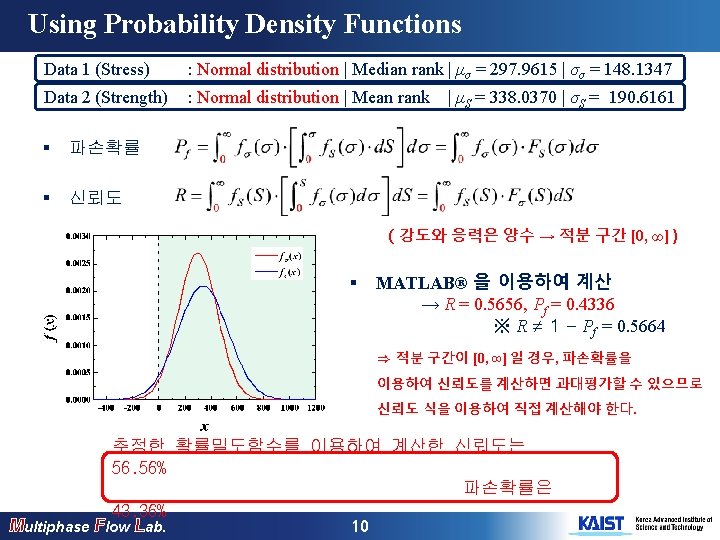
Using Probability Density Functions Data 1 (Stress) : Normal distribution | Median rank | μσ = 297. 9615 | σσ = 148. 1347 Data 2 (Strength) : Normal distribution | Mean rank § 누적분포함수 § 확률밀도함수 Multiphase Flow Lab. 9 | μS = 338. 0370 | σS = 190. 6161
 : Normal distribution | Median rank |")
Using Probability Density Functions Data 1 (Stress) : Normal distribution | Median rank | μσ = 297. 9615 | σσ = 148. 1347 Data 2 (Strength) : Normal distribution | Mean rank | μS = 338. 0370 | σS = 190. 6161 ※ 적분 구간 [- ∞, ∞] 으로 계산 § 파손확률 § 신뢰도 § Multiphase Flow Lab. 11 MATLAB® 을 이용하여 계산 → R = 0. 5656, Pf = 0. 4336 ※ R = 1 - Pf

Using Probability Density Functions § MATLAB® code Multiphase Flow Lab. 12
 : Normal distribution | Median rank")
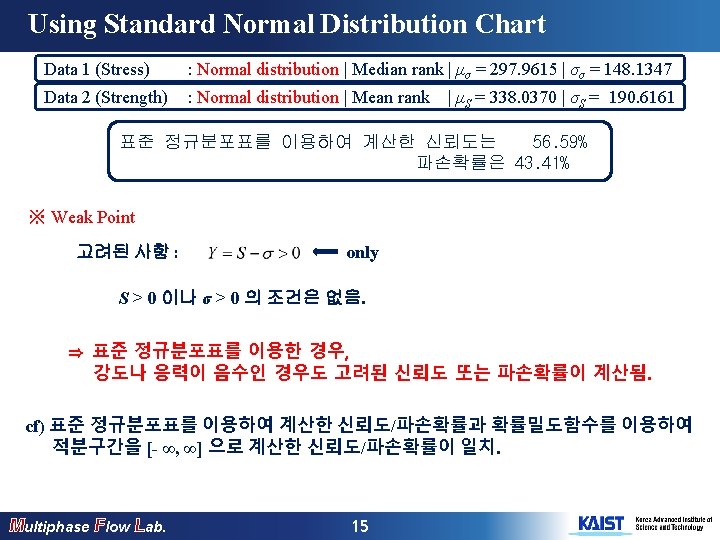
Using Standard Normal Distribution Chart Data 1 (Stress) : Normal distribution | Median rank | μσ = 297. 9615 | σσ = 148. 1347 Data 2 (Strength) : Normal distribution | Mean rank | μS = 338. 0370 | σS = 190. 6161 4. 5절 특성-2 § 신뢰도(R) 표준 정규분포표를 이용하여 계산한 신뢰도는 56. 59% Multiphase Flow Lab. 13
 : Normal distribution | Median rank")
Using Standard Normal Distribution Chart Data 1 (Stress) : Normal distribution | Median rank | μσ = 297. 9615 | σσ = 148. 1347 Data 2 (Strength) : Normal distribution | Mean rank | μS = 338. 0370 | σS = 190. 6161 4. 5절 특성-2 § 파손확률(Pf) 표준 정규분포표를 이용하여 계산한 파손확률은 43. 41% Multiphase Flow Lab. 14

Reliability Estimations : Using only the sample data Multiphase Flow Lab. 16
 : Normal distribution | Median rank | μσ =")
Methodology § Data 1 (Stress) : Normal distribution | Median rank | μσ = 297. 9615 | σσ = 148. 1347 Data 2 (Strength) : Normal distribution | Mean rank | μS = 338. 0370 | σS = 190. 6161 신뢰도(R) 를 이용하는 방법 (Song and Park, Reliability Engineering, 2013) § 파손확률(Pf ) 를 이용하는 방법 (Song and Park, Reliability Engineering, 2013) Multiphase Flow Lab. 17
 : Normal distribution | Median rank | μσ =")
Methodology § Data 1 (Stress) : Normal distribution | Median rank | μσ = 297. 9615 | σσ = 148. 1347 Data 2 (Strength) : Normal distribution | Mean rank | μS = 338. 0370 | σS = 190. 6161 꼬리부분 보정 방법 하한법 삼각형법 그래프의 넓이 = Pf 상한법 Multiphase Flow Lab. 18
 : Normal distribution | Median rank | μσ")
Using Failure Probability Data 1 (Stress) : Normal distribution | Median rank | μσ = 297. 9615 | σσ = 148. 1347 Data 2 (Strength) : Normal distribution | Mean rank Interpolation Multiphase Flow Lab. 19 | μS = 338. 0370 | σS = 190. 6161

Using Failure Probability Lower Limit Pf = 0. 4372 Triangle Upper Limit Pf = 0. 4393 Multiphase Flow Lab. Pf = 0. 4415 20
 : Normal distribution | Median rank | μσ =")
Using Reliability Data 1 (Stress) : Normal distribution | Median rank | μσ = 297. 9615 | σσ = 148. 1347 Data 2 (Strength) : Normal distribution | Mean rank Interpolation Multiphase Flow Lab. 21 | μS = 338. 0370 | σS = 190. 6161

Using Reliability Lower Limit R = 0. 5585 Triangle Upper Limit R = 0. 5607 Multiphase Flow Lab. R = 0. 5628 22

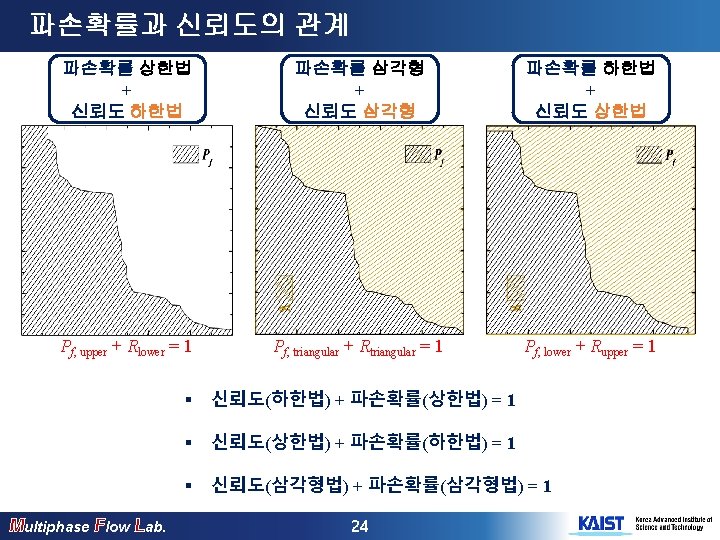
파손확률과 신뢰도의 관계 Multiphase Flow Lab. 23

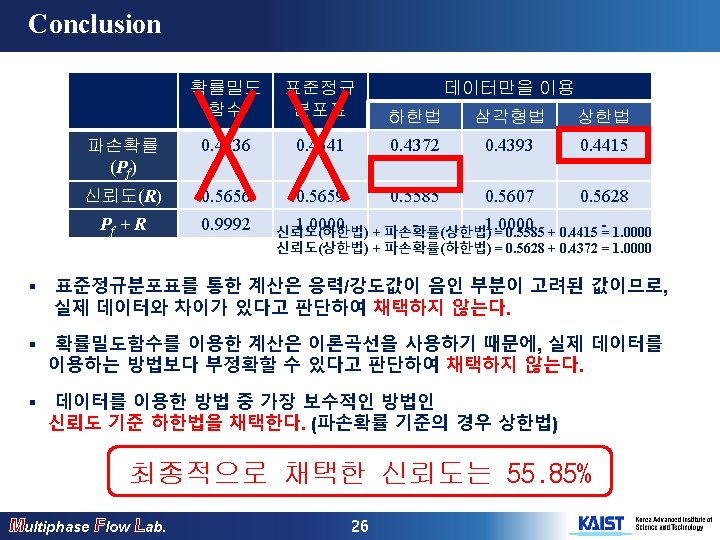
Conclusion Multiphase Flow Lab. 25

Thank you Multiphase Flow Lab. 27
- Slides: 27