Relative Motion Frames of Reference Object or point

Relative Motion

Frames of Reference Object or point from which motion is determined n Most common is the earth n Motion is a change in position relative to a frame of reference n

What is motion? n If you are standing in one place, and your friend walks by you, are you moving relative to your friend? n Is your friend moving relative to you? n Is either of you moving relative to the earth?

Answer: n n You are moving relative to your friend, and your friend is moving relative to you! You are not moving relative to the earth, but your friend is. You are both moving relative to the sun!

What is motion? n If you and your friend are walking down the hall together at the same speed, in the same direction, are you moving relative to your friend? n Is your friend moving relative to you? n Are either of you moving relative to the earth?

Answer: n You are NOT moving relative to your friend, and your friend is NOT moving relative to you. You both are moving relative to the earth.

Uniform motion – occurs when an object is moving at a constant speed/ velocity in a straight line. Constant speed/velocity- means that the object is covering the same distance per unit of time. Scalar – any quantity that is represented by a magnitude and a unit. Vector – any quantity that is represented by a Magnitude, a unit and a direction.
 is a n scalar measure of")
Distance and Displacement n n n Distance (d) is a n scalar measure of the actual path between two locations. It has a magnitude and a unit. Ex: 50 m, 2. 5 hrs. n Displacement (d) is a vector measure of the change in position measured in a straight line from a starting reference point. Ex: 5 m [W]

Sign Convention n In physics we will use a standard set of signs and directions. n n Up, right, east and north are positive directions. ( + ) Down, left, west, and south are negative directions. (-)

Distance – total trip d total d d total = d 1 + d 2 + d 3 + d 4 = 2 m + 4 m + 2 m + 4 m total = 20 m Displacement – change in position d total = +d 1 + +d 2 + -d 3 + -d 4 d total = +2 m + +4 m + -2 m + -4 m d total =0 m

Speed = Change in distance ÷ Time Δ d_ V T Example: A car travels 300 km in 6 hours. What is the speed of the car? n

Answer: n Speed = distance ÷ time n Speed = 300 km ÷ 6 hours n Speed = 50 km/hr

More practice n n 1. How far can a plane travel if it flies 800 km/hr for 9 hours? 2. How long does it take a ship to go 500 km if it travels at a speed of 50 km/hr?

Answer 1. Δd V T Δd 800 9 800 km ▪ 9 hrs = 7200 km hr

Answer 2. Δd V T 500 50 T 500 km ÷ 50 km = 10 hrs hr

Instantaneous Speed n n Instantaneous speed is speed at any instant in time. A speedometer measures speed in ‘real time’ (the instantaneous speed).

Average Speed n n Average speed is the average of all instantaneous speeds; found simply by a total distance/total time ratio The average speed of a trip: Vavg = d 1 + d 2 + d 3 + d 4. . . . t 1 + t 2 + t 3 + t 4. .
. What")
Velocity n n n Speed in a given direction is velocity ( vector). What is the velocity of a boat that travels from St. John’s, west to Longpond (16 Km ) in 2. 5 h ?

Answer n Velocity = displacement ÷ time n Velocity = 16 Km ÷ 2. 5 h n Velocity = 6. 4 km/h west

Change your answer to m/s! n= 6. 4 km/h ÷ 3. 6 = 1. 8 m/s Km/hr to m/s conversion trick Km/hr m/s Divide by 3. 6 m/s multiply by 3. 6 K/hr
 Volume liters Distance")
Difference Between Speed and Velocity Scalar Quantities ( Number and unit) Volume liters Distance Voltage Speed (KM/h) Vector Quantities ( Number, unit and direction) 10 Km West 50 Km/hr south 100 newtons right Velocity (Speed and Direction) Speed is a Velocity is a Vector Scalar Quantity
 0 5")
Distance-time graphs n On your paper, graph the following: n D (m) 0 5 10 15 T (sec) 0 7 14 21

Was your graph a straight line? n. A distance-time graph which is a straight line indicates constant speed. n In constant speed, the object does not speed up or slow down. The acceleration is zero.

The Steeper the slope the faster the object is moving.

y 2 y 1 x 2 On a distance time graph for uniform motion the slope equals the average speed. Vavg = Δd Δt

What is the Vavg for this graph? 8 - 4 = 2 m/s 4– 2 2

Displacement Time Graphs n d Like distance time graphs only displacement can be either positive or negative, therefore we need two quadrants. t Moving left away from origin d t d Moving right toward origin from left t Stopped right of origin d t Stopped left of origin
 and")
Graphing ! d B A t C A … Starts at home (origin) and goes right (+) slowly B … Stopped (position remains constant as time progresses) C … Turns around and goes in the (-) direction quickly, passing by home

Explain what is happening for each leg of the trip.

Explain what is happening for each leg of the trip. What is the velocity for each leg of the trip? Hint: slope= rise/ run = Δ d t = d 2 – d 1 = Avg. velocity t 2 – t 1
 0 5 20 45")
Graph the following on a distancetime graph: n d (m) 0 5 20 45 80 125 t (s) 0 1 2 3 4 5

Was your graph a curve? n. A graph that curves on a distance -time graph shows that the object is accelerating ( nonuniform motion). n Acceleration.

Distance-time graphs n Describe the motion of the object as shown in the graph. From 0 -8 sec, constant speed: (25 m/sec); From 8 -12 sec, no motion (stop); From 12 -16 sec, acceleration; From 16 -20 sec, constant speed

Speed-time graphs n Using the distance-time graph from the last frame, draw a speed time graph. First fill in the table below: Average Speed (m/s) 25 ____ 0 ____ 37. 5 ____ Draw on board Time (sec) 0 to 8 8 to 12 12 to 20

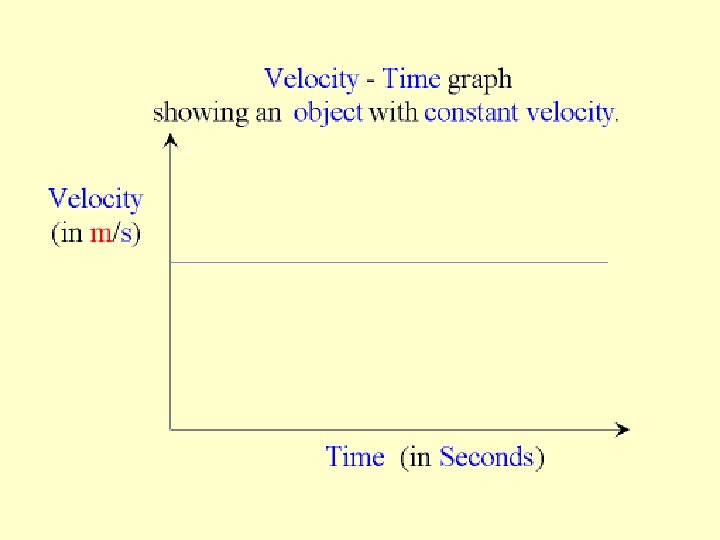
What does your graph look like? n Constant speed will be a horizontal line on a speed time graph. n If the speed decreases, the line will slant down. n If the speed increases, the line will slant up.

On a velocity - time graph the area between the graphed line and the x-axis equals the displacement Area = l x w = 6 s x 30 m/s = 180 m

This object is slowing down in a positive direction. It is non-uniform motion. However we can still calculate the displacement by finding the area of the triangle. ( ½ base x height ) Displacement = ½ base x height = ½ 25. 0 m/s x 25. 0 s = 312. 5 m Note how the units cancel.

Object is moving at a constant speed for 5. 0 s then it speeds up for the next 5. 0 sec. Displacement = area = = 10. 0 = = of rectangle + area of a triangle lxw + ½ base x height s x 5. 0 m/s + ½ 10. 0 m/s x 5. 0 s 50 m + 25 m 75 m
 Object moving right and slowing down. (+)")
Object moving right and speeding up. (+) Object moving right and slowing down. (+) Object moving left and speeding up. (-) Object moving left and slowing down (-)

The slope of the line on a velocity time graph equals the average acceleration. For uniform motion the graph is horizontal, therefore the slope is zero and the acceleration is zero.

d B C Graphing w/ Acceleration t A D A … Start from rest south of home; increase speed gradually B … Pass home; gradually slow to a stop (still moving north) C … Turn around; gradually speed back up again heading south D … Continue heading south; gradually slow to a stop near the starting point

Tangent Lines d On a position vs. time graph: The slope of a tangent line will give the velocity at that point in time. ( instantaneous velocity ) SLOPE VELOCITY Positive Negative Zero t

Graphing Tips The same rules apply in making an acceleration graph from a velocity graph. Just graph the slopes! Note: a positive constant slope in blue means a positive constant green segment. The steeper the blue slope, the farther the green segment is from the time axis. v t a t

Area under a velocity graph d “forward area” t “backward area” Area above the time axis = forward (positive) displacement. Area below the time axis = backward (negative) displacement. Net area (above - below) = net displacement. Total area (above + below) = total distance traveled.

d All 3 Graphs t v t a t

What do the following speed-time graphs depict?

Acceleration n Change n Can in velocity be change in speed or direction n Acceleration ∆V n a t = ∆V/ ∆T

Acceleration problem n A roller coaster’s velocity at the top of a hill is 10 m/s. Two seconds later it reaches the bottom of the hill with a velocity of 26 m/s. What is the acceleration of the roller coaster?

Answer n Acceleration = ∆V/ ∆T n a = 26 m/s – 10 m/s 2 s a = 16 m/s 2 s a = 8 m/s/s or 8 m/s 2

More acceleration problems n n n 1. A car accelerates at a rate of 20 Km/hr/s. How long does it take to reach a speed of 80 Km/hr? 2. A car travels at 60 Kilometers per hour around a curve. Is the car accelerating? 3. A car travels in a straight line at 60 Km/hr. Is the car accelerating?

Answers: 1. ∆V a t 80 Km/hr 20 Km/hr/ t 4 sec = t 2. yes! Because it’s changing direction! 3. no! It’s not changing speed or direction!

Deceleration n Negative acceleration n Example: A car slows from 60 Km/hr to 20 km/hr in 4 seconds. What is its acceleration?

Answer: Acceleration = ∆V/ ∆T n Acceleration = Vf – Vi t n a = 20 km/hr – 60 km/hr 4 s a = -40 Km/hr 4 s a = -10 Km/hr/s n

Velocity & Acceleration Sign Chart VELOCITY A C C E L E R A T I O N + - Moving forward; Moving backward; Speeding up Slowing down Moving forward; Moving backward; Slowing down Speeding up

Acceleration due to Gravity Near the surface of the Earth, all objects accelerate at the same rate (ignoring air resistance). This acceleration vector is the same on the way up, at the top, and on the way down! a = -g = -9. 8 m/s 2 Interpretation: Velocity decreases by 9. 8 m/s each second, meaning velocity is becoming less positive or more negative. Less positive means slowing down while going up. More negative means speeding up while going down.
 velocity of +10 m/s a")
Motion Graphs – Position vs. Time constant, rightward (+) velocity of +10 m/s a rightward (+), changing velocity - that is, a car that is moving rightward but speeding up or accelerating
 velocity of +10 m/s a")
Motion Graphs – Velocity vs. Time constant, rightward (+) velocity of +10 m/s a rightward (+), changing velocity - that is, a car that is moving rightward but speeding up or accelerating

Review: Distance-time graph of acceleration

Distance-time graph of deceleration

Review: Speed-time graph of acceleration

Review: Speed-time graph of deceleration

Review: Distance-time graph of constant speed

- Slides: 66