Relationship between phytoplankton blooming and windstress in the

Relationship between phytoplankton blooming and windstress in the sub-polar frontal area of the Japan/East Sea Hyun-cheol Kim 1, 2, Sinjae Yoo 1, and Im Sang Oh 2 KORDI 1 SNU 2
. ”Seasonal and interannual variability of sea")
Background & Objective u Yamada et al. (2004). ”Seasonal and interannual variability of sea surface chlorophyll a concentration in the Japan/East Sea (JES)” § There are remarkable springs blooms and fall blooms in the Japan/East Sea, as was observed from Sea. Wi. FS chlorophyll a during 1997 to 2003 § There are interannual variability in the start timing of the spring blooms and fall blooms and of their spatial distributions. § Among many forcing variables, wind plays an important role in determining the vernal stratification process, which in turn determines bloom timing in temperate water. u In this presentation, We try to reveal the relationship between bloom process and with two hypotheses.

Variability of Chlorophyll a & Windstress in the Japan/East Sea Mean Chlorophyll a 1997~2003 Mean Wind Stress 1999~2003

SST CHL Standard deviation 2000~2003

WIND MLD Standard deviation 2000~2003

Variability of CHL, Wind and PAR 1997~2003 Normalized Values Green Bar : Weekly CHL, Red line : Daily Wind stress, Black line : Weekly PAR Julian day

Hypotheses Hypothesis 1: The timing of spring bloom n As the season progresses, the wind in spring becomes weaker and solar radiation gets stronger than in winter. n These will accelerate thermal stratification in the upper layer. n Stronger wind events in spring could delay the timing of blooming, while weaker wind events could advance the timing.

Hypotheses Hypothesis 2. The timing of fall bloom n During summers, the phytoplankton biomass in the upper layer is kept low by grazing and low growth rate limited by nutrients due to stratification. n Monsoon wind is reversed in direction and gets stronger in fall. n The water column is destratified by stronger wind and weakened solar radiation and nutrients are supplied to the upper layer. Growth are activated. n Stronger wind events in fall could advance the timing of blooming, while weaker wind events could delay the timing.

Light-nutrient hypothesis and seasonal growth cycles in the temperate waters

Previous studies o The stirring of the upper layers, by convective overturn and winds, is the major mechanism for regulating phytoplankton growth n o The role of wind stress in the spring bloom n o Sverdrub(1953), Cushing(1962), Evans and Paslow(1985), Yentsch(1990) Goffart et al. (2002), Saitoh et al. (2002), Smayda (2002), Weise et al. (2002), Eslinger et al. (2001), Babaran et al. (1998), Tester et al. (1998), Lancelot et al. (1997), Brooks et al. (1993), Brooks et al. (1985) Wind-driven Upwelling (nutrient resupply to the euphotic zone) n Tang et al. (2003), Ryan et al. (2002), Roegner et al. (2002), Trainer et al. (2002).

Data n Ocean Color § § n SST § n § FNMOC (U. S. Navy’s Fleet Numerical Meteorogy and Oceanography Center: 2000~2003) PAR § § § n AMI-Wind, NSCAT (ERS, NSCAT: 1991~1998) Sea. Winds (Quick. SCAT: 1999~2003) MLD (model) § n MODIS (Terra: 2000~2003) Windstress (MWF) § n Sea. Wi. FS (Sea. Star: 1997~2003) MODIS (Terra: 2000~2003) Sea. Wi. FS(1997~2003) MODIS(2000~2003) NCEP reanalysis 2. KODC

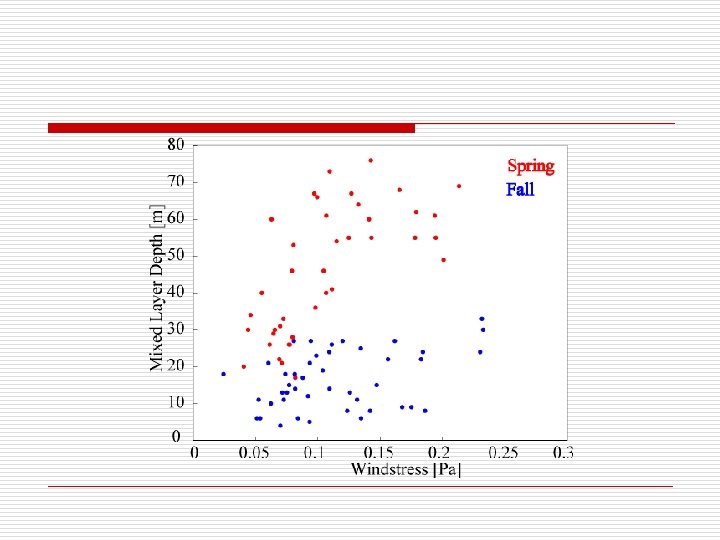
Spring

Fall
")
Averaged Monthly Trends (1997 – 2003)
 and MLD (KODC) in APRIL sub-polar frontal area of the")
CHL (Sea. Wi. FS) and MLD (KODC) in APRIL sub-polar frontal area of the Japan/East Sea

Daily CHL and Windstress 1997 -2003 Chlorophyll a Wind Stress

Time lag between Wind anomaly and CHL response in Spring Julian day • Red line is CUSUM of wind anomaly CUSUM: Cumulative Sum

Time lag between Wind anomaly and CHL response in Fall * Red line is CUSUM of wind anomaly

Previous studies about time lag The role of wind stress in the spring bloom n n n Weise et al. (2002): wind>8 m/s disrupt blooms. Yin et al. (1996): wind speed > 4 m/s interrupt the spring bloom. Wind decrease ► NO 3 decreased after 5 days ► bloom occurred after 9 days. Bleiker and Schanz (1997): wind decrease ► growth occurred after 7 to 10 days Wind-driven Upwelling (nutrient resupply to the euphotic zone) n n Yin et al. (1997): bloom occurred soon after the wind. Marra et al. (1990): wind increase ► increase in nitrate concentration in the euphotic zone ► bloom over the next 2 days
 o The light limiting part n n n")
Light & Nutrient MODEL (Yentch, 1990) o The light limiting part n n n o P(z) = Pmax tanhαI(z)/ Pmax R=a Pmax P/R=∫Zm Pdz/ ∫Zm Rdz The nutrient limiting part n n NZm= ∫Zm N(z)dz PN=[(P/R-1)/5] NZm P: Phytoplankton Photosynthesis R: Respiration N: Nitrate concentration Zm: Mixed layer depth a: respiration ratio

Windstress & Mixed layer depth Blue line: Windstress Red line: Mixed layer depth

Chlorophyll a & PN & Mixed Layer depth ( Respiration ratio : bold line = 10 %, dashed line = 20%) Blue line: Mixed layer depth Red line: Particulate nitrate Green area: Chlorophyll

Conclusion From above results, our hypotheses are well supported as follows. u In the sub-polar front of the Japan/East sea n Hypothesis 1: Stronger wind events in spring could delay the timing of blooming, while weaker wind events could advance the timing o n Spring bloom occurs in 7 to 10 days after wind. Hypothesis 2: Stronger wind events in fall could advance the timing of blooming, while weaker wind events could delay the timing. o Fall bloom occurs after 1 to 4 days with increasing seasonal wind.

Thank you.

Result: Light limiting Chlorophyll a & P/R & Mixed Layer depth Blue line: Mixed layer depth Red line: P: R ratio Green area: Chlorophyll
- Slides: 26