
REGULATORY REQUIREMENTS 1 Plan Review Pilot Study Approval

- Slides: 99
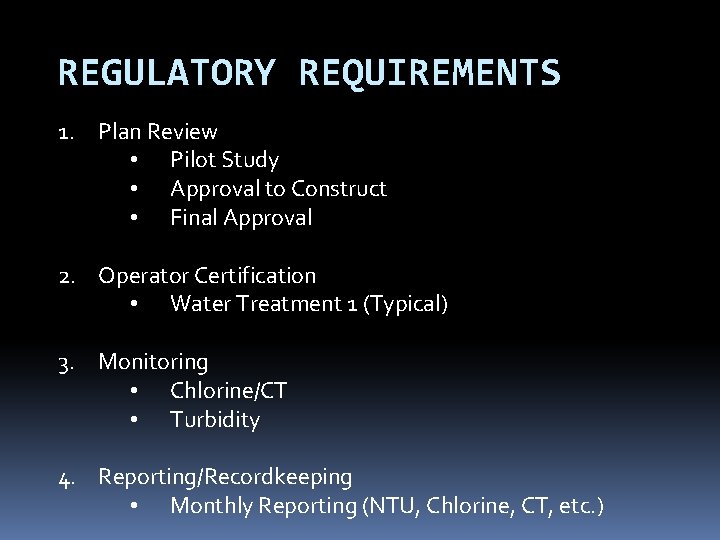
REGULATORY REQUIREMENTS 1. Plan Review • Pilot Study • Approval to Construct • Final Approval 2. Operator Certification • Water Treatment 1 (Typical) 3. Monitoring • Chlorine/CT • Turbidity 4. Reporting/Recordkeeping • Monthly Reporting (NTU, Chlorine, CT, etc. )
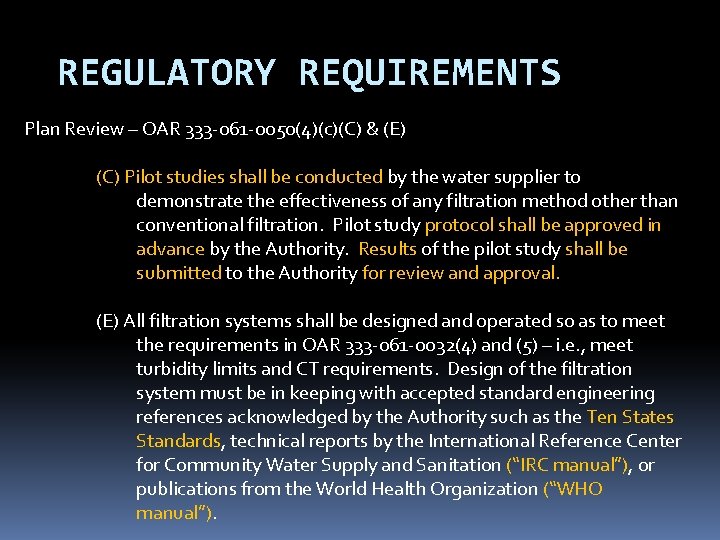
REGULATORY REQUIREMENTS Plan Review – OAR 333 -061 -0050(4)(c)(C) & (E) (C) Pilot studies shall be conducted by the water supplier to demonstrate the effectiveness of any filtration method other than conventional filtration. Pilot study protocol shall be approved in advance by the Authority. Results of the pilot study shall be submitted to the Authority for review and approval. (E) All filtration systems shall be designed and operated so as to meet the requirements in OAR 333 -061 -0032(4) and (5) – i. e. , meet turbidity limits and CT requirements. Design of the filtration system must be in keeping with accepted standard engineering references acknowledged by the Authority such as the Ten States Standards, technical reports by the International Reference Center for Community Water Supply and Sanitation (“IRC manual”), or publications from the World Health Organization (“WHO manual”).
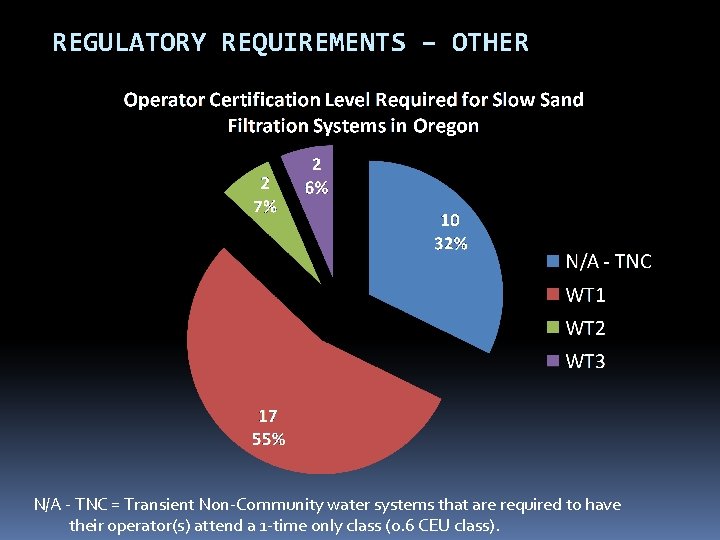
REGULATORY REQUIREMENTS – OTHER N/A - TNC = Transient Non-Community water systems that are required to have their operator(s) attend a 1 -time only class (0. 6 CEU class).
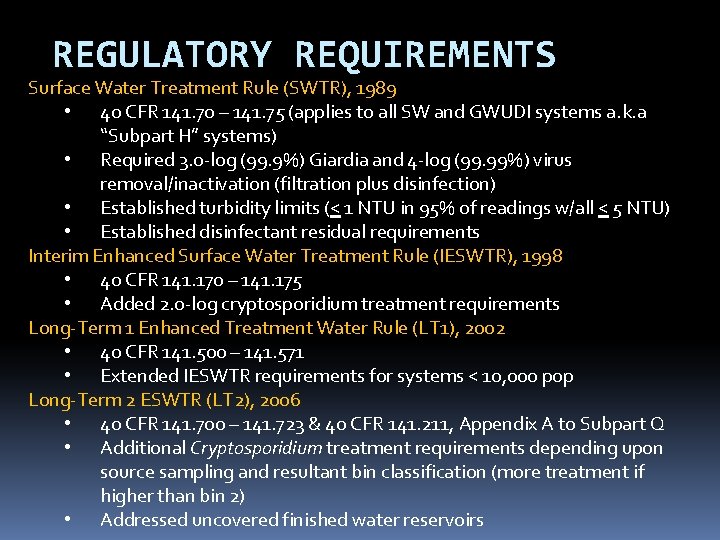
REGULATORY REQUIREMENTS Surface Water Treatment Rule (SWTR), 1989 • 40 CFR 141. 70 – 141. 75 (applies to all SW and GWUDI systems a. k. a “Subpart H” systems) • Required 3. o-log (99. 9%) Giardia and 4 -log (99. 99%) virus removal/inactivation (filtration plus disinfection) • Established turbidity limits (< 1 NTU in 95% of readings w/all < 5 NTU) • Established disinfectant residual requirements Interim Enhanced Surface Water Treatment Rule (IESWTR), 1998 • 40 CFR 141. 170 – 141. 175 • Added 2. 0 -log cryptosporidium treatment requirements Long-Term 1 Enhanced Treatment Water Rule (LT 1), 2002 • 40 CFR 141. 500 – 141. 571 • Extended IESWTR requirements for systems < 10, 000 pop Long-Term 2 ESWTR (LT 2), 2006 • 40 CFR 141. 700 – 141. 723 & 40 CFR 141. 211, Appendix A to Subpart Q • Additional Cryptosporidium treatment requirements depending upon source sampling and resultant bin classification (more treatment if higher than bin 2) • Addressed uncovered finished water reservoirs
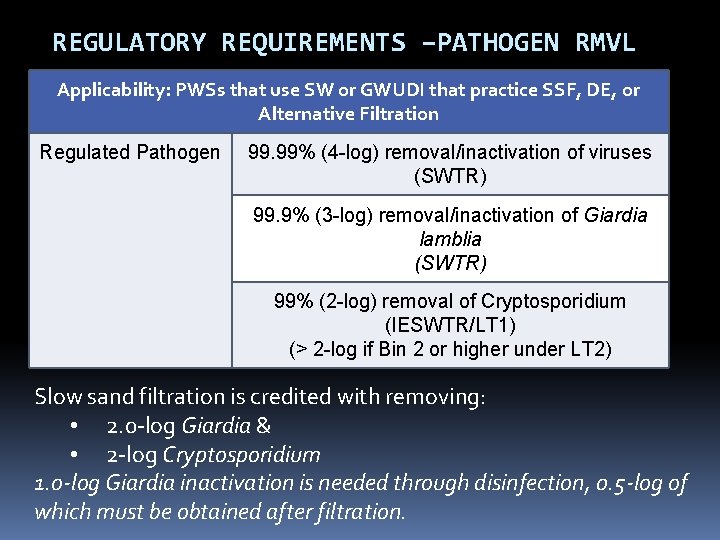
REGULATORY REQUIREMENTS –PATHOGEN RMVL Applicability: PWSs that use SW or GWUDI that practice SSF, DE, or Alternative Filtration Regulated Pathogen 99. 99% (4 -log) removal/inactivation of viruses (SWTR) 99. 9% (3 -log) removal/inactivation of Giardia lamblia (SWTR) 99% (2 -log) removal of Cryptosporidium (IESWTR/LT 1) (> 2 -log if Bin 2 or higher under LT 2) Slow sand filtration is credited with removing: • 2. 0 -log Giardia & • 2 -log Cryptosporidium 1. o-log Giardia inactivation is needed through disinfection, 0. 5 -log of which must be obtained after filtration.
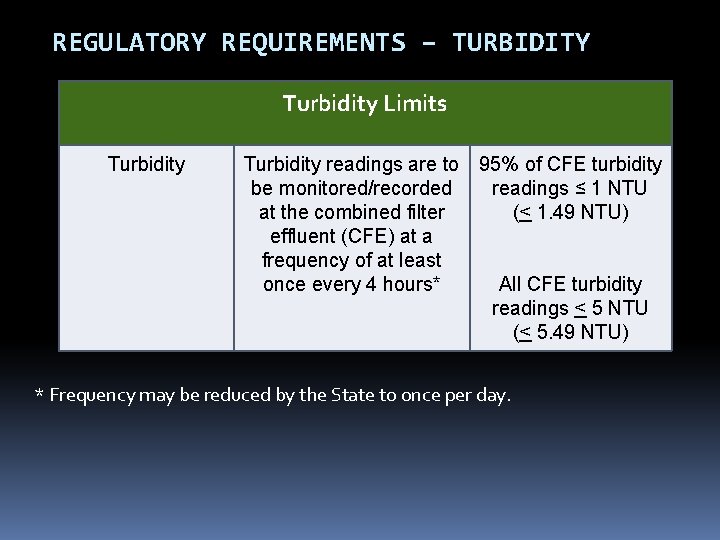
REGULATORY REQUIREMENTS – TURBIDITY Turbidity Limits Turbidity readings are to 95% of CFE turbidity be monitored/recorded readings ≤ 1 NTU at the combined filter (< 1. 49 NTU) effluent (CFE) at a frequency of at least once every 4 hours* All CFE turbidity readings < 5 NTU (< 5. 49 NTU) * Frequency may be reduced by the State to once per day.
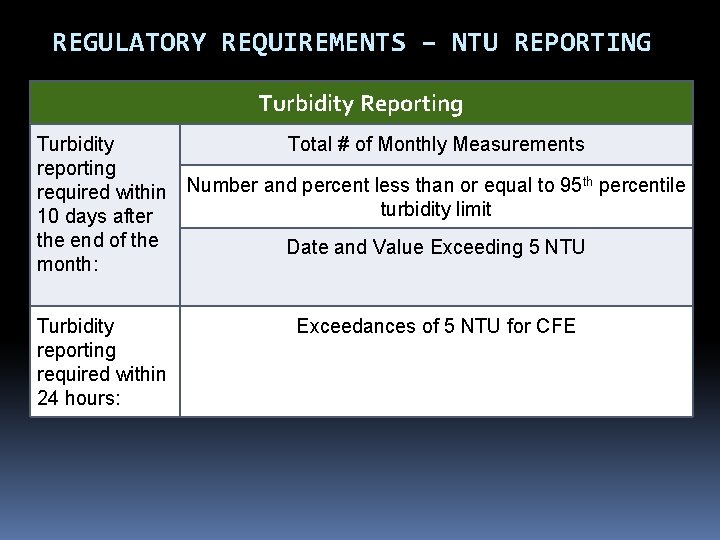
REGULATORY REQUIREMENTS – NTU REPORTING Turbidity Reporting Turbidity Total # of Monthly Measurements reporting th required within Number and percent less than or equal to 95 percentile turbidity limit 10 days after the end of the Date and Value Exceeding 5 NTU month: Turbidity reporting required within 24 hours: Exceedances of 5 NTU for CFE
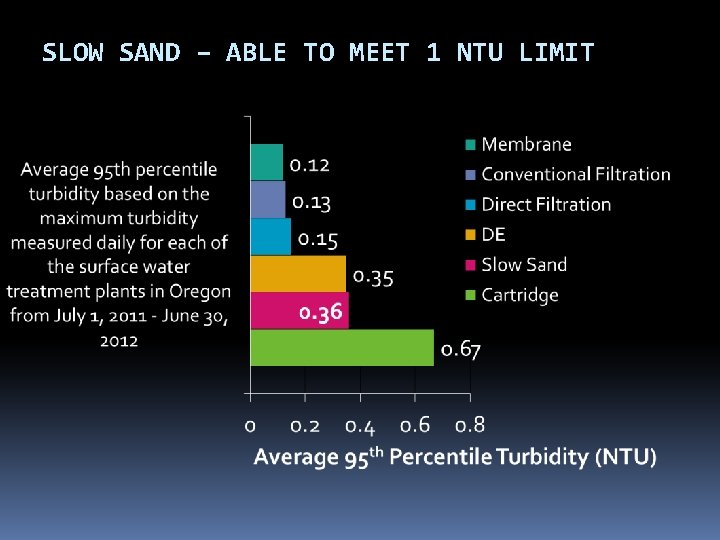
SLOW SAND – ABLE TO MEET 1 NTU LIMIT
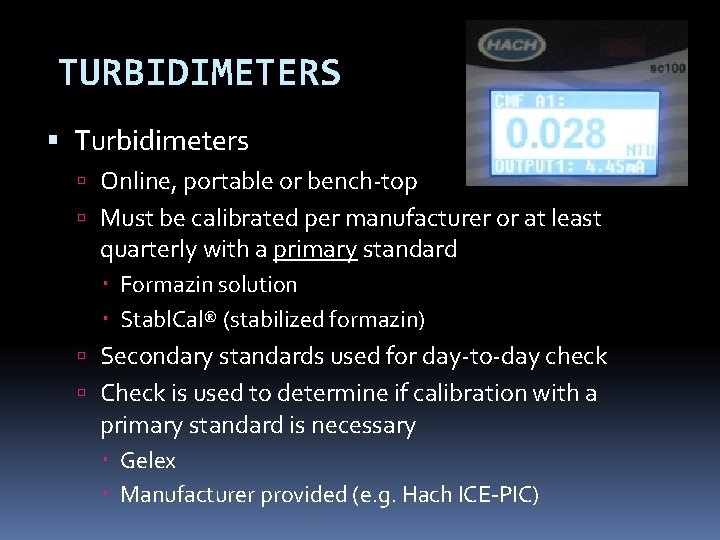
TURBIDIMETERS Turbidimeters Online, portable or bench-top Must be calibrated per manufacturer or at least quarterly with a primary standard Formazin solution Stabl. Cal® (stabilized formazin) Secondary standards used for day-to-day check Check is used to determine if calibration with a primary standard is necessary Gelex Manufacturer provided (e. g. Hach ICE-PIC)
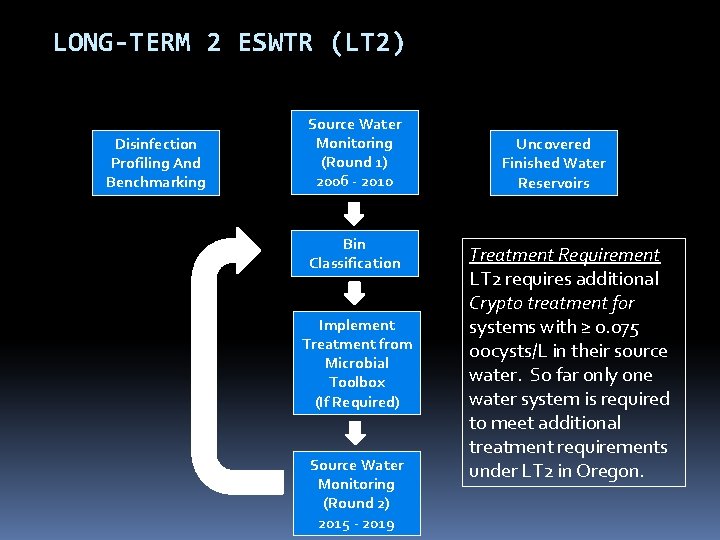
LONG-TERM 2 ESWTR (LT 2) Disinfection Profiling And Benchmarking Source Water Monitoring (Round 1) 2006 - 2010 Bin Classification Implement Treatment from Microbial Toolbox (If Required) Source Water Monitoring (Round 2) 2015 - 2019 Uncovered Finished Water Reservoirs Treatment Requirement LT 2 requires additional Crypto treatment for systems with ≥ 0. 075 oocysts/L in their source water. So far only one water system is required to meet additional treatment requirements under LT 2 in Oregon.
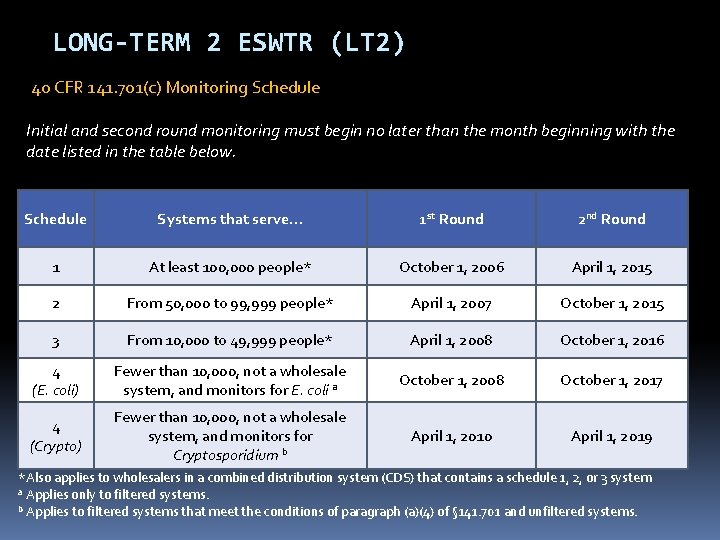
LONG-TERM 2 ESWTR (LT 2) 40 CFR 141. 701(c) Monitoring Schedule Initial and second round monitoring must begin no later than the month beginning with the date listed in the table below. Schedule Systems that serve… 1 st Round 2 nd Round 1 At least 100, 000 people* October 1, 2006 April 1, 2015 2 From 50, 000 to 99, 999 people* April 1, 2007 October 1, 2015 3 From 10, 000 to 49, 999 people* April 1, 2008 October 1, 2016 4 (E. coli) Fewer than 10, 000, not a wholesale system, and monitors for E. coli a October 1, 2008 October 1, 2017 4 (Crypto) Fewer than 10, 000, not a wholesale system, and monitors for Cryptosporidium b April 1, 2010 April 1, 2019 *Also applies to wholesalers in a combined distribution system (CDS) that contains a schedule 1, 2, or 3 system a Applies only to filtered systems. b Applies to filtered systems that meet the conditions of paragraph (a)(4) of § 141. 701 and unfiltered systems.
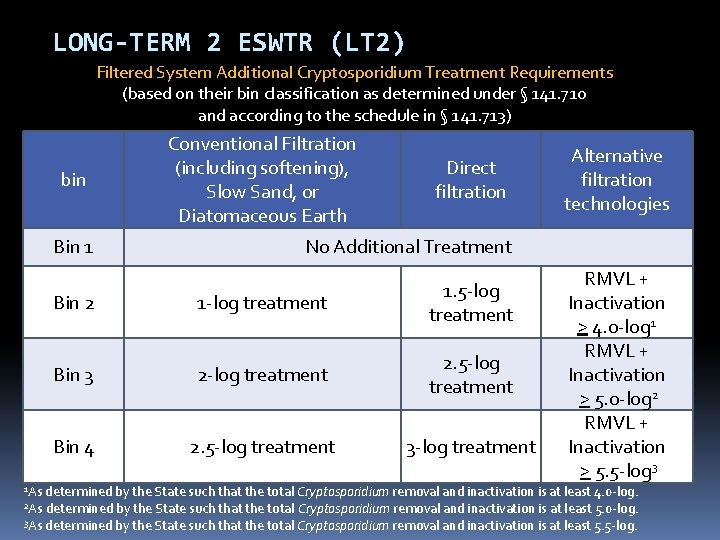
LONG-TERM 2 ESWTR (LT 2) Filtered System Additional Cryptosporidium Treatment Requirements (based on their bin classification as determined under § 141. 710 and according to the schedule in § 141. 713) bin 1 As Conventional Filtration (including softening), Slow Sand, or Diatomaceous Earth Direct filtration Bin 1 No Additional Treatment Bin 2 1 -log treatment 1. 5 -log treatment Bin 3 2 -log treatment 2. 5 -log treatment Bin 4 2. 5 -log treatment 3 -log treatment Alternative filtration technologies RMVL + Inactivation > 4. 0 -log 1 RMVL + Inactivation > 5. 0 -log 2 RMVL + Inactivation > 5. 5 -log 3 determined by the State such that the total Cryptosporidium removal and inactivation is at least 4. 0 -log. determined by the State such that the total Cryptosporidium removal and inactivation is at least 5. 0 -log. 3 As determined by the State such that the total Cryptosporidium removal and inactivation is at least 5. 5 -log. 2 As
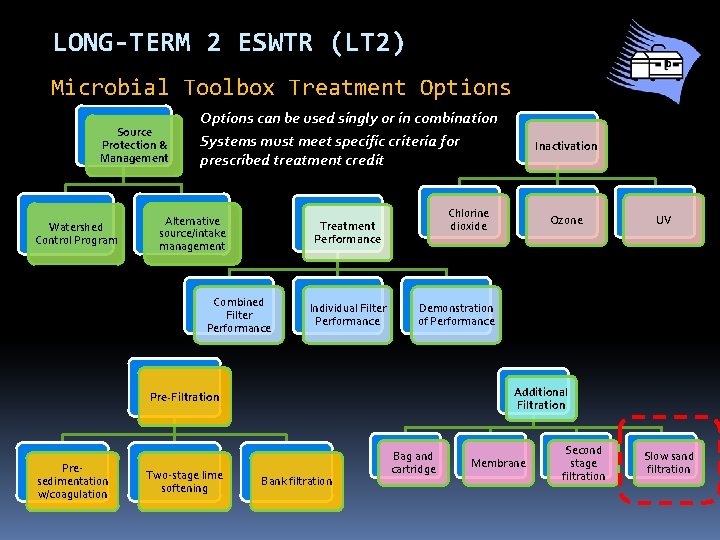
LONG-TERM 2 ESWTR (LT 2) Microbial Toolbox Treatment Options Source Protection & Management Watershed Control Program Options can be used singly or in combination Systems must meet specific criteria for prescribed treatment credit Alternative source/intake management Chlorine dioxide Treatment Performance Combined Filter Performance Individual Filter Performance Two-stage lime softening Ozone UV Demonstration of Performance Additional Filtration Pre-Filtration Presedimentation w/coagulation Inactivation Bank filtration Bag and cartridge Membrane Second stage filtration Slow sand filtration
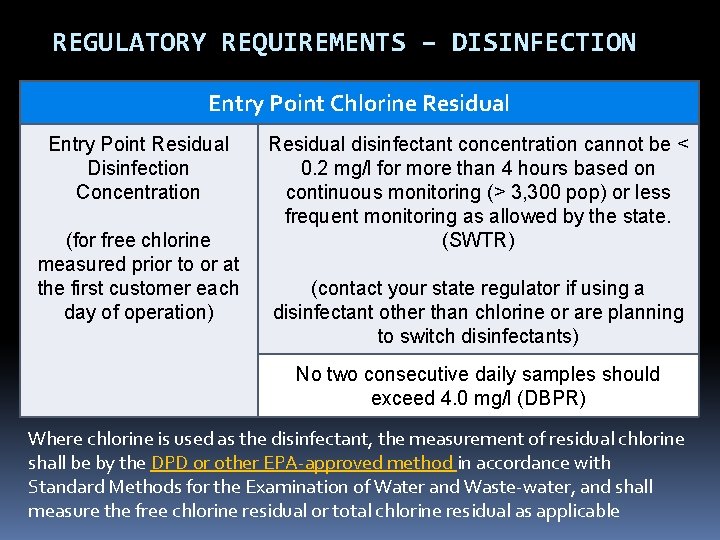
REGULATORY REQUIREMENTS – DISINFECTION Entry Point Chlorine Residual Entry Point Residual Disinfection Concentration (for free chlorine measured prior to or at the first customer each day of operation) Residual disinfectant concentration cannot be < 0. 2 mg/l for more than 4 hours based on continuous monitoring (> 3, 300 pop) or less frequent monitoring as allowed by the state. (SWTR) (contact your state regulator if using a disinfectant other than chlorine or are planning to switch disinfectants) No two consecutive daily samples should exceed 4. 0 mg/l (DBPR) Where chlorine is used as the disinfectant, the measurement of residual chlorine shall be by the DPD or other EPA-approved method in accordance with Standard Methods for the Examination of Water and Waste-water, and shall measure the free chlorine residual or total chlorine residual as applicable
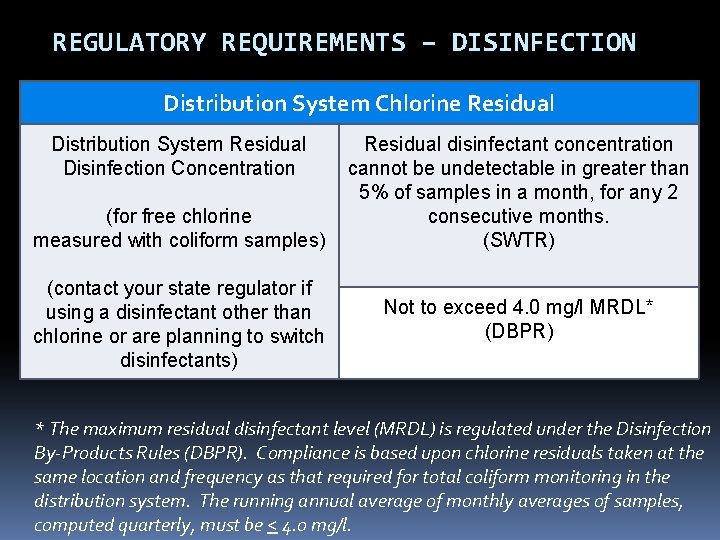
REGULATORY REQUIREMENTS – DISINFECTION Distribution System Chlorine Residual Distribution System Residual Disinfection Concentration (for free chlorine measured with coliform samples) (contact your state regulator if using a disinfectant other than chlorine or are planning to switch disinfectants) Residual disinfectant concentration cannot be undetectable in greater than 5% of samples in a month, for any 2 consecutive months. (SWTR) Not to exceed 4. 0 mg/l MRDL* (DBPR) * The maximum residual disinfectant level (MRDL) is regulated under the Disinfection By-Products Rules (DBPR). Compliance is based upon chlorine residuals taken at the same location and frequency as that required for total coliform monitoring in the distribution system. The running annual average of monthly averages of samples, computed quarterly, must be < 4. 0 mg/l.
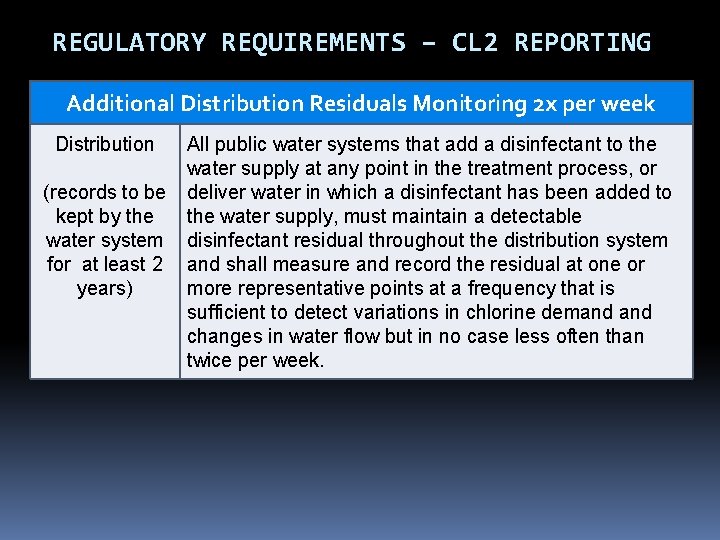
REGULATORY REQUIREMENTS – CL 2 REPORTING Additional Distribution Residuals Monitoring 2 x per week Distribution (records to be kept by the water system for at least 2 years) All public water systems that add a disinfectant to the water supply at any point in the treatment process, or deliver water in which a disinfectant has been added to the water supply, must maintain a detectable disinfectant residual throughout the distribution system and shall measure and record the residual at one or more representative points at a frequency that is sufficient to detect variations in chlorine demand changes in water flow but in no case less often than twice per week.
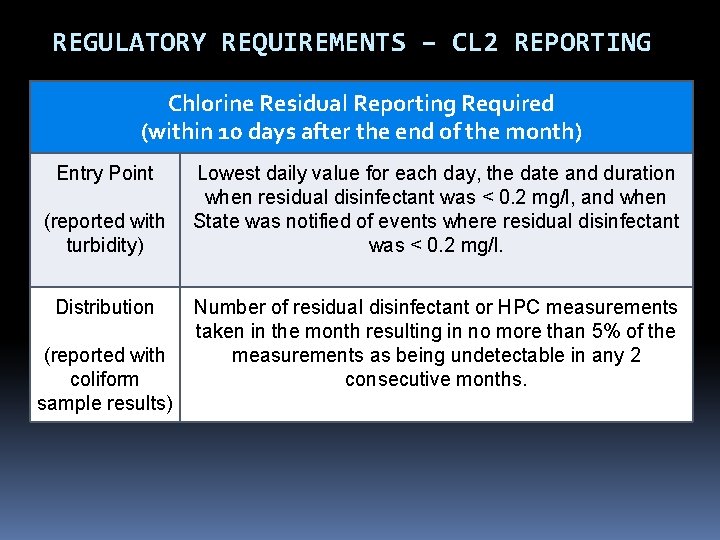
REGULATORY REQUIREMENTS – CL 2 REPORTING Chlorine Residual Reporting Required (within 10 days after the end of the month) Entry Point (reported with turbidity) Distribution (reported with coliform sample results) Lowest daily value for each day, the date and duration when residual disinfectant was < 0. 2 mg/l, and when State was notified of events where residual disinfectant was < 0. 2 mg/l. Number of residual disinfectant or HPC measurements taken in the month resulting in no more than 5% of the measurements as being undetectable in any 2 consecutive months.
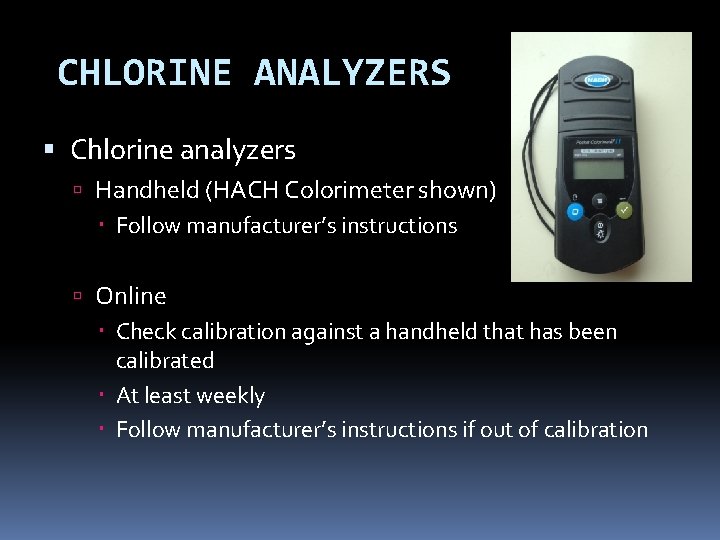
CHLORINE ANALYZERS Chlorine analyzers Handheld (HACH Colorimeter shown) Follow manufacturer’s instructions Online Check calibration against a handheld that has been calibrated At least weekly Follow manufacturer’s instructions if out of calibration
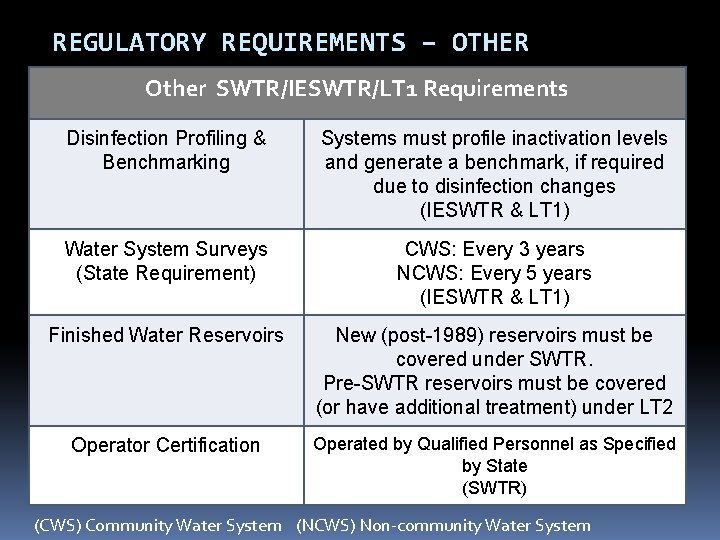
REGULATORY REQUIREMENTS – OTHER Other SWTR/IESWTR/LT 1 Requirements Disinfection Profiling & Benchmarking Systems must profile inactivation levels and generate a benchmark, if required due to disinfection changes (IESWTR & LT 1) Water System Surveys (State Requirement) CWS: Every 3 years NCWS: Every 5 years (IESWTR & LT 1) Finished Water Reservoirs New (post-1989) reservoirs must be covered under SWTR. Pre-SWTR reservoirs must be covered (or have additional treatment) under LT 2 Operator Certification Operated by Qualified Personnel as Specified by State (SWTR) (CWS) Community Water System (NCWS) Non-community Water System
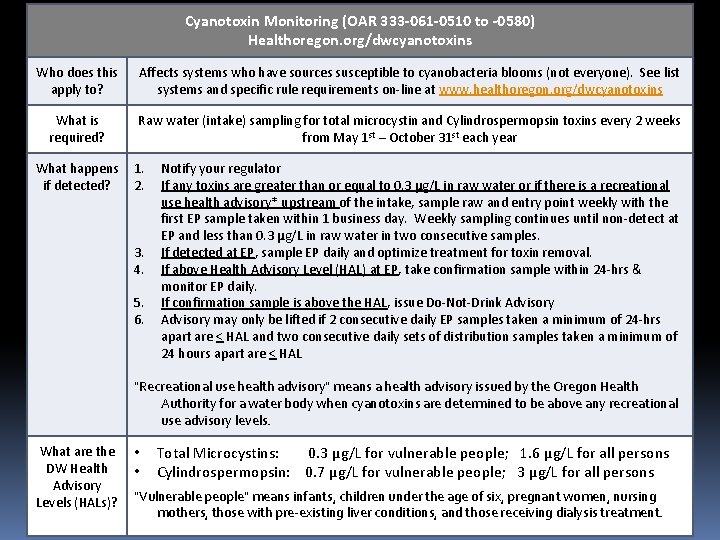
Cyanotoxin Monitoring (OAR 333 -061 -0510 to -0580) Healthoregon. org/dwcyanotoxins REGULATORY REQUIREMENTS – OTHER Who does this apply to? Affects systems who have sources susceptible to cyanobacteria blooms (not everyone). See list systems and specific rule requirements on-line at www. healthoregon. org/dwcyanotoxins What is required? Raw water (intake) sampling for total microcystin and Cylindrospermopsin toxins every 2 weeks from May 1 st – October 31 st each year What happens if detected? 1. 2. 3. 4. 5. 6. Notify your regulator If any toxins are greater than or equal to 0. 3 µg/L in raw water or if there is a recreational use health advisory* upstream of the intake, sample raw and entry point weekly with the first EP sample taken within 1 business day. Weekly sampling continues until non-detect at EP and less than 0. 3 µg/L in raw water in two consecutive samples. If detected at EP, sample EP daily and optimize treatment for toxin removal. If above Health Advisory Level (HAL) at EP, take confirmation sample within 24 -hrs & monitor EP daily. If confirmation sample is above the HAL, issue Do-Not-Drink Advisory may only be lifted if 2 consecutive daily EP samples taken a minimum of 24 -hrs apart are < HAL and two consecutive daily sets of distribution samples taken a minimum of 24 hours apart are < HAL "Recreational use health advisory" means a health advisory issued by the Oregon Health Authority for a water body when cyanotoxins are determined to be above any recreational use advisory levels. What are the DW Health Advisory Levels (HALs)? • • Total Microcystins: 0. 3 µg/L for vulnerable people; 1. 6 µg/L for all persons Cylindrospermopsin: 0. 7 µg/L for vulnerable people; 3 µg/L for all persons "Vulnerable people" means infants, children under the age of six, pregnant women, nursing mothers, those with pre-existing liver conditions, and those receiving dialysis treatment.
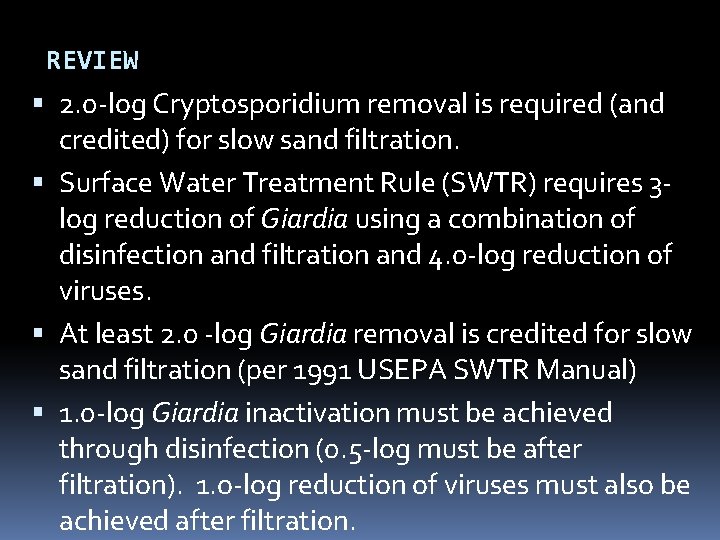
REVIEW 2. 0 -log Cryptosporidium removal is required (and credited) for slow sand filtration. Surface Water Treatment Rule (SWTR) requires 3 log reduction of Giardia using a combination of disinfection and filtration and 4. 0 -log reduction of viruses. At least 2. 0 -log Giardia removal is credited for slow sand filtration (per 1991 USEPA SWTR Manual) 1. 0 -log Giardia inactivation must be achieved through disinfection (0. 5 -log must be after filtration). 1. o-log reduction of viruses must also be achieved after filtration.
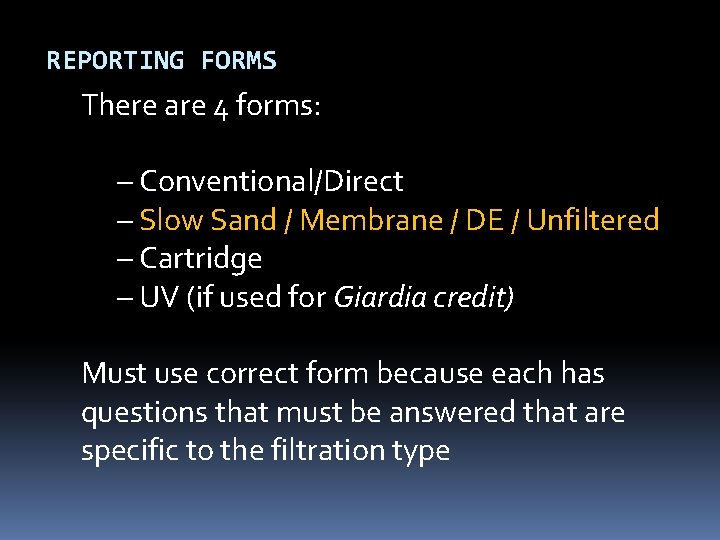
REPORTING FORMS There are 4 forms: – Conventional/Direct – Slow Sand / Membrane / DE / Unfiltered – Cartridge – UV (if used for Giardia credit) Must use correct form because each has questions that must be answered that are specific to the filtration type
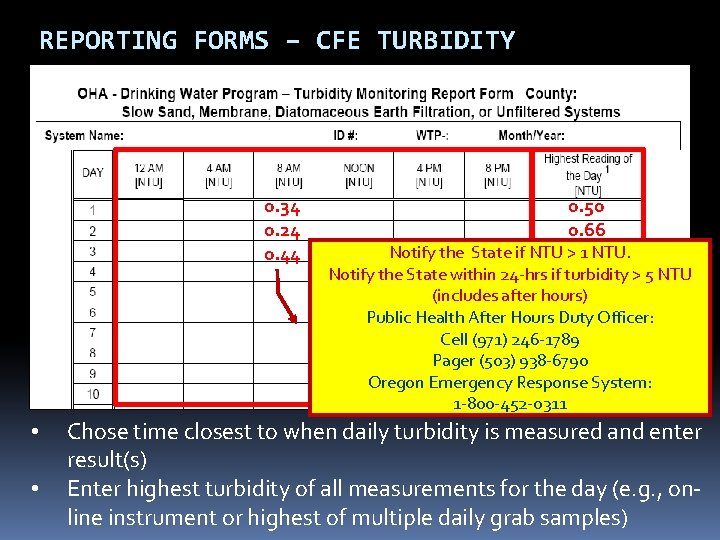
REPORTING FORMS – CFE TURBIDITY 0. 34 0. 24 0. 44 • • 0. 50 0. 66 Notify the State if NTU >0. 46 1 NTU. Notify the State within 24 -hrs if turbidity > 5 NTU (includes after hours) Public Health After Hours Duty Officer: Cell (971) 246 -1789 Pager (503) 938 -6790 Oregon Emergency Response System: 1 -800 -452 -0311 Chose time closest to when daily turbidity is measured and enter result(s) Enter highest turbidity of all measurements for the day (e. g. , online instrument or highest of multiple daily grab samples)
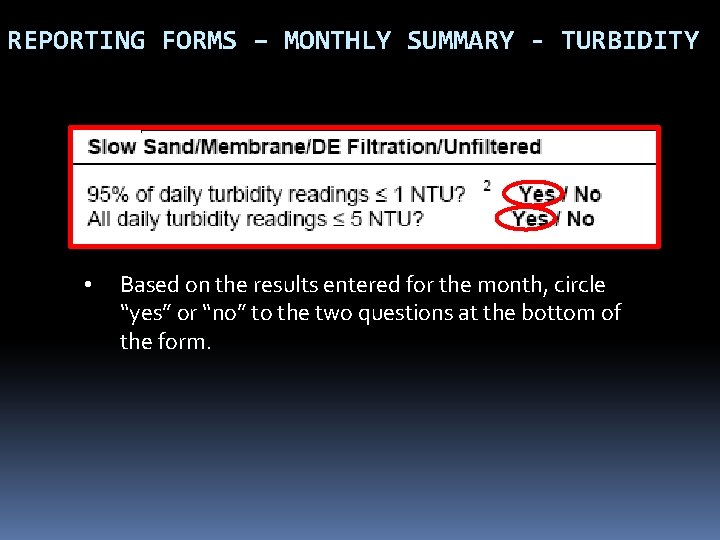
REPORTING FORMS – MONTHLY SUMMARY - TURBIDITY • Based on the results entered for the month, circle “yes” or “no” to the two questions at the bottom of the form.
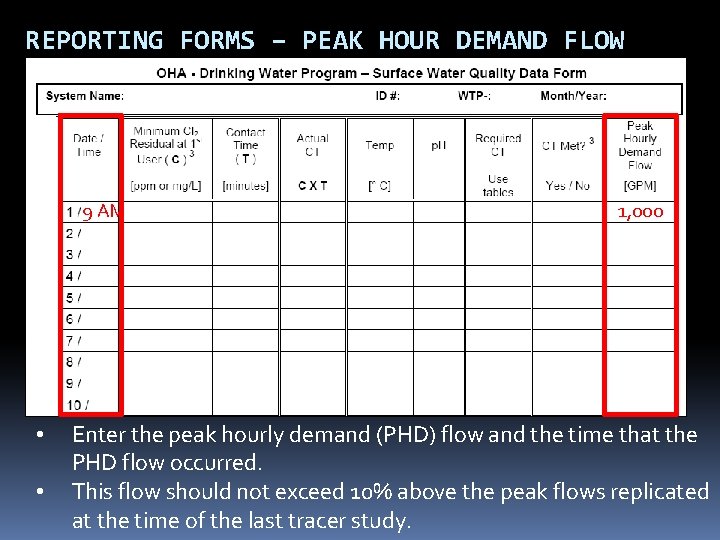
REPORTING FORMS – PEAK HOUR DEMAND FLOW 9 AM • • 1, 000 Enter the peak hourly demand (PHD) flow and the time that the PHD flow occurred. This flow should not exceed 10% above the peak flows replicated at the time of the last tracer study.
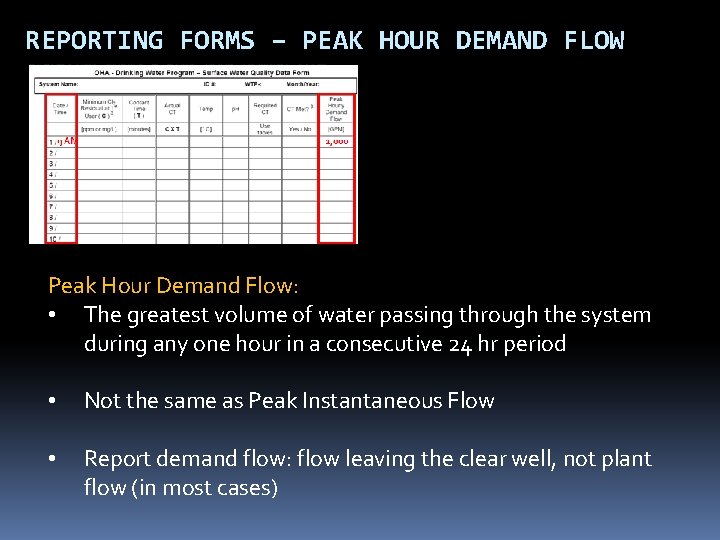
REPORTING FORMS – PEAK HOUR DEMAND FLOW Peak Hour Demand Flow: • The greatest volume of water passing through the system during any one hour in a consecutive 24 hr period • Not the same as Peak Instantaneous Flow • Report demand flow: flow leaving the clear well, not plant flow (in most cases)
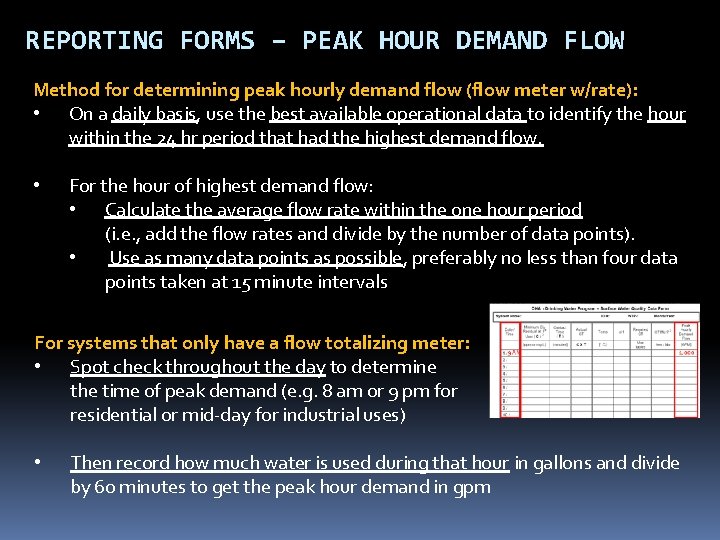
REPORTING FORMS – PEAK HOUR DEMAND FLOW Method for determining peak hourly demand flow (flow meter w/rate): • On a daily basis, use the best available operational data to identify the hour within the 24 hr period that had the highest demand flow. • For the hour of highest demand flow: • Calculate the average flow rate within the one hour period (i. e. , add the flow rates and divide by the number of data points). • Use as many data points as possible, preferably no less than four data points taken at 15 minute intervals For systems that only have a flow totalizing meter: • Spot check throughout the day to determine the time of peak demand (e. g. 8 am or 9 pm for residential or mid-day for industrial uses) • Then record how much water is used during that hour in gallons and divide by 60 minutes to get the peak hour demand in gpm
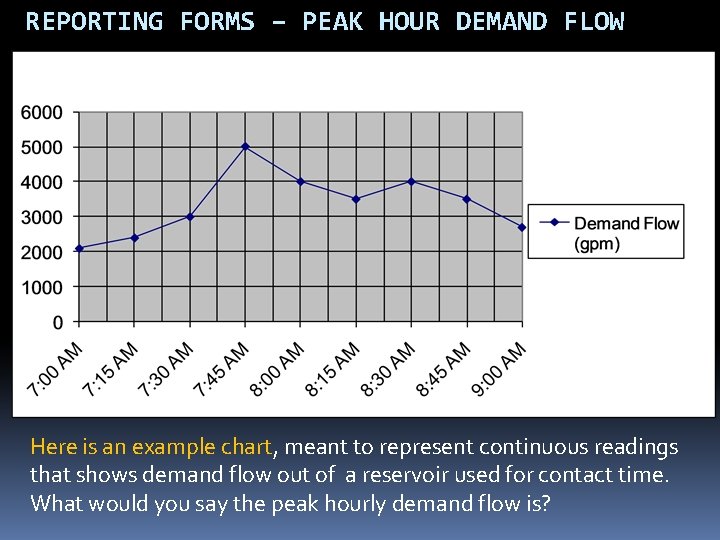
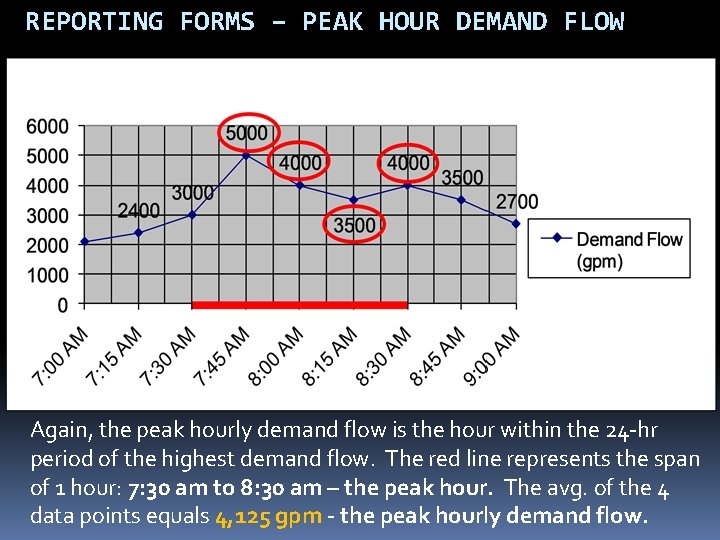
REPORTING FORMS – PEAK HOUR DEMAND FLOW Here is an example chart, meant to represent continuous readings that shows demand flow out of a reservoir used for contact time. What would you say the peak hourly demand flow is?
REPORTING FORMS – PEAK HOUR DEMAND FLOW Again, the peak hourly demand flow is the hour within the 24 -hr period of the highest demand flow. The red line represents the span of 1 hour: 7: 30 am to 8: 30 am – the peak hour. The avg. of the 4 data points equals 4, 125 gpm - the peak hourly demand flow.
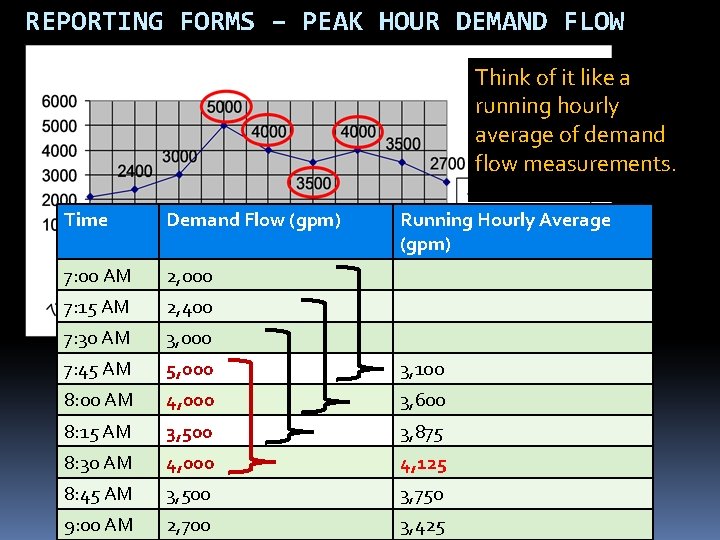
REPORTING FORMS – PEAK HOUR DEMAND FLOW Think of it like a running hourly average of demand flow measurements. Time Demand Flow (gpm) Running Hourly Average (gpm) 7: 00 AM 2, 000 7: 15 AM 2, 400 7: 30 AM 3, 000 7: 45 AM 5, 000 3, 100 8: 00 AM 4, 000 3, 600 8: 15 AM 3, 500 3, 875 8: 30 AM 4, 000 4, 125 8: 45 AM 3, 500 3, 750 9: 00 AM 2, 700 3, 425
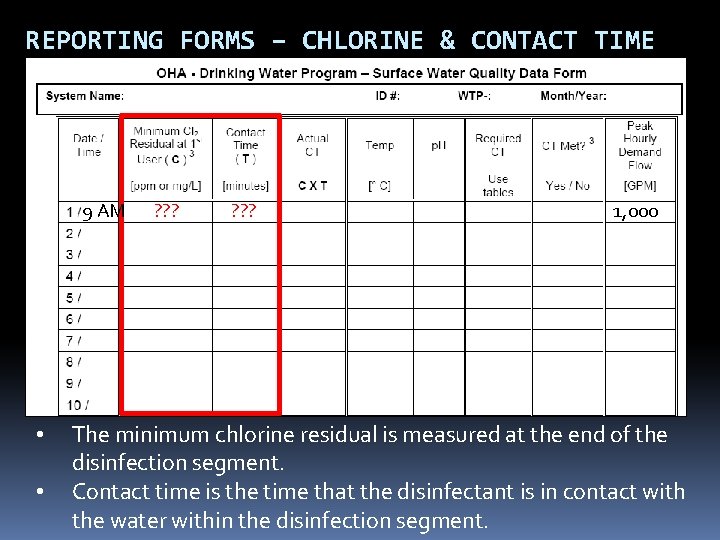
REPORTING FORMS – CHLORINE & CONTACT TIME 9 AM • • ? ? ? 1, 000 The minimum chlorine residual is measured at the end of the disinfection segment. Contact time is the time that the disinfectant is in contact with the water within the disinfection segment.
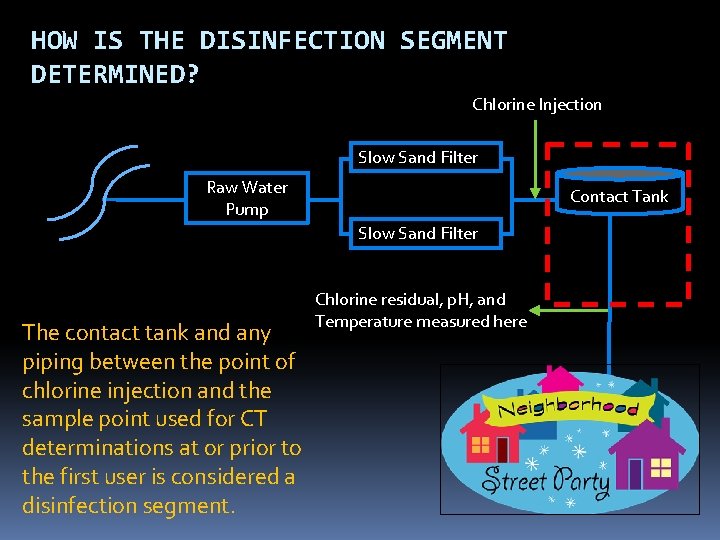
HOW IS THE DISINFECTION SEGMENT DETERMINED? Chlorine Injection Slow Sand Filter Raw Water Pump Contact Tank Slow Sand Filter The contact tank and any piping between the point of chlorine injection and the sample point used for CT determinations at or prior to the first user is considered a disinfection segment. Chlorine residual, p. H, and Temperature measured here
HOW IS CONTACT TIME DETERMINED? Tracer studies are used to determine contact time (T) which is used in calculating CT achieved, where CT = chlorine Concentration x contact Time. Contact time is the time that chlorine is in contact with the water from the point of injection to the point where it is measured (sometimes referred to as the “CT segment”) May be at or before the 1 st user May be more than one CT segment Tracer studies are often conducted to simulate a worst-case scenario where peak hour demand flows are high and reservoir levels are low. This gives a conservative (i. e. lower) contact time than would normally be expected.
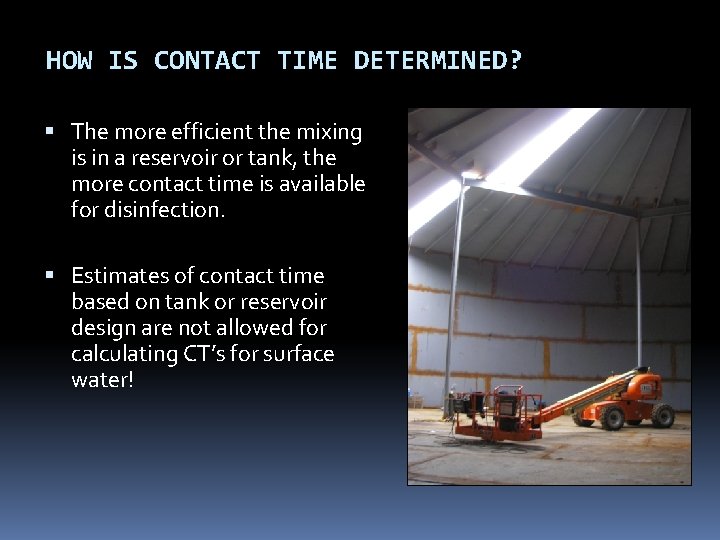
HOW IS CONTACT TIME DETERMINED? The more efficient the mixing is in a reservoir or tank, the more contact time is available for disinfection. Estimates of contact time based on tank or reservoir design are not allowed for calculating CT’s for surface water!
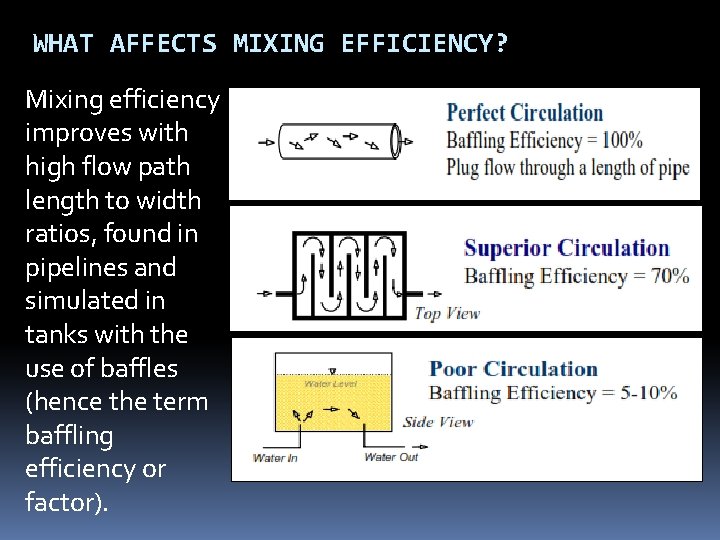
WHAT AFFECTS MIXING EFFICIENCY? Mixing efficiency improves with high flow path length to width ratios, found in pipelines and simulated in tanks with the use of baffles (hence the term baffling efficiency or factor).
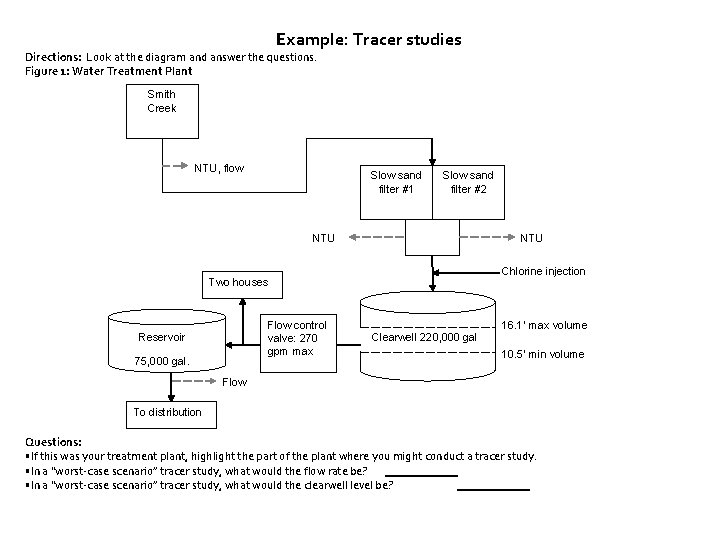
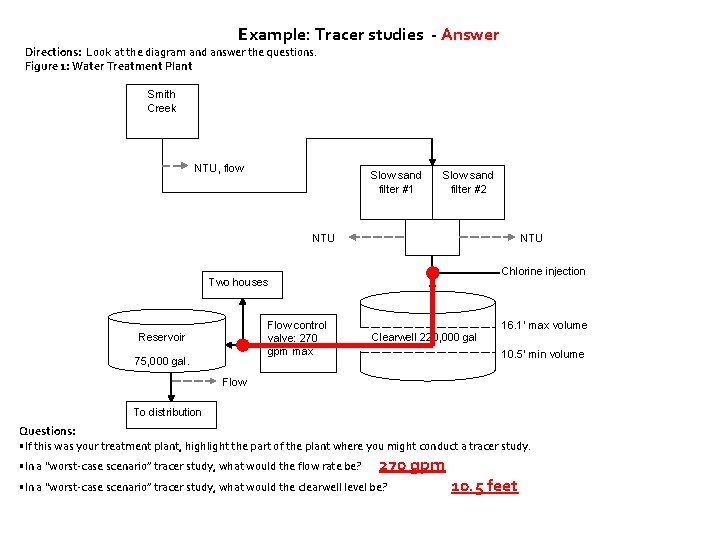
Example: Tracer studies Directions: Look at the diagram and answer the questions. Figure 1: Water Treatment Plant Smith Creek NTU, flow Slow sand filter #1 Slow sand filter #2 NTU Chlorine injection Two houses Flow control valve: 270 gpm max Reservoir 75, 000 gal. 16. 1’ max volume Clearwell 220, 000 gal 10. 5’ min volume Flow To distribution Questions: • If this was your treatment plant, highlight the part of the plant where you might conduct a tracer study. • In a “worst-case scenario” tracer study, what would the flow rate be? • In a “worst-case scenario” tracer study, what would the clearwell level be?
Example: Tracer studies - Answer Directions: Look at the diagram and answer the questions. Figure 1: Water Treatment Plant Smith Creek NTU, flow Slow sand filter #1 Slow sand filter #2 NTU Chlorine injection Two houses Flow control valve: 270 gpm max Reservoir 75, 000 gal. 16. 1’ max volume Clearwell 220, 000 gal 10. 5’ min volume Flow To distribution Questions: • If this was your treatment plant, highlight the part of the plant where you might conduct a tracer study. • In a “worst-case scenario” tracer study, what would the flow rate be? 270 gpm • In a “worst-case scenario” tracer study, what would the clearwell level be? 10. 5 feet
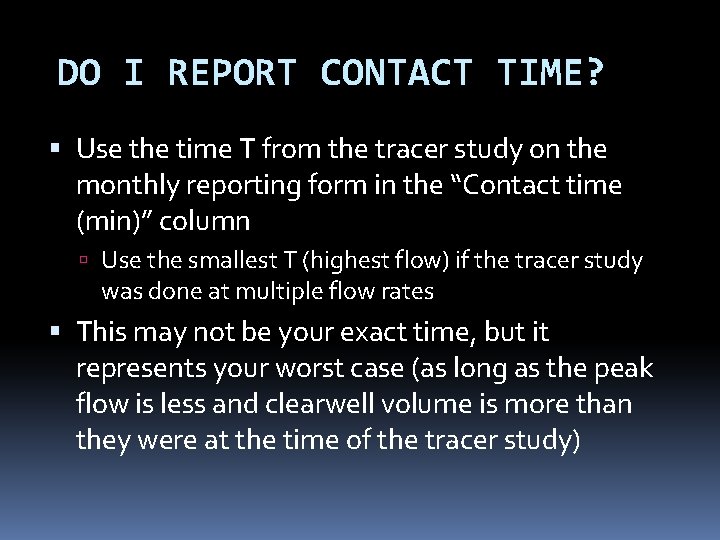
DO I REPORT CONTACT TIME? Use the time T from the tracer study on the monthly reporting form in the “Contact time (min)” column Use the smallest T (highest flow) if the tracer study was done at multiple flow rates This may not be your exact time, but it represents your worst case (as long as the peak flow is less and clearwell volume is more than they were at the time of the tracer study)
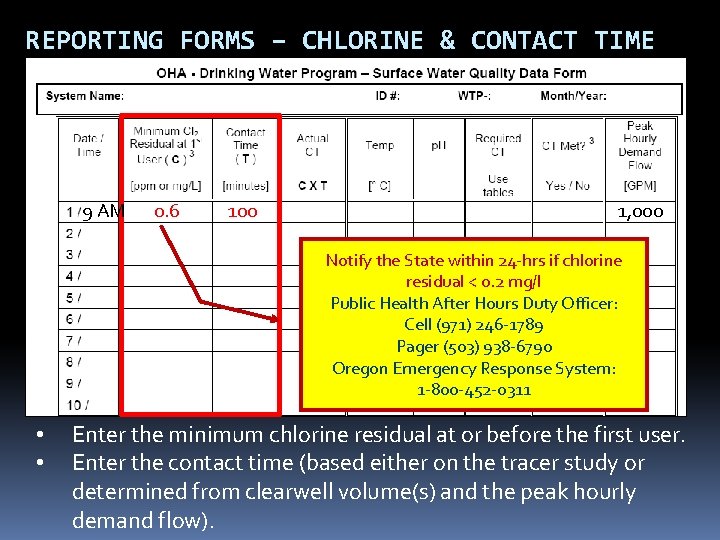
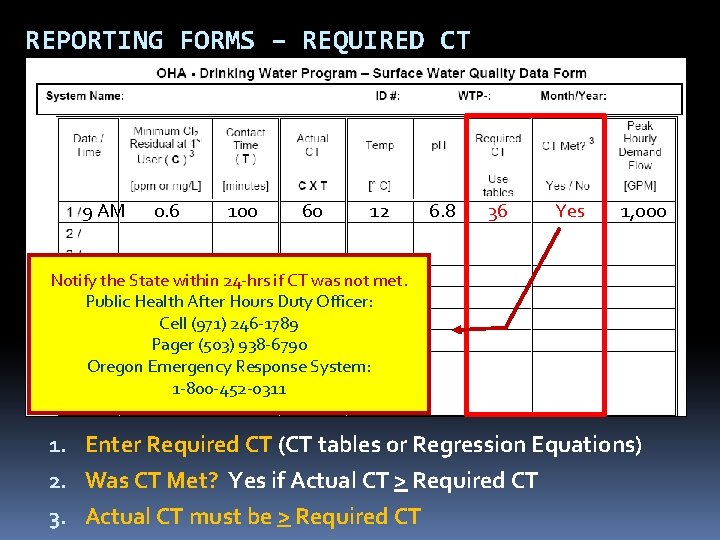
REPORTING FORMS – CHLORINE & CONTACT TIME 9 AM 0. 6 100 1, 000 Notify the State within 24 -hrs if chlorine residual < 0. 2 mg/l Public Health After Hours Duty Officer: Cell (971) 246 -1789 Pager (503) 938 -6790 Oregon Emergency Response System: 1 -800 -452 -0311 • • Enter the minimum chlorine residual at or before the first user. Enter the contact time (based either on the tracer study or determined from clearwell volume(s) and the peak hourly demand flow).
CAN I USE A BAFFLING FACTOR? As an alternative to using the tracer study contact time, you can use the results of the tracer study to determine the baffling factor of the clearwell Baffling factor (%) = Time (min) x Flow During Tracer Study (gpm) Clearwell Volume During Tracer Study (gal) T can be adjusted based on flow (at flow < 110% of tracer study flow) with the following equation: T = Current clearwell Volume (gal) x Baffling Factor (%) Peak Hourly Demand Flow (gpm) Contact the state for guidance on using baffling factors.
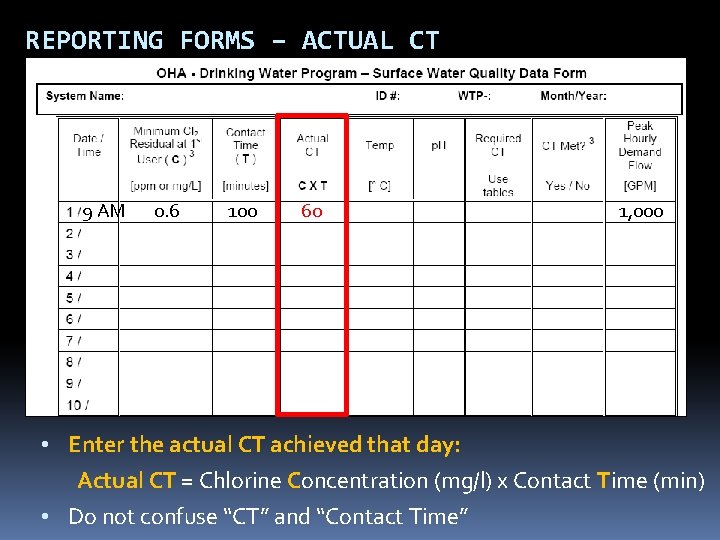
REPORTING FORMS – ACTUAL CT 9 AM 0. 6 100 60 1, 000 • Enter the actual CT achieved that day: Actual CT = Chlorine Concentration (mg/l) x Contact Time (min) • Do not confuse “CT” and “Contact Time”
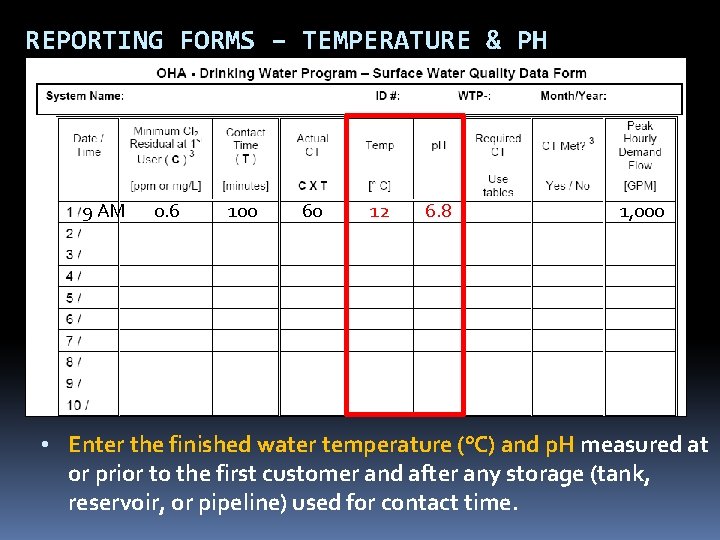
REPORTING FORMS – TEMPERATURE & PH 9 AM 0. 6 100 60 12 6. 8 1, 000 • Enter the finished water temperature (°C) and p. H measured at or prior to the first customer and after any storage (tank, reservoir, or pipeline) used for contact time.
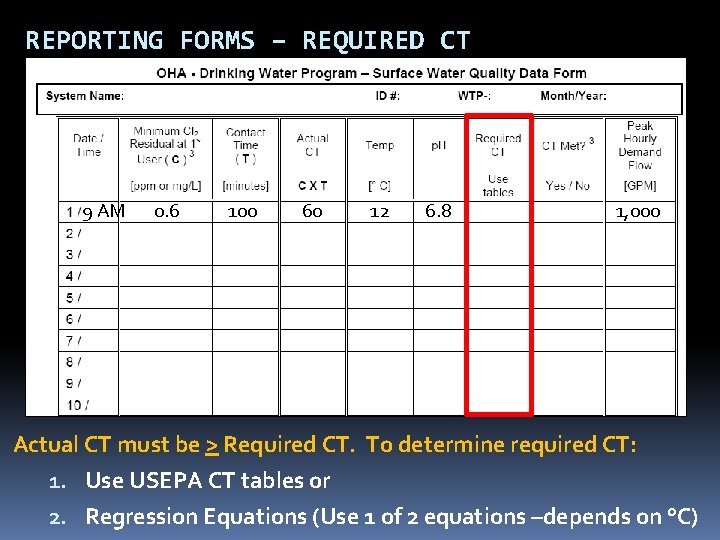
REPORTING FORMS – REQUIRED CT 9 AM 0. 6 100 60 12 6. 8 1, 000 Actual CT must be > Required CT. To determine required CT: 1. Use USEPA CT tables or 2. Regression Equations (Use 1 of 2 equations –depends on °C)
HOW IS REQUIRED CT CALCULATED? We use the EPA tables (or “regression equations”) to determine the CT required to inactivate Giardia (CTrequired) 1 -log inactivation of Giardia using chlorine results in at least 4. 0 -log inactivation of viruses. To determine CT, we need to know p. H, temperature, and free chlorine residual at or before the first user. Then we compare the CTrequired with the actual CT achieved in the water system (CTactual) where: CTactual = chlorine concentration (mg/l) x contact time (min) Must keep CTactual > CTrequired
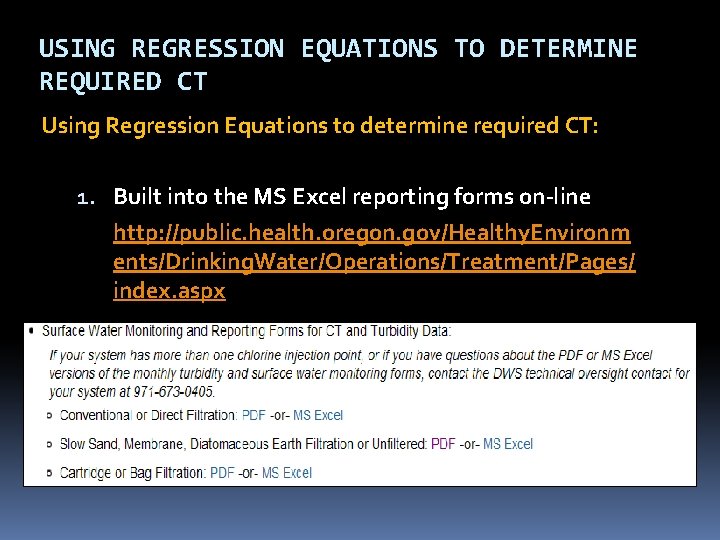
USING REGRESSION EQUATIONS TO DETERMINE REQUIRED CT Using Regression Equations to determine required CT: 1. Built into the MS Excel reporting forms on-line http: //public. health. oregon. gov/Healthy. Environm ents/Drinking. Water/Operations/Treatment/Pages/ index. aspx
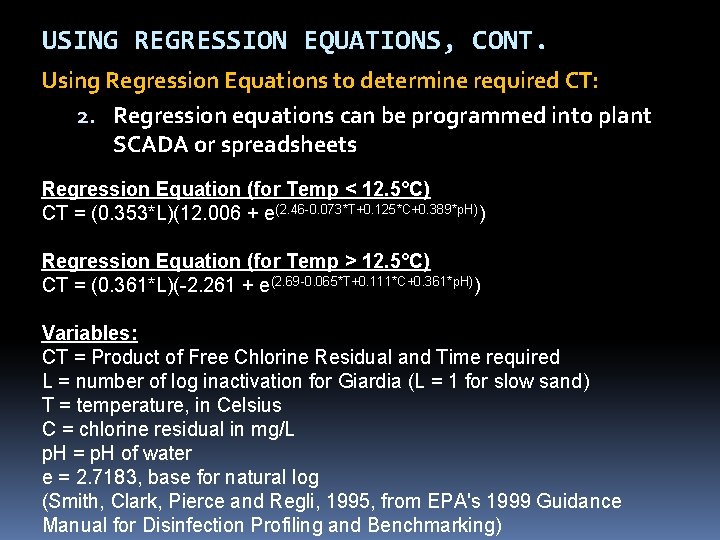
USING REGRESSION EQUATIONS, CONT. Using Regression Equations to determine required CT: 2. Regression equations can be programmed into plant SCADA or spreadsheets Regression Equation (for Temp < 12. 5°C) CT = (0. 353*L)(12. 006 + e(2. 46 -0. 073*T+0. 125*C+0. 389*p. H)) Regression Equation (for Temp > 12. 5°C) CT = (0. 361*L)(-2. 261 + e(2. 69 -0. 065*T+0. 111*C+0. 361*p. H)) Variables: CT = Product of Free Chlorine Residual and Time required L = number of log inactivation for Giardia (L = 1 for slow sand) T = temperature, in Celsius C = chlorine residual in mg/L p. H = p. H of water e = 2. 7183, base for natural log (Smith, Clark, Pierce and Regli, 1995, from EPA's 1999 Guidance Manual for Disinfection Profiling and Benchmarking)
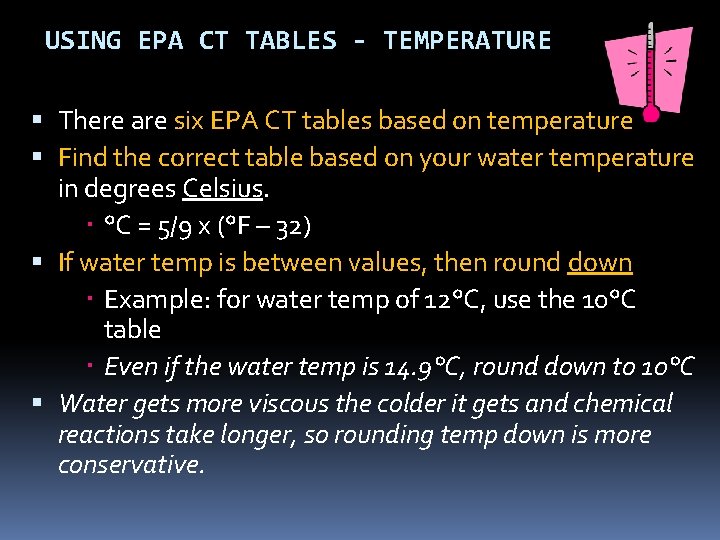
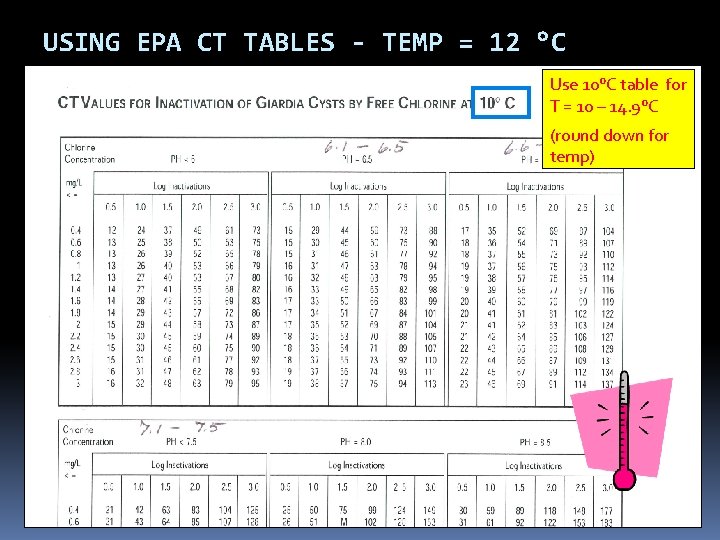
USING EPA CT TABLES - TEMPERATURE There are six EPA CT tables based on temperature Find the correct table based on your water temperature in degrees Celsius. °C = 5/9 x (°F – 32) If water temp is between values, then round down Example: for water temp of 12°C, use the 10°C table Even if the water temp is 14. 9°C, round down to 10°C Water gets more viscous the colder it gets and chemical reactions take longer, so rounding temp down is more conservative.
USING EPA CT TABLES - TEMP = 12 °C Use 10°C table for T = 10 – 14. 9°C (round down for temp)
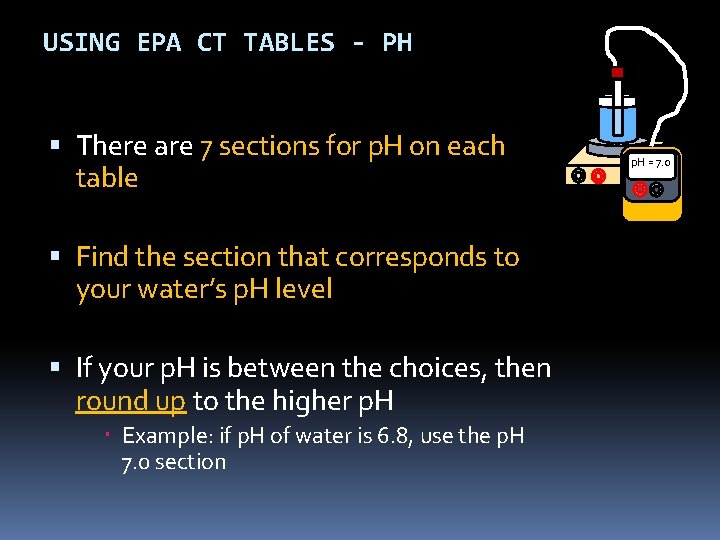
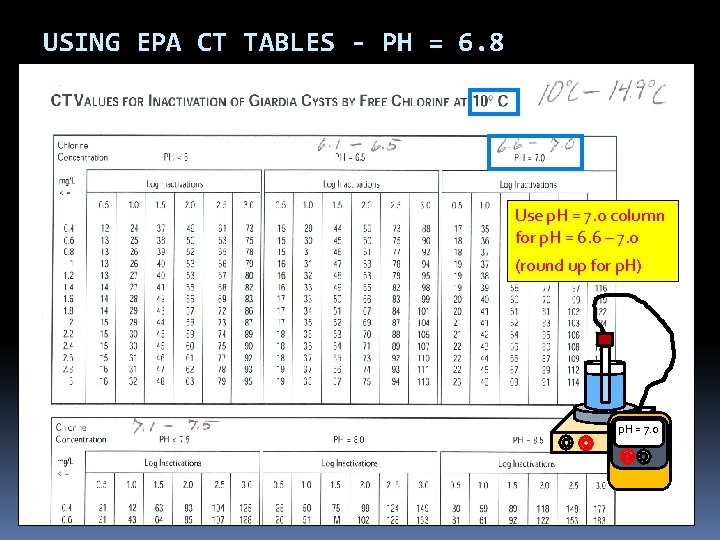
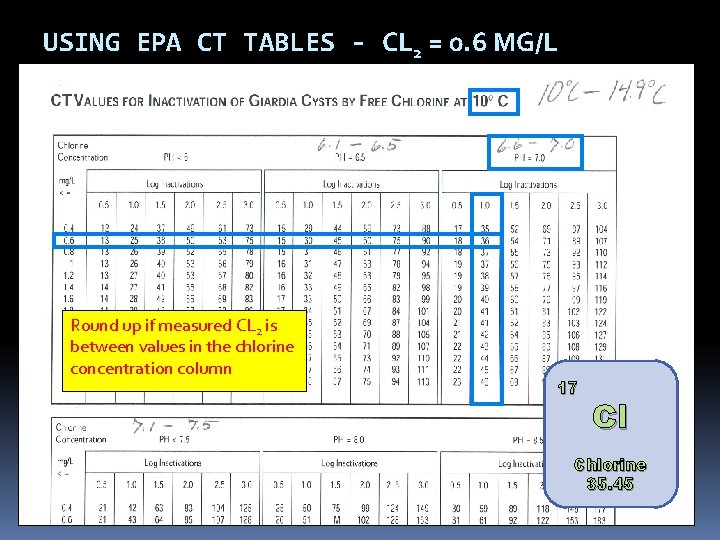
USING EPA CT TABLES - PH There are 7 sections for p. H on each table Find the section that corresponds to your water’s p. H level If your p. H is between the choices, then round up to the higher p. H Example: if p. H of water is 6. 8, use the p. H 7. 0 section p. H = 7. 0
USING EPA CT TABLES - PH = 6. 8 Use p. H = 7. 0 column for p. H = 6. 6 – 7. 0 (round up for p. H) p. H = 7. 0
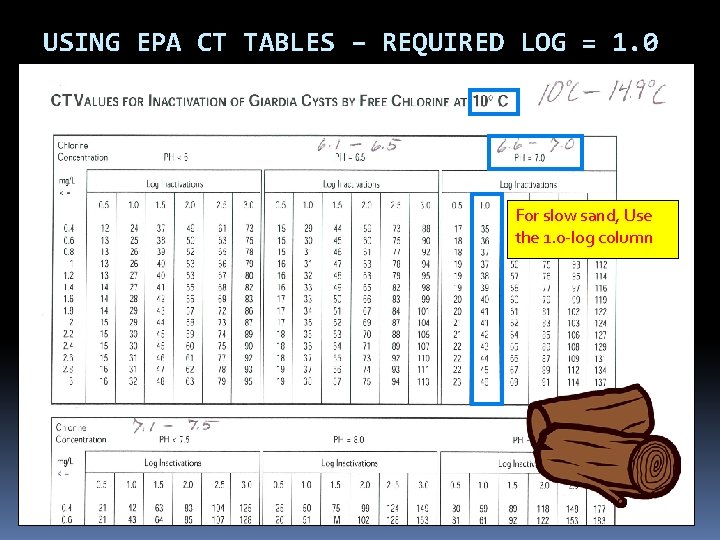
USING EPA CT TABLES – 1 -LOG Use the 1 -log inactivation column (slow sand is granted 2. 0 -log removal credit for Giardia, which requires that 1. 0 -log Giardia inactivation is needed through disinfection)
USING EPA CT TABLES – REQUIRED LOG = 1. 0 For slow sand, Use the 1. 0 -log column
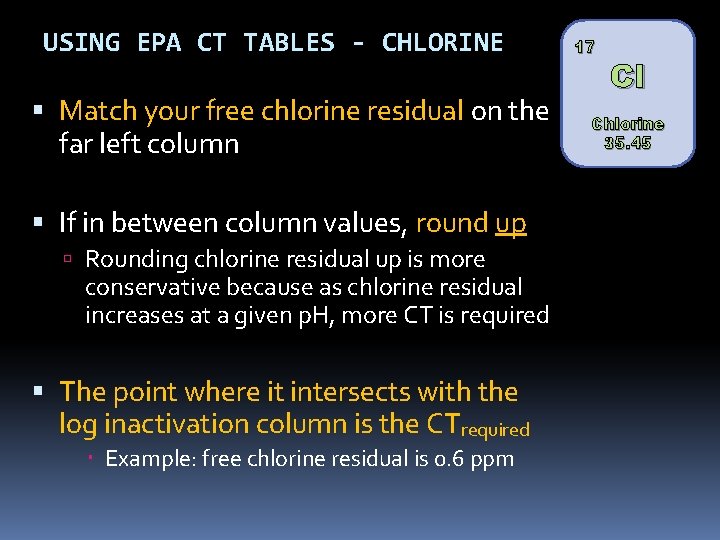
USING EPA CT TABLES - CHLORINE Match your free chlorine residual on the far left column If in between column values, round up Rounding chlorine residual up is more conservative because as chlorine residual increases at a given p. H, more CT is required The point where it intersects with the log inactivation column is the CTrequired Example: free chlorine residual is 0. 6 ppm 17 Cl Chlorine 35. 45
USING EPA CT TABLES - CL 2 = 0. 6 MG/L Round up if measured CL 2 is between values in the chlorine concentration column 17 Cl Chlorine 35. 45
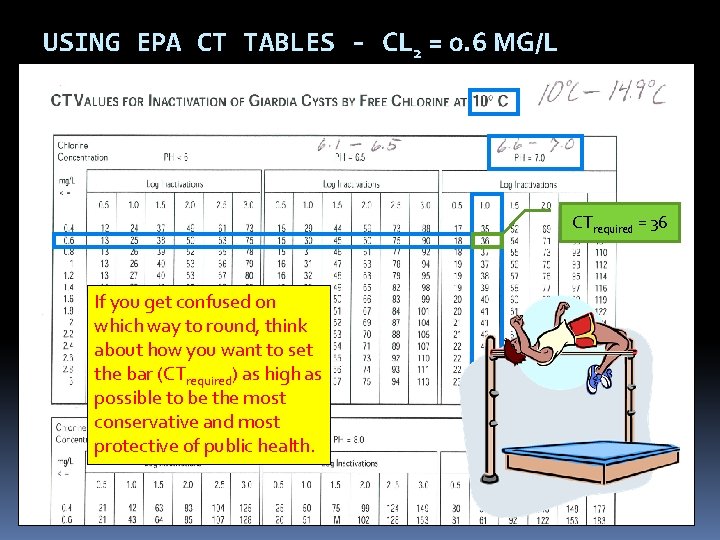
USING EPA CT TABLES - CL 2 = 0. 6 MG/L CTrequired = 36 If you get confused on which way to round, think about how you want to set the bar (CTrequired) as high as possible to be the most conservative and most protective of public health.
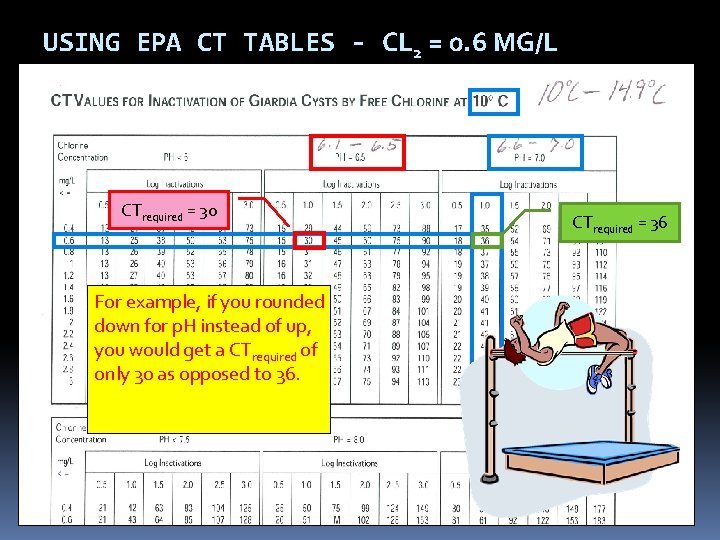
USING EPA CT TABLES - CL 2 = 0. 6 MG/L CTrequired = 30 For example, if you rounded down for p. H instead of up, you would get a CTrequired of only 30 as opposed to 36. CTrequired = 36
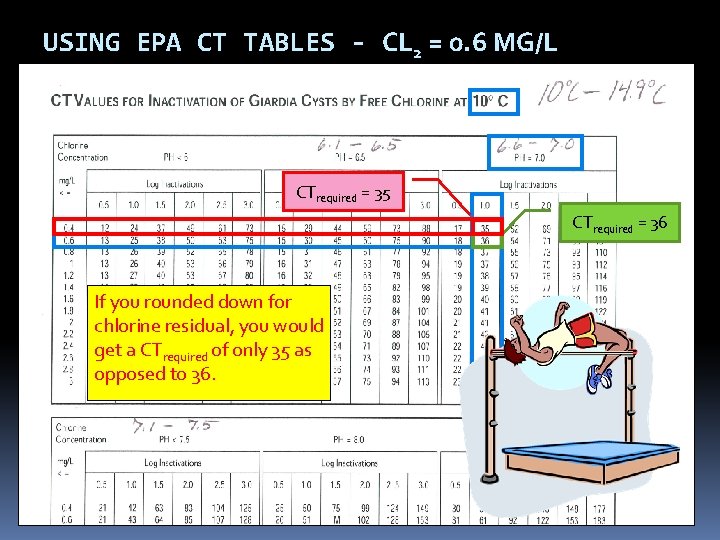
USING EPA CT TABLES - CL 2 = 0. 6 MG/L CTrequired = 35 CTrequired = 36 If you rounded down for chlorine residual, you would get a CTrequired of only 35 as opposed to 36.
REPORTING FORMS – REQUIRED CT 9 AM 0. 6 100 60 12 6. 8 36 Yes 1, 000 Notify the State within 24 -hrs if CT was not met. Public Health After Hours Duty Officer: Cell (971) 246 -1789 Pager (503) 938 -6790 Oregon Emergency Response System: 1 -800 -452 -0311 1. Enter Required CT (CT tables or Regression Equations) 2. Was CT Met? Yes if Actual CT > Required CT 3. Actual CT must be > Required CT
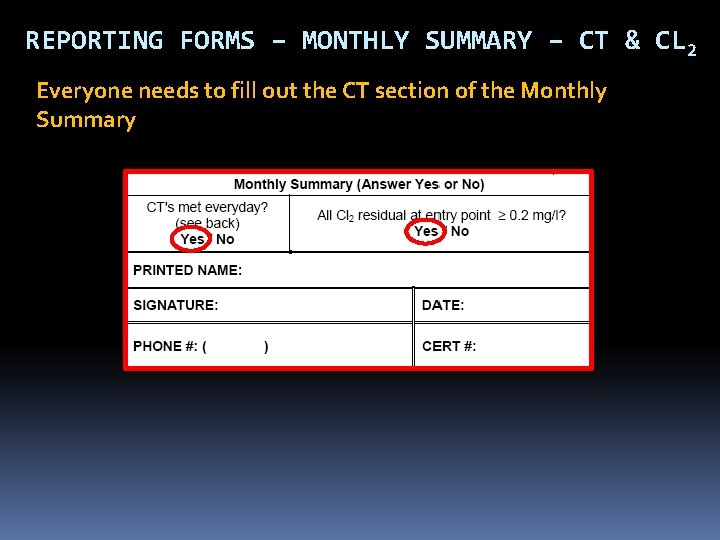
REPORTING FORMS – MONTHLY SUMMARY – CT & CL 2 Everyone needs to fill out the CT section of the Monthly Summary
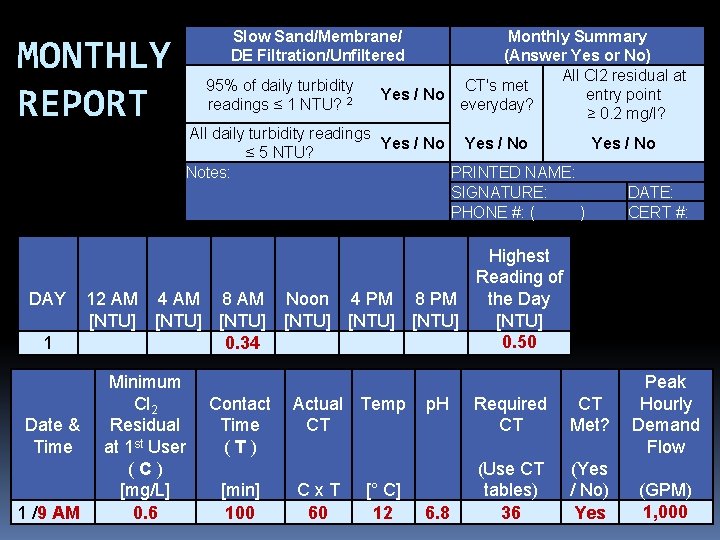
MONTHLY REPORT DAY 1 Date & Time 1 /9 AM Slow Sand/Membrane/ DE Filtration/Unfiltered 95% of daily turbidity readings ≤ 1 NTU? 2 Monthly Summary (Answer Yes or No) All Cl 2 residual at CT's met entry point Yes / No everyday? ≥ 0. 2 mg/l? All daily turbidity readings Yes / No ≤ 5 NTU? Notes: PRINTED NAME: SIGNATURE: DATE: PHONE #: ( ) CERT #: Highest Reading of the Day 12 AM 4 AM 8 AM Noon 4 PM 8 PM [NTU] [NTU] 0. 50 0. 34 Minimum Cl 2 Residual at 1 st User (C) [mg/L] 0. 6 Contact Time (T) [min] 100 Actual Temp CT Cx. T 60 [° C] 12 p. H 6. 8 Required CT CT Met? (Use CT tables) 36 (Yes / No) Yes Peak Hourly Demand Flow (GPM) 1, 000
FILLING OUT THE MONTHLY REPORT – COMMON MISTAKES Not calculating CT’s daily Don’t wait until the end of the month to do the calculations because if you discover you didn’t meet CT’s, it’s too late! If adjusting contact time according to flow rate, use the demand flow, not the plant flow. Failure to answer questions at bottom of form correctly (or at all) Always answering “Yes” to the questions at the bottom of the form without actually looking at the numbers
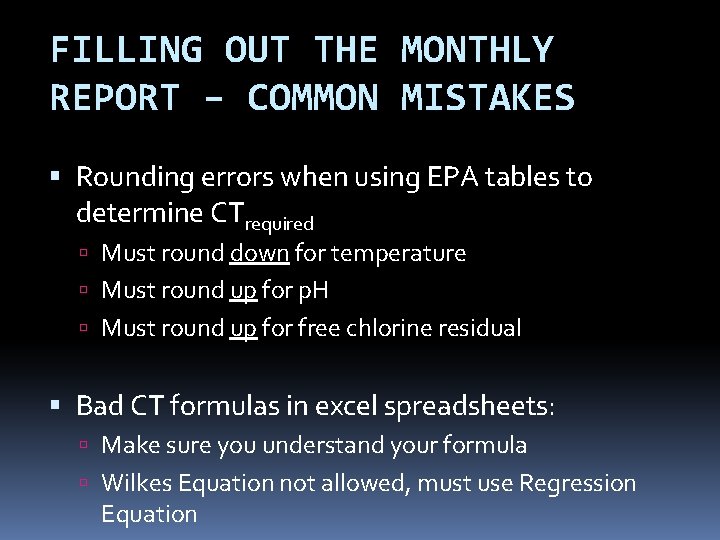
FILLING OUT THE MONTHLY REPORT – COMMON MISTAKES Rounding errors when using EPA tables to determine CTrequired Must round down for temperature Must round up for p. H Must round up for free chlorine residual Bad CT formulas in excel spreadsheets: Make sure you understand your formula Wilkes Equation not allowed, must use Regression Equation
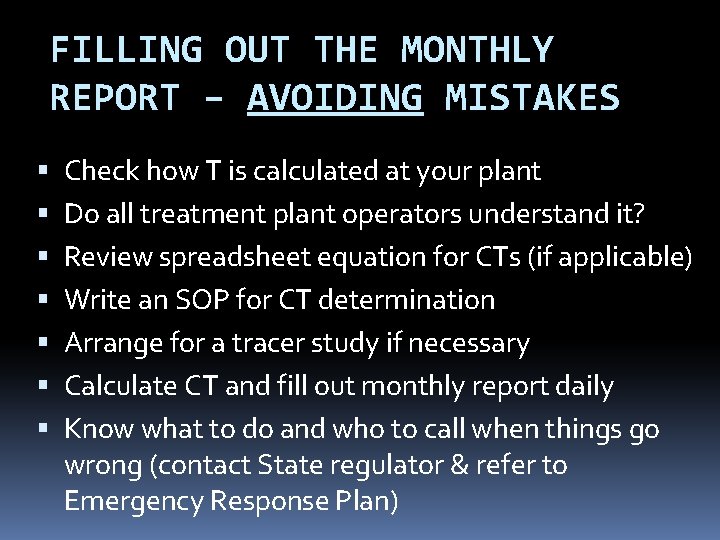
FILLING OUT THE MONTHLY REPORT – AVOIDING MISTAKES Check how T is calculated at your plant Do all treatment plant operators understand it? Review spreadsheet equation for CTs (if applicable) Write an SOP for CT determination Arrange for a tracer study if necessary Calculate CT and fill out monthly report daily Know what to do and who to call when things go wrong (contact State regulator & refer to Emergency Response Plan)
STRIVE TO IMPROVE DATA QUALITY Make data reliability a plant goal Only collect data used for process control or compliance reporting Establish protocols for collection and recording of data Establish a data verification process that can be routinely used to confirm data integrity Turn data into information (e. g. , draw the graph).
O&M MANUALS Keep written procedures on: Instrument calibration methods and frequency Data handling/reporting Chemical dosage determinations Filter operation and cleaning CT determinations Responding to abnormal conditions (emergency response plan)
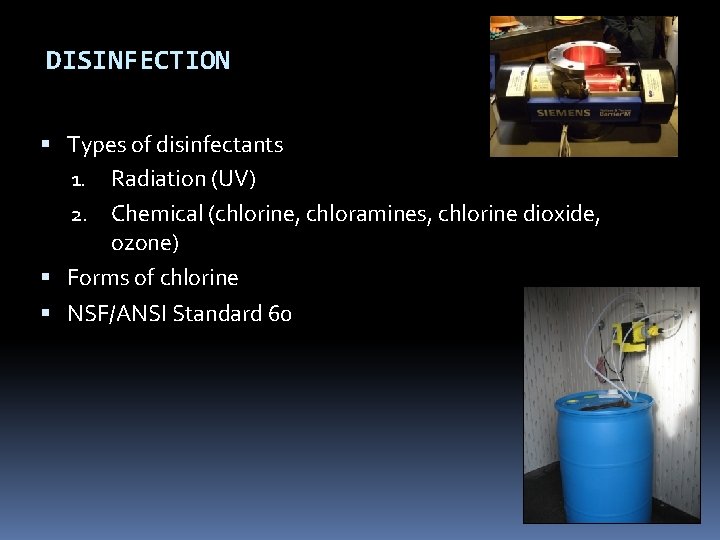
DISINFECTION Types of disinfectants 1. Radiation (UV) 2. Chemical (chlorine, chloramines, chlorine dioxide, ozone) Forms of chlorine NSF/ANSI Standard 60
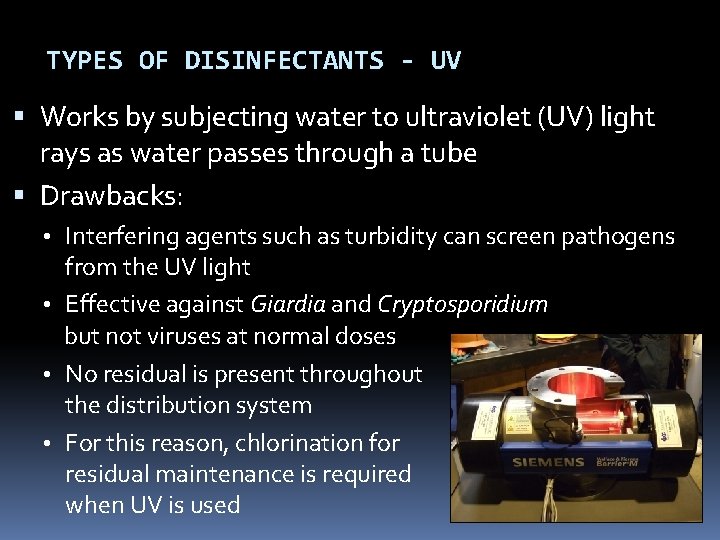
TYPES OF DISINFECTANTS - UV Works by subjecting water to ultraviolet (UV) light rays as water passes through a tube Drawbacks: • Interfering agents such as turbidity can screen pathogens from the UV light • Effective against Giardia and Cryptosporidium but not viruses at normal doses • No residual is present throughout the distribution system • For this reason, chlorination for residual maintenance is required when UV is used
TYPES OF DISINFECTANTS - CHEMICAL 1. 2. 3. 4. Chlorine Chloramines Chlorine dioxide Ozone
TYPES OF DISINFECTANTS - CHLORINE The most widely used form of disinfection Also used as an oxidizing agent for iron, manganese and hydrogen sulfide and for controlling taste and odors Effectiveness as a disinfecting agent depends on factors such as p. H, temperature, free chlorine residual, contact time and other interfering agents
FORMS OF CHLORINE Sodium Hypochlorite Onsite generated sodium hypochlorite Calcium Hypochlorite Chlorine Gas
FORMS OF CHLORINE – SODIUM HYPOCHLORITE The liquid form of chlorine Clear and has a slight yellow color Ordinary household bleach (~5% chlorine by solution) is the most common form Industrial strength: 12% and 15% solutions Can lose up to 4% of its available chlorine content per month; should not be stored for more than 60 to 90 days Very corrosive; should be stored and mixed away from equipment that can be damaged by corrosion
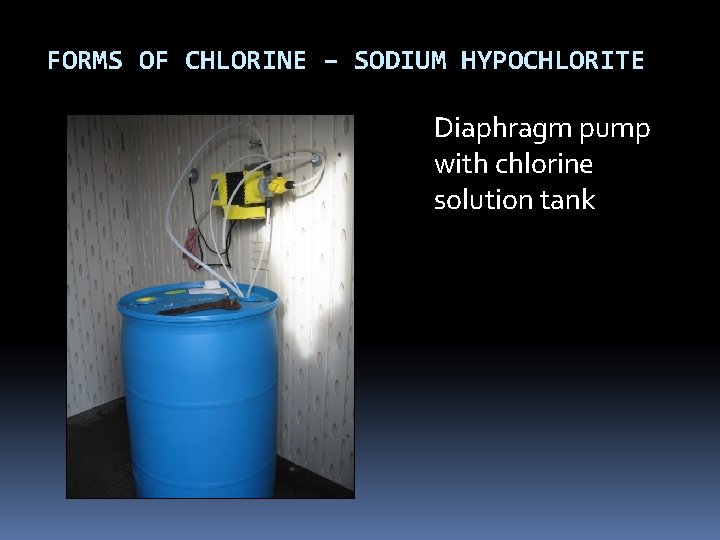
FORMS OF CHLORINE – SODIUM HYPOCHLORITE Diaphragm pump with chlorine solution tank
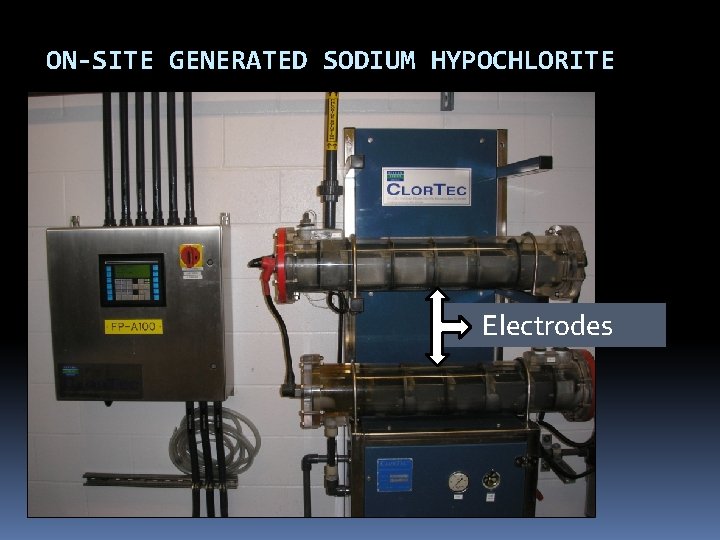
ON-SITE GENERATED SODIUM HYPOCHLORITE 0. 8% sodium hypochlorite is produced on demand by combining salt, water & electricity Electrolysis of brine solution produces sodium hydroxide and chlorine gas, which then mix to form sodium hypochlorite Hydrogen gas byproduct; vented to atmosphere Alleviates safety concerns associated w/ hauling and storing bulk chlorine Higher initial cost, high power cost Mixed oxidants (proprietary)
ON-SITE GENERATED SODIUM HYPOCHLORITE Electrodes
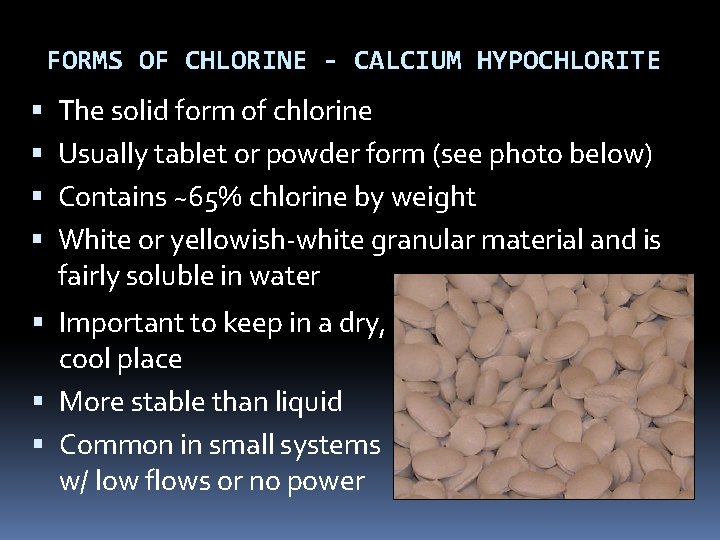
FORMS OF CHLORINE - CALCIUM HYPOCHLORITE The solid form of chlorine Usually tablet or powder form (see photo below) Contains ~65% chlorine by weight White or yellowish-white granular material and is fairly soluble in water Important to keep in a dry, cool place More stable than liquid Common in small systems w/ low flows or no power
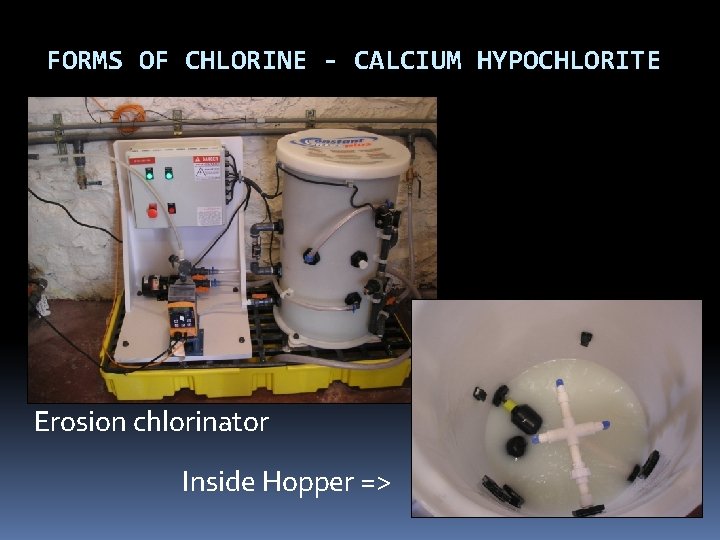
FORMS OF CHLORINE - CALCIUM HYPOCHLORITE Erosion chlorinator Inside Hopper =>
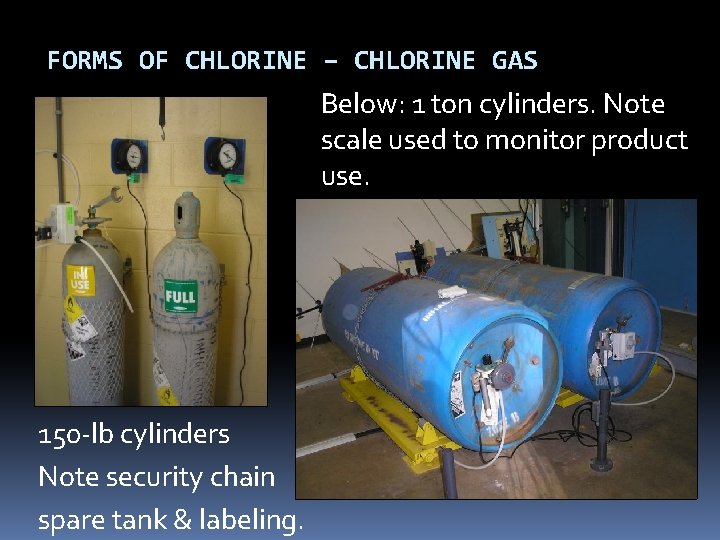
FORMS OF CHLORINE – CHLORINE GAS 99. 5% pure chlorine yellow-green color 2. 5 x heavier than air Liquefied at room temperature at ~107 psi – hence the pressurized cylinders actually contain liquefied chlorine gas. Liquefied Cl 2 is released from tanks as chlorine gas, which is then injected into the water stream. usually used only by large water systems Smaller systems may find initial cost of operation prohibitive
FORMS OF CHLORINE – CHLORINE GAS Below: 1 ton cylinders. Note scale used to monitor product use. 150 -lb cylinders Note security chain spare tank & labeling.
FORMS OF CHLORINE – CHLORAMINES Chlorine + ammonia = chloramination Two advantages to regular chlorination: 1. produce a longer lasting chlorine residual (helpful to systems with extensive distribution systems) 2. may produce fewer by-products depending on the application Disadvantage: 1. Need a lot of contact time to achieve CTs compared to free chlorine (300 times more) which is why not used for primary disinfection 2. Requires specific ratio of chlorine to ammonia or else potential water quality problems
CHLORINE DIOXIDE - ADVANTAGES Advantages: 1. More effective than chlorine and chloramines for inactivation of viruses, Cryptosporidium, and Giardia 2. Oxidizes iron, manganese, and sulfides 3. May enhance the clarification process 4. Controls T&O resulting from algae and decaying vegetation, as well as phenolic compounds 5. Under proper generation conditions halogen-substituted DBPs are not formed 6. Easy to generate 7. Provides residual
CHLORINE DIOXIDE - DISADVANTAGES Disadvantages 1. Forms the DBP chlorite 2. Costs associated with training, sampling, and laboratory testing for chlorite and chlorate are high 3. Equipment is typically rented, and the cost of the sodium chlorite is high 4. Explosive, so it must be generated on-site 5. Decomposes in sunlight 6. Can lead to production noxious odors in some systems.
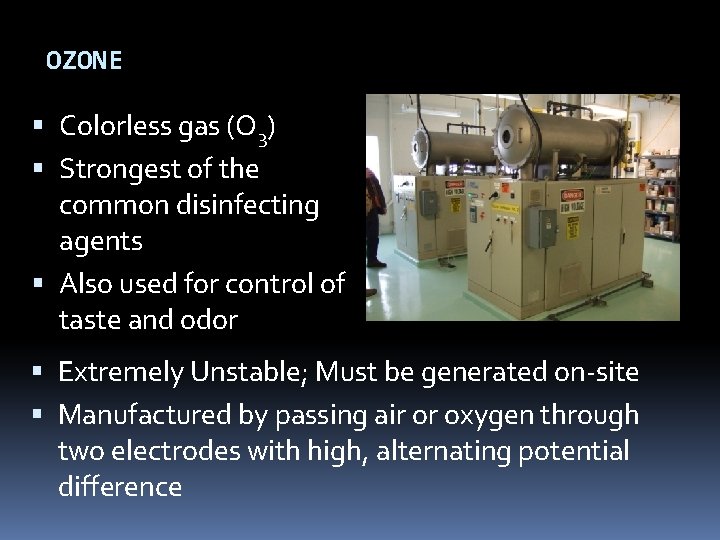
OZONE Colorless gas (O 3) Strongest of the common disinfecting agents Also used for control of taste and odor Extremely Unstable; Must be generated on-site Manufactured by passing air or oxygen through two electrodes with high, alternating potential difference
OZONE - ADVANTAGES Advantages: 1. Short reaction time enables microbes (including viruses) to be killed within a few seconds 2. Removes color, taste, and odor causing compounds 3. Oxidizes iron and manganese 4. Destroys some algal toxins 5. Does not produce halogenated DBPs
OZONE - DISADVANTAGES Disadvantages: 1. Overfeed or leak can be dangerous 2. Cost is high compared with chlorination 3. Installation can be complicated 4. May produce undesirable brominated byproducts in source waters containing bromide 5. No residual effect is present in the distribution system, thus post-chlorination is required 6. Much less soluble in water than chlorine; thus special mixing devices are necessary
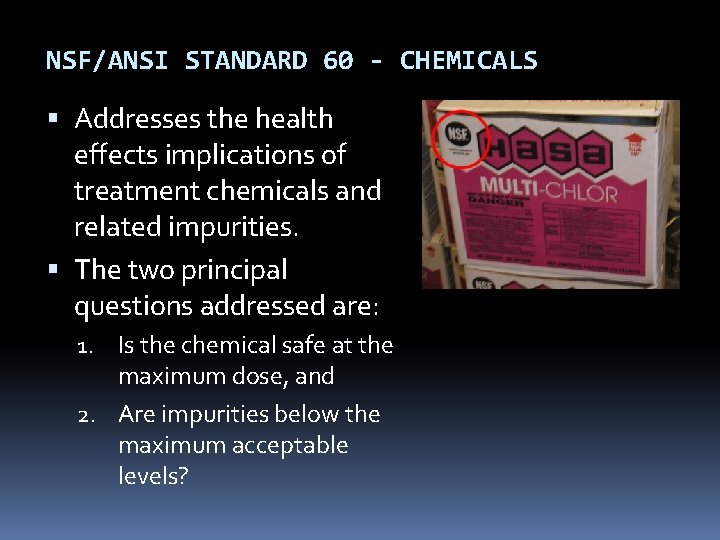
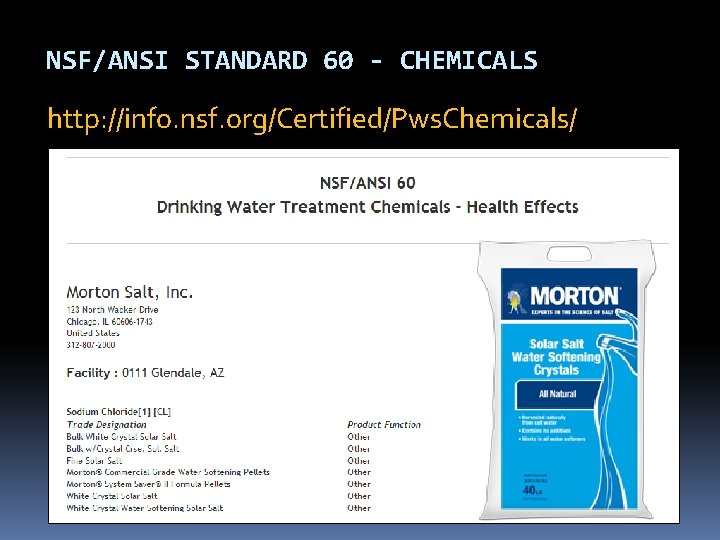
NSF/ANSI STANDARD 60 - CHEMICALS Addresses the health effects implications of treatment chemicals and related impurities. The two principal questions addressed are: 1. Is the chemical safe at the maximum dose, and 2. Are impurities below the maximum acceptable levels?
NSF/ANSI STANDARD 60 - CHEMICALS http: //info. nsf. org/Certified/Pws. Chemicals/
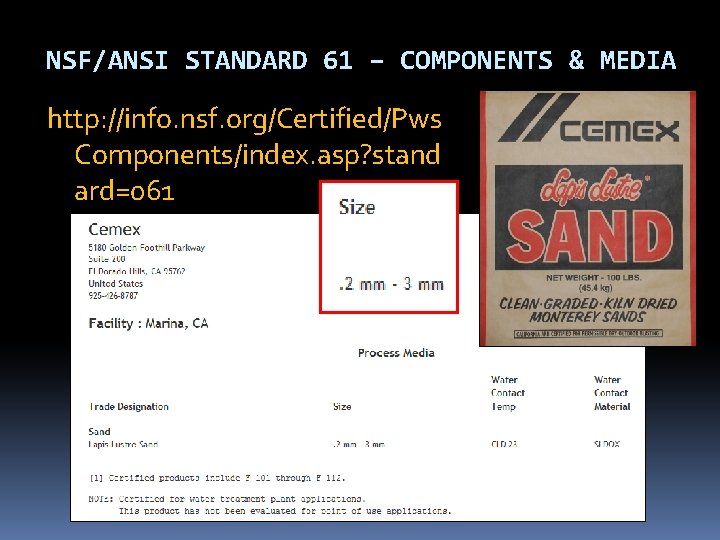
NSF/ANSI STANDARD 61 – COMPONENTS & MEDIA http: //info. nsf. org/Certified/Pws Components/index. asp? stand ard=061
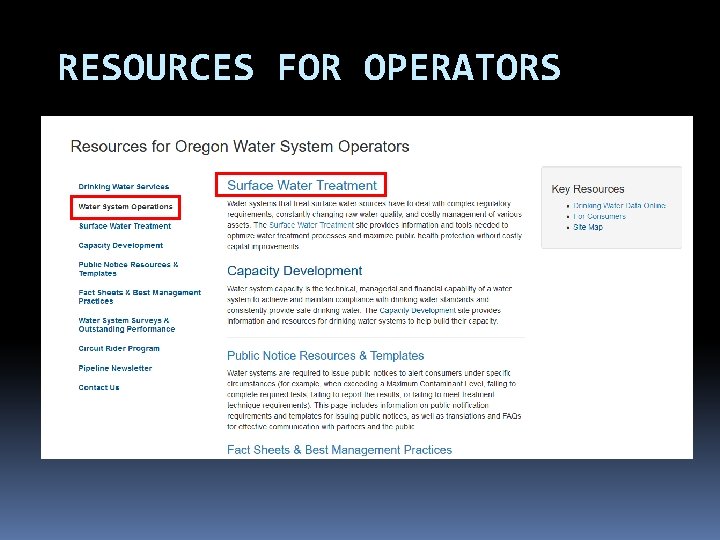
RESOURCES FOR OPERATORS For surface water systems: www. healthoregon. gov/dwp Click on “Water System Operations” on left-side menu list, then “Surface Water Treatment” Monthly Surface Water Quality Report form template Tracer Study form Surface Water Treatment Rule guidance manual, Appendix C: Determination of Disinfectant Contact Time
RESOURCES FOR OPERATORS EPA Rules http: //water. epa. gov/lawsregs/rulesregs/sdwa/c urrentregulations. cfm AWWA http: //www. pnws-awwa. org/Index. asp OAWU http: //www. oawu. net/ Circuit Rider http: //public. health. oregon. gov/Healthy. Environ ments/Drinking. Water/Operations/Pages/circuitri der. aspx
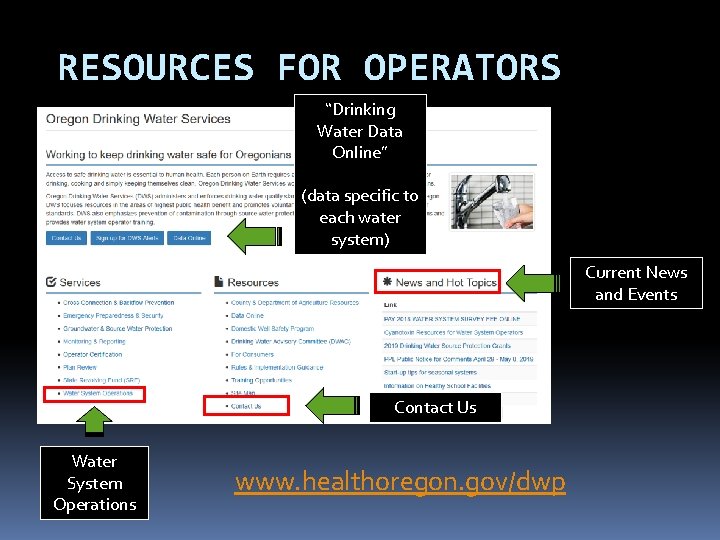
RESOURCES FOR OPERATORS “Drinking Water Data Online” (data specific to each water system) Current News and Events Contact Us Water System Operations www. healthoregon. gov/dwp
RESOURCES FOR OPERATORS
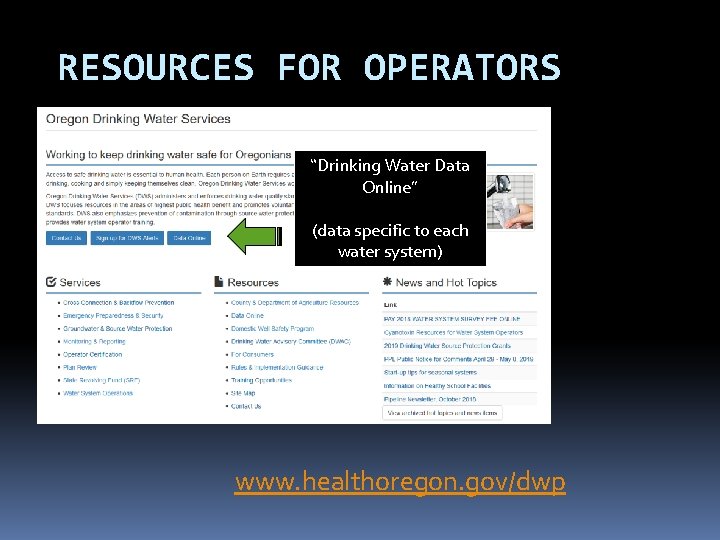
RESOURCES FOR OPERATORS “Drinking Water Data Online” (data specific to each water system) www. healthoregon. gov/dwp
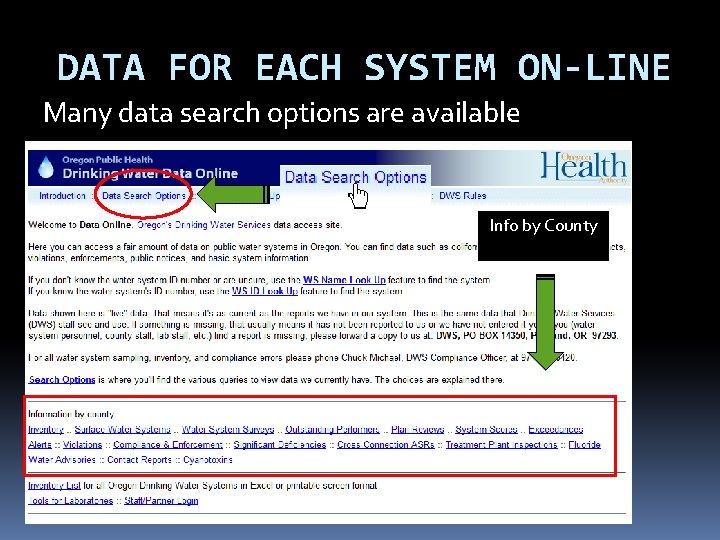
DATA FOR EACH SYSTEM ON-LINE Many data search options are available Info by County
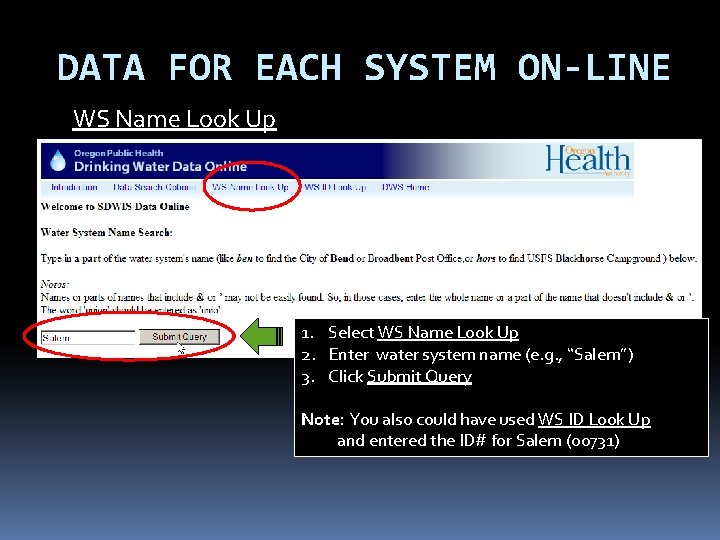
DATA FOR EACH SYSTEM ON-LINE WS Name Look Up 1. Select WS Name Look Up 2. Enter water system name (e. g. , “Salem”) 3. Click Submit Query Note: You also could have used WS ID Look Up and entered the ID# for Salem (00731)
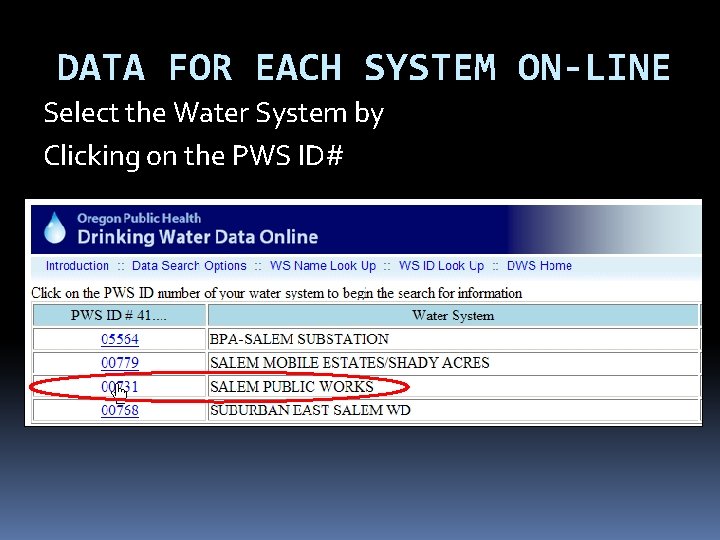
DATA FOR EACH SYSTEM ON-LINE Select the Water System by Clicking on the PWS ID#
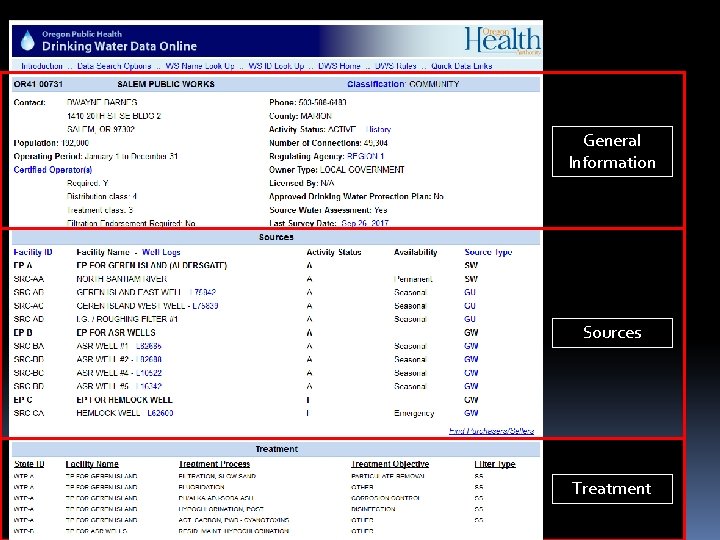
General Information Sources Treatment
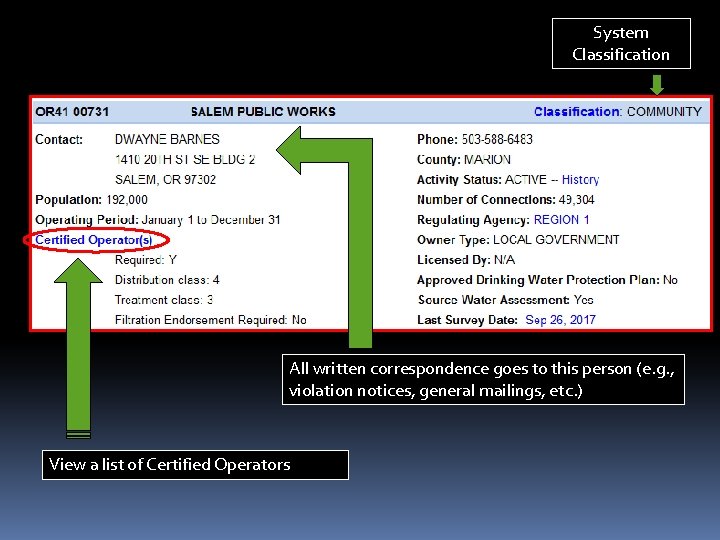
System Classification All written correspondence goes to this person (e. g. , violation notices, general mailings, etc. ) View a list of Certified Operators
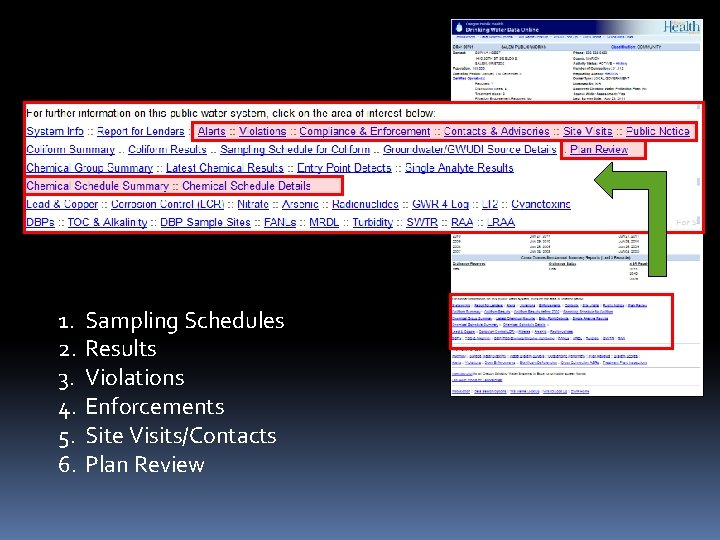
1. 2. 3. 4. 5. 6. Sampling Schedules Results Violations Enforcements Site Visits/Contacts Plan Review
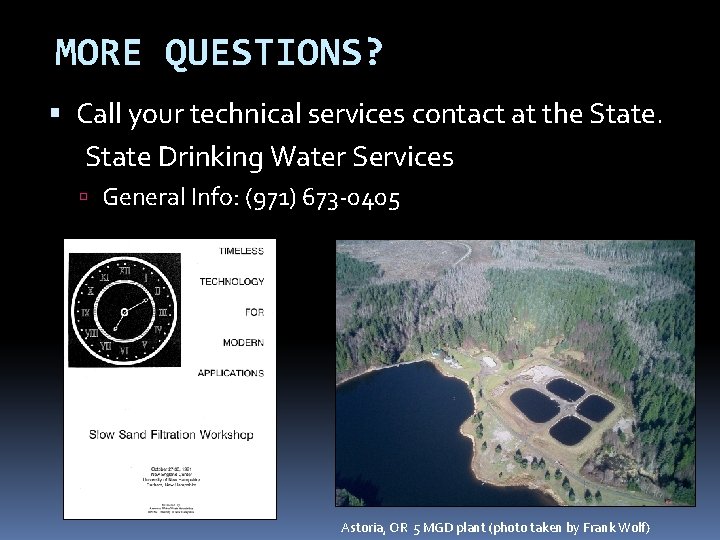
MORE QUESTIONS? Call your technical services contact at the State Drinking Water Services General Info: (971) 673 -0405 Astoria, OR 5 MGD plant (photo taken by Frank Wolf)