
Regulatory Regime in Punjab RE Projects Net Metering
Regulatory Regime in Punjab RE Projects & Net Metering of Solar Rooftop plants
RE-The Success in Punjab – Barriers – Way Forward Dhanbir Singh Bains, IAS (Retd. ) Chairman Punjab State Electricity Regulatory Commission Chandigarh The views expressed in this presentation are author’s own.
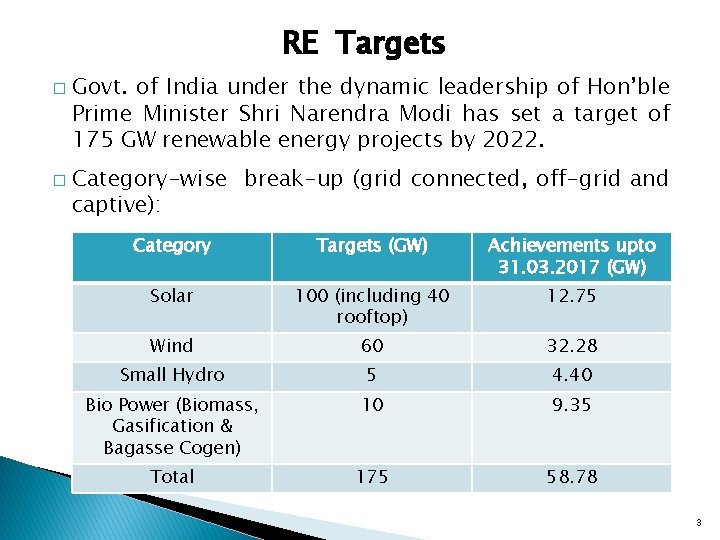
RE Targets � � Govt. of India under the dynamic leadership of Hon’ble Prime Minister Shri Narendra Modi has set a target of 175 GW renewable energy projects by 2022. Category-wise break-up (grid connected, off-grid and captive): Category Targets (GW) Achievements upto 31. 03. 2017 (GW) Solar 100 (including 40 rooftop) 12. 75 Wind 60 32. 28 Small Hydro 5 4. 40 Bio Power (Biomass, Gasification & Bagasse Cogen) 10 9. 35 Total 175 58. 78 3
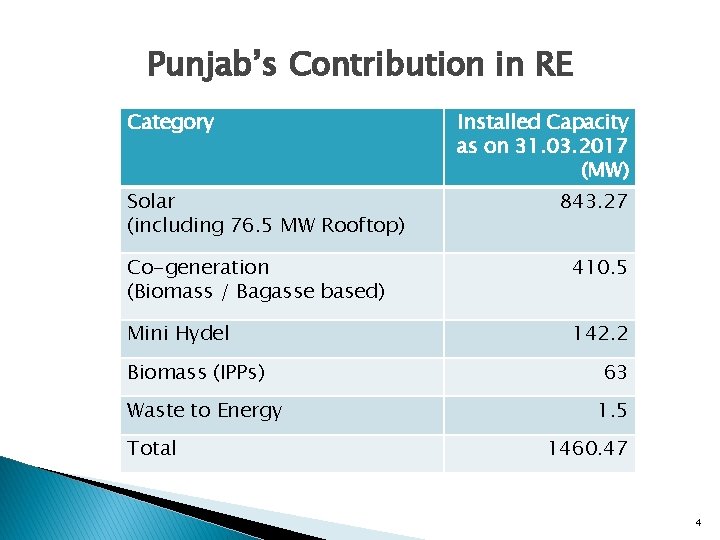
Punjab’s Contribution in RE Category Solar (including 76. 5 MW Rooftop) Installed Capacity as on 31. 03. 2017 (MW) 843. 27 Co-generation (Biomass / Bagasse based) 410. 5 Mini Hydel 142. 2 Biomass (IPPs) Waste to Energy Total 63 1. 5 1460. 47 4
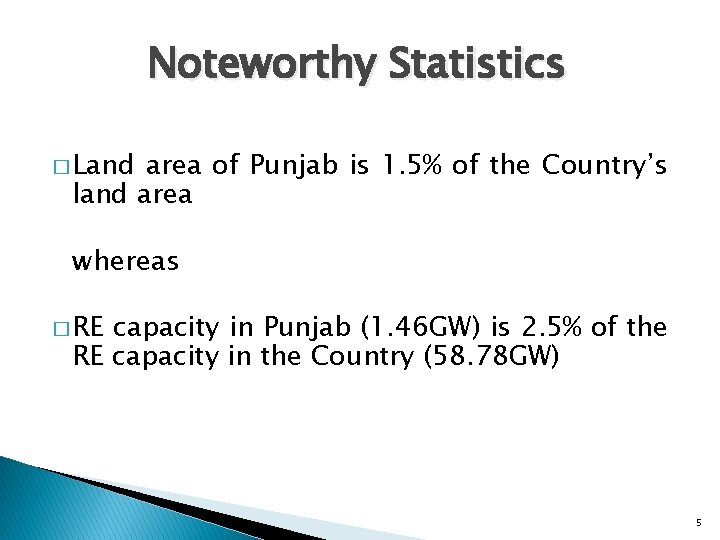
Noteworthy Statistics � Land area of Punjab is 1. 5% of the Country’s land area whereas � RE capacity in Punjab (1. 46 GW) is 2. 5% of the RE capacity in the Country (58. 78 GW) 5
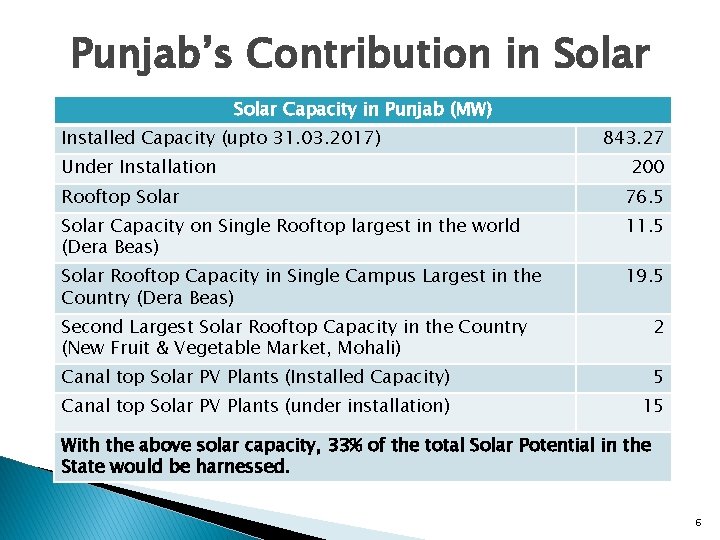
Punjab’s Contribution in Solar Capacity in Punjab (MW) Installed Capacity (upto 31. 03. 2017) Under Installation 843. 27 200 Rooftop Solar 76. 5 Solar Capacity on Single Rooftop largest in the world (Dera Beas) 11. 5 Solar Rooftop Capacity in Single Campus Largest in the Country (Dera Beas) 19. 5 Second Largest Solar Rooftop Capacity in the Country (New Fruit & Vegetable Market, Mohali) 2 Canal top Solar PV Plants (Installed Capacity) 5 Canal top Solar PV Plants (under installation) 15 With the above solar capacity, 33% of the total Solar Potential in the State would be harnessed. 6
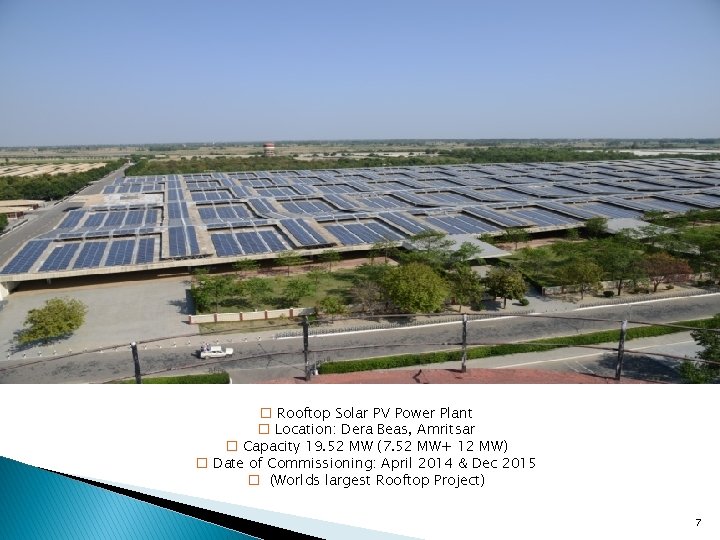
� Rooftop Solar PV Power Plant � Location: Dera Beas, Amritsar � Capacity 19. 52 MW (7. 52 MW+ 12 MW) � Date of Commissioning: April 2014 & Dec 2015 � (Worlds largest Rooftop Project) 7
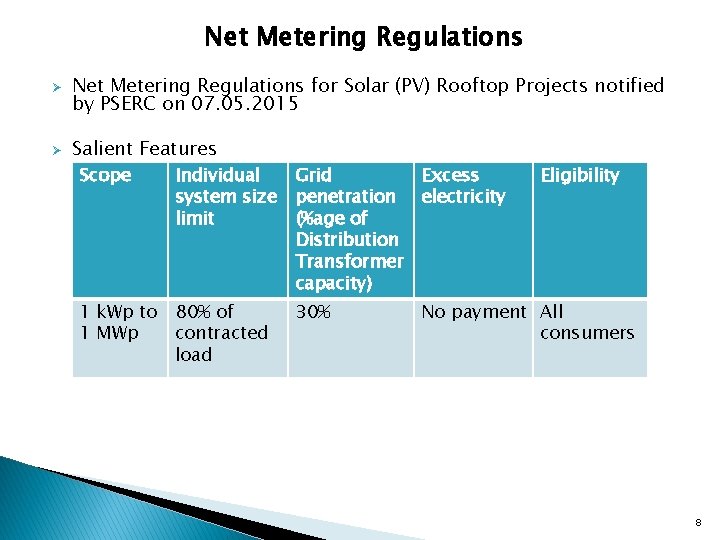
Net Metering Regulations Ø Ø Net Metering Regulations for Solar (PV) Rooftop Projects notified by PSERC on 07. 05. 2015 Salient Features Scope Individual system size limit Grid Excess penetration electricity (%age of Distribution Transformer capacity) 1 k. Wp to 1 MWp 80% of contracted load 30% Eligibility No payment All consumers 8
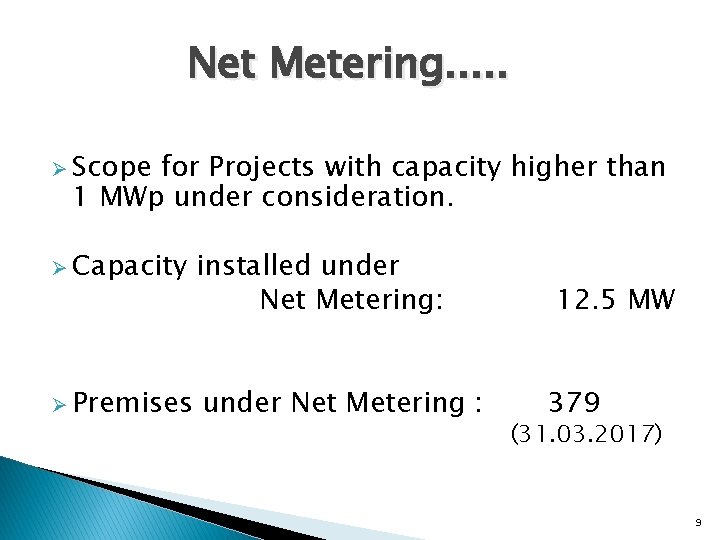
Net Metering. . . Ø Scope for Projects with capacity higher than 1 MWp under consideration. Ø Capacity installed under Net Metering: Ø Premises under Net Metering : 12. 5 MW 379 (31. 03. 2017) 9
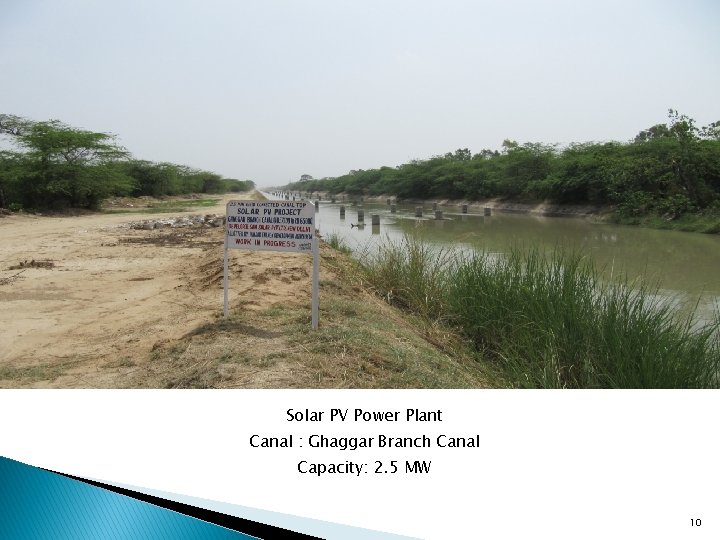
Solar PV Power Plant Canal : Ghaggar Branch Canal Capacity: 2. 5 MW 10
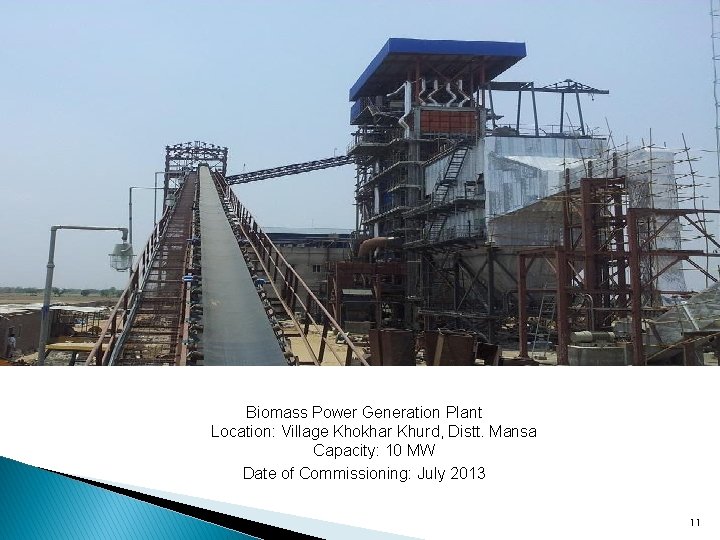
Biomass Power Generation Plant Location: Village Khokhar Khurd, Distt. Mansa Capacity: 10 MW Date of Commissioning: July 2013 11
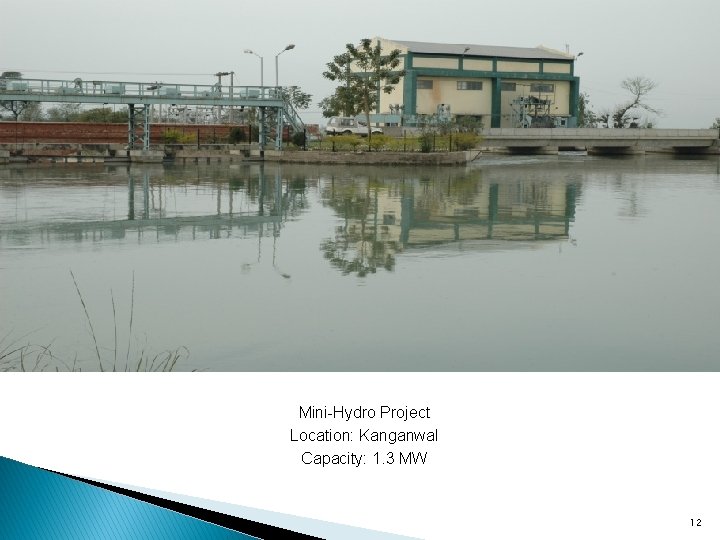
Mini-Hydro Project Location: Kanganwal Capacity: 1. 3 MW 12
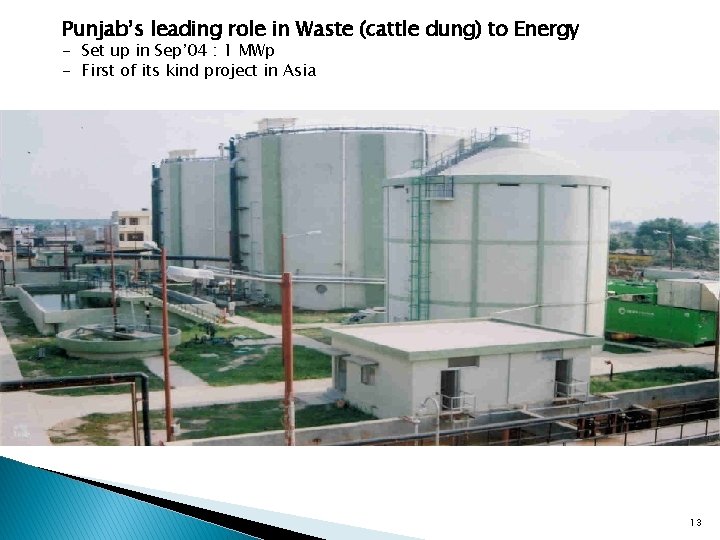
Punjab’s leading role in Waste (cattle dung) to Energy - Set up in Sep’ 04 : 1 MWp - First of its kind project in Asia 13
14
Renewable Potential in Punjab Ø Major thrust on Biomass & Solar. Ø Mini Hydro Potential almost fully harnessed. Ø No wind potential. Ø Lucrative generic tariff for Waste to Energy Projects announced in line with CERC Regulations, adopted by the State Commission. However, State facing public resistance. 15
Barriers in Renewable Sector Technical Grid Imbalance Ø Ø Continuous balance is required between electricity generation and consumption. Power systems must react if a generation source fails. Solar and wind energy power dependent on sun shine/wind. plants are Power from such plants can not be firmly forecasted. 16
Barriers. . . Ø Ø Ø Sudden removal of such power from grid leads to: � voltage imbalance � frequency variations � phase imbalance � generation of harmonics Arrangement of power from other sources is reqd at short notice to meet demand. Biomass and co-gen plants also not available throughout the year due to dependence on agri produce/fuel. 17
Barriers. . . Non-availability during peak hours Ø Solar power available during day time only. Ø Available during off peak hours. Ø Not helpful in meeting the morning/evening peak demand. 18
Barriers. . . Spinning reserve Ø Ø Spinning reserve allows to cope up with unpredictable imbalances between demand supply. With larger contribution of renewable power in the grid, difficult to plan such spinning reserve capacity due to unpredictable availability of renewable power. 19
Barriers. . . Energy storage Ø Ø Solar and wind energy are variable by nature. Dedicated energy storage is needed to support integration of larger solar and wind capacities. 20
Barriers. . . Commercial Economy of scale Ø Ø Ø Relatively higher per MW plant & machinery cost for renewable plants than conventional plants. Larger land area per MW required for solar, wind and even biomass. Higher Tariffs. 21
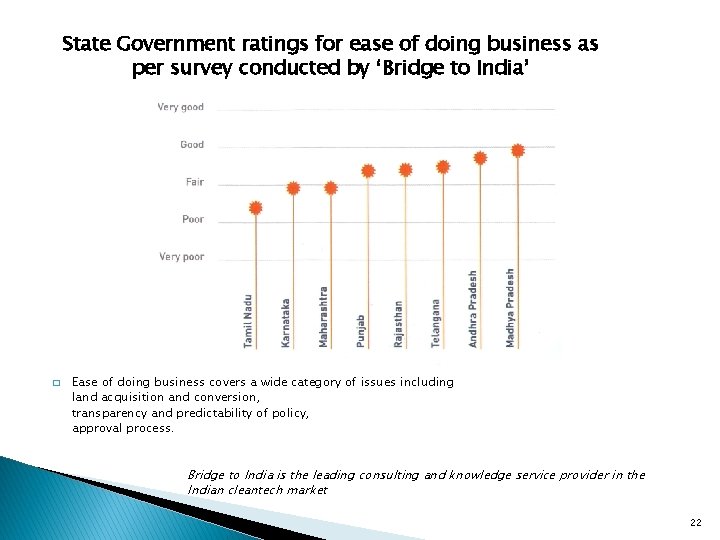
State Government ratings for ease of doing business as per survey conducted by ‘Bridge to India’ � Ease of doing business covers a wide category of issues including land acquisition and conversion, transparency and predictability of policy, approval process. Bridge to India is the leading consulting and knowledge service provider in the Indian cleantech market 22
Way Forward Ø Ø By way of ease of doing business, Punjab is one of the best States. Ranks better than Tamil Nadu, Karnataka, Maharashtra and is marginally behind Rajasthan, Andhra Pradesh and Madhya Pradesh. Strives to be No. 1 in ease of doing business. Efforts being made to further simplify the tendering, allocation and providing Grid connectivity to RE including Solar Projects. 23
Ø Ø Ø State Regulatory Commission fully geared to harness the Renewable Potential which will contribute towards the national agenda of clean & green power. Looking at the technical, commercial and other barriers, the role of conventional power cannot be wished away. The fulcrum / core of the power sector would have to be the conventional power and for the present, renewable contribution in the power mix can be visualized as 20%. 24
Thank you. 25
- Slides: 25