Regulation of Extracellular Fluid Osmolarity and Sodium Concentration


 Levels are High Figure 28")


 Beaver")
 Levels are High • Continue")


![Control of Extracellular Osmolarity (Na. Cl Concentration) • ADH ] • Thirst ADH -Thirst](https://slidetodoc.com/presentation_image_h/bbbc7fc183a11407d9ba5bd8b2551618/image-25.jpg "Control of Extracellular Osmolarity (Na. Cl Concentration) • ADH ] • Thirst ADH -Thirst")
 feedback mechanism for regulating extracellular fluid osmolarity")

 •")

")
 • Decreased")
 •")


 K+ Secretion • Aldosterone : increases K+")
")


![Mechanisms of Hydrogen Ion Regulation [H+] is precisely regulated at 3 - 5 x](https://slidetodoc.com/presentation_image_h/bbbc7fc183a11407d9ba5bd8b2551618/image-45.jpg "Mechanisms of Hydrogen Ion Regulation [H+] is precisely regulated at 3 - 5 x")


![Respiratory Regulation of Acid-Base Balance Alveolar Ventilation [H+] p. CO 2 H 2 O](https://slidetodoc.com/presentation_image_h/bbbc7fc183a11407d9ba5bd8b2551618/image-51.jpg "Respiratory Regulation of Acid-Base Balance Alveolar Ventilation [H+] p. CO 2 H 2 O")


 Key point: For each HCO 3")


 and Generation of")

 H")

 in the Collecting Tubules “New”")


- Slides: 76
Regulation of Extracellular Fluid Osmolarity and Sodium Concentration
Changes in Osmolarity of the Renal Tubular Fluid Figure 28 -7; Guyton and Hall
Concentration and Dilution of the Urine • Maximal urine concentration = 1200 - 1400 m. Osm / L (specific gravity ~ 1. 030) • Minimal urine concentration = 50 - 70 m. Osm / L (specific gravity ~ 1. 003)
Relationship Between Urine Osmolarity and Specific Gravity 1400 1200 1000 Influenced by • glucose in urine • protein in urine Urine Osmolarity 800 (m. Osm/L) 600 400 200 1. 010 Copyright © 2006 by Elsevier, Inc. 1. 020 1. 030 Urine Specific Gravity 1. 040
Water diuresis in a human after ingestion of 1 liter of water
Formation of a Dilute Urine • Continue electrolyte reabsorption • Decrease water reabsorption Mechanism: decreased ADH release and reduced water permeability in distal and collecting tubules
Formation of a Concentrated Urine • Continue electrolyte reabsorption • Increase water reabsorption Mechanism: • Increased ADH release which increases water permeability in distal and collecting tubules • High osmolarity of renal medulla • Countercurrent flow of tubular fluid
Formation of a Concentrated Urine when Antidiuretic Hormone (ADH) Levels are High Figure 28 -4; Guyton and Hall
Obligatory Urine Volume The minimum urine volume in which the excreted solute can be dissolved and excreted. Example: If the max. urine osmolarity is 1200 m. Osm/L, and 600 m. Osm of solute must be excreted each day to maintain electrolyte balance, the obligatory urine volume is: 600 m. Osm/d 1200 m. Osm/L = 0. 5 L/day
Obligatory Urine Volume In renal disease the obligatory urine volume may be increased due to impaired urine concentrating ability. Example: • If the max. urine osmolarity = 300 m. Osm/L, • If 600 m. Osm of solute must be excreted each day to maintain electrolyte balance • obligatory urine volume = ? 600 m. Osm/d 300 m. Osm/L = 2. 0 L/day
Maximum Urine Concentration of Different Animals Animal Max. Urine Conc. (m. Osm /L) Beaver Pig Human Dog White Rat Kangaroo Mouse Australian Hopping Mouse 500 1, 100 1, 400 2, 400 3, 000 6, 000 10, 000
Formation of a Concentrated Urine when Antidiuretic Hormone (ADH) Levels are High • Continue electrolyte reabsorption • Increase water reabsorption • Increased ADH • High osmolarity of renal medulla (countercurrent multiplier)
Factors That Contribute to Buildup of Solute in Renal Medulla - Countercurrent Multiplier • Active transport of Na+, Cl-, K+ and other ions from thick ascending loop of Henle into medullary interstitium • Active transport of ions from medullary collecting ducts into interstitium • Passive diffusion of urea from medullary collecting ducts into interstitium • Diffusion of only small amounts of water into medullary interstitium
Medullary Collecting Duct Transport Figure 27 -11; Guyton and Hall
Recirculation of Urea Absorbed from Medullary Collecting Duct into Interstitial Fluid Figure 28 -5; Guyton and Hall
Summary of Tubule Characteristics Permeability Tubule Segment Active Na. Cl Transport Proximal Thin Desc. Thin Ascen. Thick Ascen. Distal Cortical Coll. Inner Medullary Coll. ++ 0 0 +++ + H 2 O +++ 0 0 +ADH Na. Cl + + + 0 0 Urea + + + 0 0 0 +ADH
Countercurrent Multiplier System in the Loop of Henle
Net Effects of Countercurrent Multiplier 1. More solute than water is added to the renal medulla (i. e. , solutes are “trapped” in the renal medulla). 2. Fluid in the ascending loop is diluted. 3. Most of the water reabsorption occurs in the cortex (i. e. , in the proximal tubule and in the distal convoluted tubule) rather than in the medulla. 4. Horizontal gradient of solute concentration established by the active pumping of Na. Cl is “multiplied” by countercurrent flow of fluid.
Urea Recirculation • Urea is passively reabsorbed in proximal tubule. • In the presence of ADH, water is reabsorbed in distal and collecting tubules, concentrating urea in these parts of the nephron. • The inner medullary collecting tubule is highly permeable to urea, which diffuses into the medullary interstitium. • ADH increases urea permeability of medullary collecting tubule.
The Vasa Recta Preserve Hyperosmolarity of Renal Medulla • The vasa recta serve as countercurrent exchangers • Vasa recta blood flow is low (only 1 -2 % of total renal blood flow) Figure 28 -3; Guyton and Hall
Changes in Osmolarity of the Renal Tubular Fluid Figure 28 -7; Guyton and Hall
Summary of Water Reabsorption and Osmolarity in Different Parts of the Tubule • Proximal Tubule: 65 % reabsorption, isosmotic • Desc. loop: 15 % reasorption, osmolarity increases • Asc. loop: 0 % reabsorption, osmolarity decreases • Early distal: 0 % reabsorption, osmolarity decreases • Late distal and coll. tubules: ADH dependent water reabsorption and tubular osmolarity • Medullary coll. ducts: ADH dependent water reabsorption and tubular osmolarity
“Free” Water Clearance CH 2 O = V where: Uosm V P (CH 2 O) Uosm x V Posm = urine osmolarity = urine flow rate = plasma osmolarity If: Uosm < Posm, CH 2 O = + If: Uosm > Posm, CH 2 O = -
Disorders of Urine Concentrating Ability • Failure to produce ADH: “Central” diabetes insipidus • Failure to respond to ADH: “nephrogenic” diabetes insipidus - impaired loop Na. Cl reabs. (loop diuretics) - drug induced renal damage: lithium, analgesics - malnutrition (decreased urea concentration) - kidney disease: pyelonephritis, hydronephrosis, chronic renal failure
Control of Extracellular Osmolarity (Na. Cl Concentration) • ADH ] • Thirst ADH -Thirst Osmoreceptor System Mechanism: increased extracellular osmolarity (Na. Cl) stimulates ADH release, which increases H 2 O reabsorption, and stimulates thirst (intake of water)
Osmoreceptor– antidiuretic hormone (ADH) feedback mechanism for regulating extracellular fluid osmolarity
ADH synthesis in the magnocellular neurons of hypothalamus, release by the posterior pituitary, and action on the kidneys
Stimuli for ADH Secretion • Increased osmolarity • Decreased blood volume (cardiopulmonary reflexes) • Decreased blood pressure (arterial baroreceptors) • Other stimuli : - input from cerebral cortex (e. g. fear) - angiotensin II ? - nausea - nicotine - morphine
The effect of increased plasma osmolarity or decreased blood volume Figure 28 -10; Guyton and Hall
Factors that Decrease ADH Secretion • Decreased osmolarity • Increased blood volume (cardiopulmonary reflexes) • Increased blood pressure (arterial baroreceptors) • Other factors: - alcohol - clonidine ( -2 adrenergic agonist) - haloperidol (antipsychotic, tics, Tourette’s)
Stimuli for Thirst • Increased osmolarity • Decreased blood volume (cardiopulmonary reflexes) • Decreased blood pressure (arterial baroreceptors) • Increased angiotensin II • Other stimuli: - dryness of mouth
Factors that Decrease Thirst • Decreased osmolarity • Increased blood volume (cardiopulmonary reflexes) • Increased blood pressure (arterial baroreceptors) • Decreased angiotensin II • Other stimuli: -Gastric distention
Chapter 29:
Normal Potassium Intake, Distribution, and Output from the Body <2% > 98 %
Effects of severe hyperkalemia • Partial depolarization of cell membranes • Cardiac toxicity ventricular fibrillation or asystole Effects of severe hypokalemia • Hyperpolarization of cell membranes • Fatigue, muscle weakness • hypoventilation • delayed ventricular repolarization
Renal Tubular Sites of Potassium Reabsorption and Secretion Figure 29 -2; Guyton and Hall
Internal Distribution of K+ • Factors That Promote Hypokalemia - aldosterone - insulin -alkalosis • Factors That Promote Hyperkalemia - cell lysis - acidosis - strenuous exercise
K+ Secretion by Principal cells
Control of Cortical Collecting Tubule (Principal Cells) K+ Secretion • Aldosterone : increases K+ secretion • Extracellular K+ concentration : increases K+ secretion • Acid - base status: - acidosis : decreases K+ secretion - alkalosis : increases K+ secretion
Effect of Aldosterone on K+ Excretion 4 3 Urinary K+ Excretion 2 (x normal) 1 0 2 1 3 4 5 Plasma Aldosterone (x normal
K+ Intake Plasma K+ Concentration K+ Secretion Cortical Collecting Tubules K+ Excretion Aldosterone
Effect of Changes in K+ Intake on Plasma K+ After Blocking Aldosterone System 4. 6 4. 4 Plasma K+ Conc. 4. 2 (m. Eq/L) normal Aldosterone System blocked 4. 0 3. 8 30 60 90 120 150 180 210 K+ Intake ( m. Eq/day)
Mechanisms of Hydrogen Ion Regulation [H+] is precisely regulated at 3 - 5 x 10 -8 moles/L (p. H range 7. 2 -7. 4) 1. Body fluid chemical buffers (rapid but temporary) - bicarbonate - ammonia - proteins - phosphate 2. Lungs (rapid, eliminates CO 2) [H+] ventilation CO 2 loss 3. Kidneys (slow, powerful); eliminates non-volatile acids - secretes H+ - reabsorbs HCO 3 - generates new HCO 3 -
Buffer Systems in the body Bicarbonate: most important ECF buffer H 2 O + CO 2 H 2 CO 3 H+ + HCO 3 Phosphate: important renal tubular buffer HPO 4 -- + H+ H 2 PO 4 Ammonia: important renal tubular buffer NH 3 + H+ NH 4+ Proteins: important intracellular buffers H+ + Hb HHb (60 -70% of buffering is in the cells)
Importance of Buffer System Normal H+ concentration = 0. 00004 mmol/L Amount of non-volatile acid produced ~ 80 mmol/day 80 mmol /42 L = 1. 9 mmol/L = 47, 500 times > normal H+ concentration
Bicarbonate Buffer System carbonic anhydrase H 2 O + CO 2 H 2 CO 3 HCO 3 p. H = p. K + log p. CO 2 H+ + HCO 3 = 0. 03 p. K = 6. 1 Effectiveness of buffer system depends on: • concentration of reactants • p. K of system and p. H of body fluids
Titration Curve for Bicarbonate Buffer System
Bicarbonate Buffer System Is the most important buffer in extracellular fluid even though the concentration of the components are low and p. K of the system is 6. 1, which is not very close to normal extracellular fluid p. H (7. 4). Reason: the components of the system (CO 2 and HCO 3 -) are closely regulated by the lungs and the kidneys
Respiratory Regulation of Acid-Base Balance Alveolar Ventilation [H+] p. CO 2 H 2 O + CO 2 H 2 CO 3 H+ + HCO 3 -
Effects of Blood p. H on Alveolar Ventilation
Renal Regulation of Acid-Base Balance • Kidneys eliminate non-volatile acids (H 2 SO 4, H 3 PO 4) • Secretion of H+ • Reabsorption of HCO 3 • Production of new HCO 3 -
Renal Tubular Reabsorption of Bicarbonate (and H+ secretion) Key point: For each HCO 3 reabsorbed, there must be a H+ secreted
Mechanism of HCO 3 - Reabsorption and Na+ - H+ Exchange In Proximal Tubule and Thick Loop of Henle
HCO 3 - Reabsorption and H+ secretion in Intercalated cells of late distal and collecting tubules Figure 30 -6; Guyton and Hall
Regulation of H+ secretion • Increased p. CO 2 increases H+ secretion i. e. respiratory acidosis • Increased extracellular H+ increases H+ secretion i. e. metabolic or respiratory acidosis • Increased tubular fluid buffers increases H+ secretion i. e. metabolic or respiratory acidosis
Renal Compensations for Acid-Base Disorders • Acidosis: - increased H+ secretion - increased HCO 3 - reabsorption - production of new HCO 3 • Alkalosis: - decreased H+ secretion - decreased HCO 3 - reabsorption - loss of HCO 3 - in urine
Importance of Renal Tubular Buffers Minimum urine p. H = 4. 5 = 10 -4. 5 = 3 x 10 -5 moles/L i. e. the maximal [H+] of urine is 0. 03 mmol/L Yet, the kidneys must excrete, under normal conditions, at least 60 mmol non-volatile acids each day. To excrete this as free H+ would require: 60 mmol = 2000 L per day !!!. 03 mmol/L
Buffering of Secreted H+ by Filtered Phosphate (Na. HPO 4 -) and Generation of “New” HCO 3 -
Phosphate as a Tubular fluid buffer • There is a high concentration of phosphate in the tubular fluid; p. K = 6. 8 • Phosphate normally buffers about 30 mmol/day H+ (about 100 mmol/day phosphate is filtered but 70 % is reabsorbed) • Phosphate buffering capacity does not change much with acid-base disturbances (phosphate is not the major tubular buffer in chronic acidosis Na. HPO 4 - + H+ Na. H 2 PO 4
Phosphate and Ammonium Buffering In Chronic Acidosis 500 400 Acid 300 Excretion (mmoles/day) H 2 PO 4 + + NH 4 HSO 4 200 100 0 Normal Acidosis for 4 Days
Production and Secretion of NH 4+ and HCO 3 - by Proximal, Thick Loop of Henle, and Distal Tubules H++NH 3 “New” HCO 3 -
Buffering of Hydrogen Ion Secretion by Ammonia (NH 3) in the Collecting Tubules “New” HCO 3 - Figure 30 -9; Guyton and Hall
Quantification of Normal Renal Acid-Base Regulation Total H+ secretion = 4380 mmol/day = HCO 3 - reabsorption (4320 mmol/d) + titratable acid (Na. HPO 4 -) (30 mmol/d) + NH 4+ excretion (30 mmol/d) Net H+ excretion = 59 mmol/day = titratable acid (30 mmol/d) + NH 4+ excretion (30 mmol/d) - HCO 3 - excretion (1 mmol/d)
Normal Renal Acid-Base Regulation Net addition of HCO 3 - to body (i. e. , net loss of H+) Titratable acid + NH 4+ excretion - HCO 3 - excretion Total = 30 mmol/day = 1 mmol/day = 59 mmol/day
Classification of Acid Base Disorders from Plasma p. H; PCO 2 and HCO 3 - H 2 O + CO 2 H 2 CO 3 H+ + HCO 3 - HCO 3 p. H = p. K + log α ��p. CO 2 Acidosis: p. H < 7. 4 - metabolic: - respiratory: HCO 3 p. CO 2 Alkalosis: p. H > 7. 4 - metabolic: HCO 3 - respiratory: p. CO 2
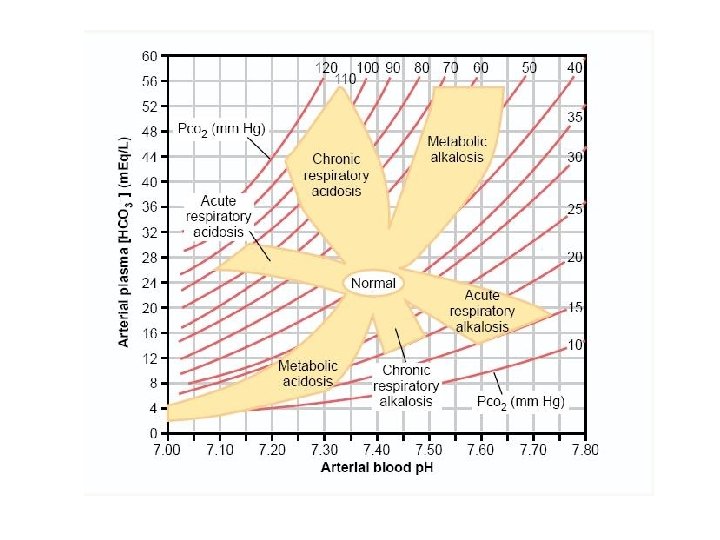
Simple Analysis of Acid-Base Disorders Figure 30 -10; Guyton and Hall
Renal Compensation of Acid-Base Disorders • Acidosis: - increased H+ excretion - increased HCO 3 - reabsorption - production of new HCO 3 - • Alkalosis - decreased H+ excretion - decreased HCO 3 - reabsorption - loss of HCO 3 - in urine
Renal Responses to Respiratory Acidosis H 2 O + CO 2 H 2 CO 3 Respiratory acidosis: PCO 2 p. H H+ secretion p. H H+ + HCO 3 p. CO 2 HCO 3 - complete HCO 3 - reabs. + excess tubular H+ Buffers (NH 4+, Na. HPO 4 -) H+ Buffers + new HCO 3 -
Renal Responses to Metabolic Acidosis Metabolic acidosis: HCO 3 p. H HCO 3 filtration p. CO 2 HCO 3 - complete HCO 3 - reabs. + excess tubular H+ Buffers (NH 4+, Na. HPO 4 -) H+ Buffers + new HCO 3 -
Renal Response to Respiratory Alkalosis Respiratory alkalosis: PCO 2 p. H H+ secretion p. CO 2 HCO 3 - reabs. + excess tubular HCO 3 - p. H HCO 3 - excretion + H+ excretion
Renal Response to Metabolic Alkalosis Metabolic alkalosis: HCO 3 p. H HCO 3 filtration p. CO 2 HCO 3 - excess tubular HCO 3 - reabs. HCO 3 - excretion + H+ excretion
Classification of Acid Base Disturbance p. H Plasma HCO 3 - p. CO 2 Compensation metabolic acidosis ventilation renal HCO 3 production respiratory acidosis renal HCO 3 production metabolic alkalosis ventilation renal HCO 3 excretion respiratory alkalosis renal HCO 3 excretion
Acid-Base Disturbances Metabolic Acidosis: HCO 3 - / p. CO 2 in plasma ( p. H, HCO 3 - ) - aspirin poisoning ( H+ intake) - diabetes mellitus ( H+ production) - diarrhea (HCO 3 - loss) - renal tubular acidosis ( H+ secretion, HCO 3 - reabs. ) - carbonic anhydrase inhibitors ( H+ secretion) H 2 O + CO 2 H 2 CO 3 H+ + HCO 3 p. H = p. K + log p. CO 2